Generating Scaled Replicas of Real-World Complex Networks Christian L. Staudt1 , Michael Hamann1 , Ilya Safro2 , Alexander Gutfraind3 , and Henning Meyerhenke1
arXiv:1609.02121v1 [cs.SI] 7 Sep 2016
1
Institute of Theoretical Informatics, Karlsruhe Institute of Technology (KIT), Karlsruhe, Germany, {christian.staudt,michael.hamann,meyerhenke}@kit.edu 2 School of Computing, Clemson University, Clemson, SC, USA,
[email protected] 3 Loyola University Medical Center, Maywood, IL, USA/Uptake, Inc., Chicago, IL, USA;
[email protected]
Abstract. Research on generative models plays a central role in the emerging field of network science, studying how statistical patterns found in real networks can be generated by formal rules. During the last two decades, a variety of models has been proposed with an ultimate goal of achieving comprehensive realism for the generated networks. In this study, we (a) introduce a new generator, termed ReCoN; (b) explore how models can be fitted to an original network to produce a structurally similar replica, and (c) aim for producing much larger networks than the original exemplar. In a comparative experimental study, we find ReCoN often superior to many other state-of-the-art network generation methods. Our design yields a scalable and effective tool for replicating a given network while preserving important properties at both micro- and macroscopic scales and (optionally) scaling the replica by orders of magnitude in size. We recommend ReCoN as a general practical method for creating realistic test data for the engineering of computational methods on networks, verification, and simulation studies. We provide scalable open-source implementations of most studied methods, including ReCoN.
1
Introduction
Context. When engineering algorithms, the ability to create good synthetic test data sets is valuable to estimate effectiveness and scalability of the proposed methods. A shortage of real data for this purpose can for example arise if they are proprietary, sensitive, or unavailable in different scales. In the context of developing network analysis algorithms, realistic synthetic graphs allow us to produce experimental results that are representative for what can be observed for real data. Among the main use cases are obfuscation (replacing restricted real data with similar synthetic data), compression (storing only a generator and its parameters instead of large graphs), as well as extrapolation and sampling (generating data at larger or smaller scales). Problem definition. We envision two usage scenarios: Given an original (or real) network O = (V, E) (no = |V |, and mo = |E|) that cannot be freely shared, we would like to be able to create a synthetic network R (with nr nodes) that matches the original in essential structural properties, so that computational results obtained from processing
this network are representative for what the original network would yield. We refer to R as a replica. We assume that whoever creates the replica has access to O and can pass it to a model fitting algorithm which uses it to parametrize a generative model. More importantly, in addition to producing scale-1 replicas (where nr = no ), in the second scenario we want to use the generative model for extrapolation: We want to parametrize it so that it produces a scaled replica Rx that has nr = x · no nodes, where x is called the scaling factor. The structural properties of Rx should be such that they resemble a later growth stage of the original (also see Sec. 2). This should enable users of the replica to extrapolate the behavior of their methods when the network data is significantly scaled. Finally, with respect to performance, we would like the generator algorithm and implementation as well as the fitting scheme to be efficient enough to produce large data sets (on the order of several millions of nodes and edges) quickly in practice. State of the art. Many generative models for complex networks exist. We point the interested reader to a survey [13] for a more comprehensive overview. A widely used model intended for model fitting uses exponential random graph models (ERGM), cf. e. g. [26]. Unfortunately, ERGM are so expensive that graphs with tens of thousands of nodes are already considered big for these models [3]. Other generative models admit fast generators and are thus in our focus. Among those models are RMAT [7], BTER [17], and Hyperbolic Unit Disk Graphs (HUDG) [18]. Initially, they can fit only few properties of the original network by design, though. A previous fitting scheme by Leskovec et al. [21] for RMAT graphs is quite time-consuming already for medium-sized networks, see Appendix A.4 and [29]. Editing models create a synthetic network by editing the original network. The MUSKETEER generator [15] implements a multiscale editing model and is effective for obfuscation purposes. However, its current implementation [14] is not fast enough to generate sufficiently scaled replicas of large graphs. Outline and contribution. In this paper we develop and evaluate a sufficiently fast generator that focuses on creating realistic scaled replicas of complex networks. We point out in Section 2 which criteria we consider important for calling a (scaled) replica realistic. In particular we conceptualize realism in two ways: (i) matching an original graph in a set of important structural properties, and (ii) matching the running time behavior of various graph algorithms. Our new generator ReCoN, short for Replication of Complex Networks and described in Section 3, uses and extends ideas of LFR, a generator used for benchmarking community detection algorithms. Using the original degrees and a found community structure we are able to capture a much-more detailed signature of the network than a parametrization of the LFR generator. In Section 4 we discuss the generative models that we use for comparison (among them RMAT, HUDG, and BTER) and develop model fitting schemes for them. Our comparative experimental study in Section 5 indicates that ReCoN performs overall quite well and usually better than other generators in terms of realism. We can also conclude that the ReCoN implementation is fast, as it is capable of creating realistic scaled replicas on the scale of 108 edges in minutes. The ReCoN code is publicly available in the open-source network analysis package NetworKit [31]. 2
2
Realistic Replicas
We consider a generative model realistic if there is high structural similarity between the synthetic graphs produced and relevant real-world networks. It is neither our goal nor generally desirable to obtain an exact correspondence between original and replica. First, this would exclude the use case of obfuscation. Secondly, obtaining an isomorphic graph is rarely required for generalizable experiments. Note that we consider a single “realism score” for each model inappropriately reductionist. Rather, we quantify diverse aspects of realism in our experimental evaluation and leave it to the reader to decide about their relative importance. For 1-scale replicas (with the same size as the original), we measure the similarity in terms of a set of commonly used metrics: Sparsity (number of edges vs number of nodes); degree distribution (more precisely its Gini coefficient); maximum degree as a proxy for the connectedness of hub nodes; average local clustering coefficient to measure the local presence of triangles; diameter to monitor the small-world effect; number of connected components and number of communities as additional non-local features. These metrics cover both local and global properties and are deemed important characteristics of networks [24]. How can we extend the notion above regarding realism to scaled replicas of a network? To answer this question, let us look at the scaling behavior of a set of 100 Facebook social networks [33]. These networks were collected at an early stage of the Facebook online social networking service in which networks were still separated by universities. Fig. 1 plots basic structural measures of these Facebook networks against the number of nodes n, as well as a regression line and confidence intervals (shaded area) to emphasize the trend. While linear regression may not always seem completely appropriate for these data, the general trend is still captured. We can observe from Fig. 1 a growth of the number of edges m that is linear in n, an increase in the skew of the node degree distribution as measured by the Gini coefficient, a growing maximum node degree, a slightly falling average local clustering coefficient, a nearly constant small diameter of the largest connected component, and a slightly growing number of connected components (which can be explained by some small connected components that exist in addition to a giant component). We detect communities using PLM (Parallel Louvain Method), a modularity-based community detection heuristic [30], and report the number of communities minus the number of these small connected components. It can be observed that the number of non-trivial communities grows slightly. While we do not propose that these scaling laws are universal, the trends represented here are commonly observed [6,5,28]. Thus, we use them to define desired scaling properties for the remainder of the study as follows: m grows linearly with n; the diameter does not change significantly, preserving the “small world property”; the shape of the degree distribution remains skewed; the maximum node degree increases; the number of connected components may grow; the number of communities increases slightly. Recall that one use case for our generator is testing of graph and network analysis algorithms. Since the running time is an essential feature in such tests, we also consider a realistic replication of running times important. To this end, we select a set of graph algorithms that (i) compute important features of networks and are thus frequently 3
0.5 0.0
12 11 10 9 8 7 6 5
0
1
2
n
3
4 1e4
comp
dia
0.5
0
1
2
n
3
4 1e4
35 30 25 20 15 10 5 0 5
0.60 0.55
0
1
0.50
avg_lcc
m
1.0
1.0 1e4 0.8 0.6 0.4 0.2 0.0 0.2 0 1
gini_deg
max_deg
1.5
0.45 0.40
2
3
n
2
n
3
4 1e4
0.35
4 1e4
communities
2.0 1e6
18 16 14 12 10 8 6 4
0
0
1
1
2
n
2
3
n
3
4 1e4
0.45 0.40 0.35 0.30 0.25 0.20 0.15 0.10
0
1
2
n
3
4 1e4
4 1e4
Fig. 1. Scaling behavior of 100 Facebook networks; from left to right and top to bottom: number of edges, maximum degree, Gini coefficient of degree distribution, average local clustering coefficient, diameter, number of components, number of communities found by PLM
used in network analysis tasks and that (ii) cover a variety of patterns of computation and data access, each of which may interact differently with the graph structure. The set consists of algorithms for connected components (essentially breadth-first search), PageRank (via power iteration), betweenness approximation (according to Geisberger et al. [12]), community detection (PLM, [30]), core decomposition (according to [10]), triangle counting (according to [16]), and spanning forest (essentially Kruskal’s algorithm without edge weights).
3
The Generation Algorithm ReCoN
We introduce ReCoN, a generator for replicating and scaling complex networks. Its input is a graph and a community structure on it. For fitting a given graph without given community structure, we use PLM [30] in order to detect a community structure first. The basic idea of ReCoN is to randomize the edges inside communities and the edges between communities while keeping the node degrees. This happens separately such that each community keeps as many edges as it had before. For scaling a graph, we first create as many disjoint copies of the graph as desired and then apply the aforementioned steps. During the randomization of the edges between the communities the copies usually become connected with each other. The idea of randomizing graphs inside and between communities is inspired by the LFR generator, a benchmark graph generator for community detection algorithms [20]. There the basic building blocks are also a random subgraph per community and a global graph. However, in the LFR generator the degrees and communities are not given but generated using a power law degree distribution and a power law community size distribution with nodes assigned to communities at random, while ReCoN uses the given graph as input for them. 4
For randomizing graphs while preserving the degree sequence we use random edge switches where two edges {u, v}, {y, z} chosen uniformly at random are changed into {u, z}, {y, v} if the resulting graph is still simple, i. e. does not contain any duplicate edges or self-loops. Similar to the edge switching implementation provided by [34] we use 10 times the number of edges as the number of random edge switches. Previously performed experiments (e. g. [23]) have shown that this is enough to expect the resulting graph to be drawn uniformly at random from all graphs with the given degree sequence. For an original graph O = (V, E) with no = |V | nodes and a desired scaling factor x, ReCoN executes the following steps: 1. Detect a community structure C = {C1 , . . . ,Ck } on G using PLM. 2. Create H as the disjoint union of x copies of G. The community structure is also copied such that the new community structure D = {D1 , . . . , Dx·k } consists of x · k communities, i. e. each copy of G gets its own copy of the community structure that is aligned with the structure of the copied graph. 3. For each community Di , 1 ≤ i ≤ x · k, randomize the edges of the subgraph H[Di ] that is induced by the community Di while keeping the degree distribution using random edge switches. 4. Randomize the remaining edges, i. e. all edges in H that are not part of one of the subgraphs H[Di ] using random edge switches. Note that afterwards some edges that were not in one of the H[Di ] can now be inside a community. In order to avoid this, rewiring steps are performed by executing edge switches of such forbidden edges with random partners. A similar step is also used in the LFR generator where it was observed that in practice only few rewiring steps are necessary [19]. Note that it is not necessary to start with the original graph in step 3 and 4. Using any graph with the same degree sequence is enough as the result is random anyway. Therefore, it is enough to know a community structure (as opposed to the whole original graph) and for each node the internal and external degree, i. e. how many neighbors it has inside and outside its community, respectively. For our implementation we choose this alternative. Further, we execute step 3 in parallel for all communities as the subgraphs are disjoint. In addition to replicating important properties with high fidelity, the randomization in step 3 and 4 naturally produces random variance among the set of replicas.
4
Fitting Generative Models to Input Graphs
Parametrized generative models require fitting schemes for learning parameters from the original network. Because, usually, such schemes are not unique, exploring them would be important future work. For this study, we have chosen one scheme per model, parameters of which are summarized in Table 1 in Appendix A. Below we discuss a fitting scheme for power law degree distributions, and briefly describe the generative models that are compared with ReCoN. Fitting power law degree distribution (PLD). We apply our custom power law fitting scheme. A practical replication of a network requires preserving the original average (otherwise, the density will be changed) as well as minimum and maximum degrees 5
(applications can be sensitive to such fundamental properties as degree-1 nodes and the distribution of hubs). In general, it is assumed (and implemented in many algorithms [9]) that PLD only holds starting with a minimum degree and that for smaller degrees, the distribution might be different. As the LFR generator only generates a plain PLD, we cannot apply this assumption. Therefore, we fit the PLD exponent such that, with the given minimum and maximum degree, the average degree of the real network is expected when a degree sequence is sampled from this PLD. Using binary search in the range of [−6, −1], we repeatedly calculate the expected average degree until the power law exponent is accurate up to an error of 10−3 . Erd˝os–Rényi, Barabasi-Albert, Chung-Lu and ESMC. Erd˝os–Rényi random graphs (ER) [25] are fundamental and an important baseline with the edge probability parameter that we set to produce the same edge-to-node ratio as in O. The Barabasi–Albert model (BA) [2] implements a preferential attachment process by which a PLD emerges, which has been claimed to be a typical feature of real complex networks. In BA, we set the number of edges coming with each new node to fit the original edge-to-node ratio. The Chung-Lu (CL) model [1] recreates a given degree sequence in expectation. The Edge-Switching Markov Chain Generator (ESMC) generates a graph that is randomly drawn from all graphs with exactly the given degree sequence (see e.g. [23], [27]). In both CL and ESMC we use the original degree sequence. To generate larger networks, x copies of this sequence are concatenated, multiplying the number of nodes by x while keeping the relative frequency of each degree. RMAT. The Recursive Matrix (RMAT) model [8] was proposed to recreate various properties of complex networks, including an optional power-law degree distribution, the small-world property and self-similarity. The RMAT model can only generate graphs with 2s nodes, where s is an integer scaling parameter. In order to target a fixed number of nodes nr , we calculate s so that 2s > nr and delete 2s − nr random nodes. The choice of other parameters as well as the running time of fitting are discussed in Appendix A.4. Hyperbolic Unit Disk Graphs (HUDG). The random hyperbolic graph model embeds nodes into hyperbolic geometry and connects close nodes with higher probability [18]. The unit-disk variant HUDG we use in this paper connects only nodes whose distance is below a certain threshold. We are focussing on the unit-disk variant to be able to use a very fast generator for this model [22]. The model has been shown to replicate some properties observed in real networks, such as a power-law degree distribution. This method receives as parameters the desired number of nodes, the average degree of the original network and a power law exponent which is fitted as described above. As the given power law exponent must be larger than 2, we supply at least an exponent of 2.1. BTER. This method receives a degree distribution and the desired clustering coefficient per degree, i.e., for each degree to be realized the number of occurrences and the average clustering coefficient per degree. For scaled replicas we scale the occurrences of all degrees by the scaling factor. This leads to the target number of nodes while also preserving the general shape of the degree distribution. In order to retain the distribution of the clustering coefficients, we leave them unchanged while scaling the network. 6
LFR. LFR was designed as a benchmark graph generator for community detection algorithms [20]. Apart from the number of nodes it requires parameters for power law distributions of the node degrees and the community sizes, and a mixing parameter that determines the ratio between intra- and inter-cluster edges. We detect communities using PLM [30] and fit the parameters for the two power law distributions as described above using the original degree sequence and the found community sizes. The mixing parameter is set to the ratio between intra- and inter-cluster edges of the found communities. The details are described in Appendix A.7.
5
Computational Experiments
Our implementations of ReCoN and the various fitting methods are based on NetworKit [31], a tool suite for scalable network analysis. It also contains many of the generators we use for comparison and provides a large set of graph algorithms we use for our experiments. NetworKit combines C++ kernels with an interactive Python shell to achieve both high performance and interactivity, a concept we use for our implementations as well. All implementations are freely available as part of the package at https://networkit.iti.kit.edu. This also includes a faster and parallel implementation of the LFR generator (compared to the original implementation [11]). Our experimental platform is a shared-memory server with 256 GB RAM and 2x8 Intel(R) Xeon(R) E5-2680 cores at 2.7 GHz, using the GCC 4.8 compiler and the openSUSE 13.1 OS. More technical details are available in Appendix B. As described in Section 2, we are interested in how well the different generators replicate certain structural features of the original networks as well as the running times of various graph algorithms. The results are described subsequently. Scaling behavior of the generators. The following experiments consider the scaling behavior of generative models. Given the parametrization discussed before, we look at the evolution of structural features with growing scale factor x up to x = 32. We consider the same basic scalar features as for the real networks in Sec. 2 and, due to space constraints, point to [29] for more results. In Figure 2, we show the results of the scaling experiments for the fb-Caltech36 network. The number of edges of the replicas is increased almost linearly by all generators to ≈ 5 · 105 edges which approximately corresponds to 32 times the edges of the original network. Therefore, all generators seem to keep the average degree of the original network, which is expected as it is a parameter of all considered generators. Surprisingly, the maximum degree strongly increases up to 10 or 15 thousand with HUDG and BA generators, respectively. The original maximum degree is 248, so that the new value is even significantly higher than the scaled maximum degree (i. e. 248 · 32). Actually, from the scaling study in Sec. 2, we could expect an increase, but rather in a lower range, so the degree distribution of BA and HUDG generators are not realistic. Concerning the Gini coefficient, one can clearly see that ER does not generate a skewed degree distribution at all. All generators that get the exact degree sequence as input keep the Gini coefficient constant, which is expected and also relatively realistic from our scaling study. 7
2 0 2 0.0 0.5 1.0 1.5 2.0 1e4 n
2.5 1e1 1.5
comp
dia
2.0 1.0 0.5 0.0 0.0 0.5 1.0 1.5 2.0
n
1e4
1.0 1e3 0.8 0.6 0.4 0.2 0.0 0.2 0.4 0.0 0.5 1.0 1.5 2.0 1e4 n
3.0
avg_lcc
m
4
1e 1 6 5 4 3 2 1 0 0.0 0.5 1.0 1.5 2.0 1e4 n
1e 1 8 7 6 5 4 3 2 1 0 0.0 0.5 1.0 1.5 2.0 1e4 n
1e2
2.5
communities
max_deg
6
3.0 1e4 2.5 2.0 1.5 1.0 0.5 0.0 0.5 1.0 0.0 0.5 1.0 1.5 2.0 1e4 n
gini_deg
8 1e5
2.0 1.5 1.0 0.5 0.0 0.5 0.0 0.5 1.0 1.5 2.0 1e4 n
model
Erdos Renyi Barabasi Albert Chung Lu ESMC Hyperbolic Unit Disk BTER ReCoN LFR RMAT
Fig. 2. Scaling behavior of the different generators on the fb-Caltech36 network. From left to right and top to bottom: number of edges, max. degree, Gini coefficient of the degree distribution, average local clustering coefficient, diameter, number of components, number of communities.
The original average local clustering coefficient of 0.43 is almost exactly reproduced by BTER in which it is an input parameter. The HUDG method increases it to 0.8, most others obtain very small values. Our new ReCoN generator is less far off with 0.25 and a slightly decreasing clustering coefficient; the latter is actually realistic as we saw in Sec. 2. LFR is able to generate a clustering coefficient above 0.2 initially. Other generators produce much lower clustering coefficients. The original diameter of 6 is almost exactly kept by ReCoN, all other generators except BTER produce networks with slightly lower diameters, while BTER generates networks whose diameter is almost twice bigger. All generators show a slight increase of the diameter when the networks are larger, which is consistent with our scaling study. While most generators produce networks with just a single connected component, CL and BTER generate a large number, RMAT and ReCoN a moderate number of connected components. In the case of CL, BTER and RMAT, this is probably due to a large number of degree-0 nodes. The original network consists of a giant component and 3 small components; ReCoN scales them linearly, which is due to its parametrization. The original network is split into eight non-trivial communities, that number should increase slowly according to Sec. 2. Only in the networks generated by BTER, ReCoN and LFR, PLM can find a significant and increasing amount of communities. While PLM finds over 100 non-trivial communities in the network generated by BTER, there are fewer communities detectable in the networks generated by ReCoN and even less in the ones generated by LFR. Overall, ReCoN is the only generator that keeps the degree distribution, and produces a realistic clustering coefficient and a small diameter while keeping the graph connected and preserving a moderate number of communities. All other generators are either unable to keep the diameter or the connectivity or the number of communities. 8
109
Edges per Second
108
107
106
model
original Erdos Renyi Barabasi Albert RMAT Chung Lu ESMC Hyperbolic Unit Disk BTER LFR ReCoN
105 Connected Components
PageRank
Betweenness (ap.)
Community Detection
Core Decomposition
Triangle Counting
Spanning Forest
algorithm
Fig. 3. Running time replication of a set of network analysis algorithms. Running times are in edges per second, i.e., higher is faster.
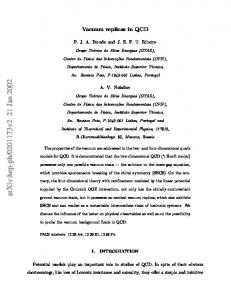
It is part of future work to investigate whether the full hyperbolic random graph model can alleviate the weaknesses of the unit-disk case. Replicating running times of graph algorithms. Synthetic graphs are frequently used in algorithm engineering to estimate the running time of an algorithm assuming that this time will be similar on real networks. We examine if this is indeed the case with the generative models we consider. Using the previously described generators and fitting schemes, we generate replicas of 100 Facebook networks and test a variety of graph algorithms (see Sec. 2) on both the original and replica sets. Our experiments demonstrate (see Fig. 3) that the running times on the replica sets often do not match those on the original set. The gray segments of the box plots represent the distribution of running times measured on a set of original networks. Ideally, the distribution on the synthetic networks would be identical. The difference is statistically nontrivial, though. Small variance between the models exists for connected components and spanning forest computations, since their running time is nearly constant per edge. Other algorithms exemplify how much running time can depend on network structure, especially community detection, core decomposition, triangle counting and PageRank. In general, the running time measurements obtained on ReCoN match the originals closely in most cases. An exception is community detection, where PLM seems to profit from ReCoN’s explicit model of communities. BTER shows close matches, too. Generator running times. In Fig. 4, we show the running times of parameter fitting and generating a replica for all methods. Processing speed is given in the number of edges per second. The entire set of Facebook networks was used to produce the measurements, so generated replicas range from about 15000 to 1.5 million edges. For all models, generating the graph takes up the vast majority of time. BTER’s MATLABbased implementation is slowest, while the ER and HUDG generators are the fastest. Our implementations of LFR and ReCoN are not among the fastest generators, but fast enough to produce millions of edges in minutes. 9
Edges per Second
108 107 106 105 104
AT R M
R LF
oN eC R
tD is BT k ER
ni U
Lu
M C ES
ng hu
lic bo
iA ra b
as
s
H
yp
er
Ba
Er do
C
R
lb
en
er
t
yi
103
model
Fig. 4. Fitting and generating: processing speed measured in edges/s (size of replica graph / total running time, measured on 100 Facebook graphs)
6
Conclusion
We have presented a new generator, ReCoN, for replicating and scaling existing networks. In an extensive experimental evaluation (not all results could be shown due to space constraints, see [29] for more results) we have shown that ReCoN is capable of generating networks which are (i) similar to the original network in terms of important structural measures and (ii) lead to similar running times of many graph and network analysis algorithms. Using ReCoN it is possible to realistically replicate an existing network, and to scale the synthetic version by orders of magnitude, e. g., in order to test algorithms on larger data sets where they are not available. Furthermore, it allows to create anonymized copies of such networks that can be distributed freely and allow to conduct representative experiments on them. While other generators sometimes perform better concerning certain criteria, none of the other generators is capable of approximately reproducing such a wide range of properties and running times.
Acknowledgments This work is partially supported by the DFG under grants ME 3619/3-1 and WA 654/221 within the Priority Programme 1736 Algorithms for Big Data. Funding was also provided by Karlsruhe House of Young Scientists via the International Collaboration Package.
References 1. Aiello, W., Chung, F., Lu, L.: A random graph model for massive graphs. In: Proceedings of the thirty-second annual ACM symposium on Theory of computing, pp. 171–180. Acm (2000) 2. Albert, R., Barabási, A.: Statistical mechanics of complex networks. Reviews of modern physics 74(1), 47 (2002)
10
3. An, W.: Fitting ERGMs on big networks. Social Science Research 59, 107 – 119 (2016). Special issue on Big Data in the Social Sciences 4. Batagelj, V., Brandes, U.: Efficient generation of large random networks. Physical Review E 71(3), 036,113 (2005) 5. Boccaletti, S., Latora, V., Moreno, Y., Chavez, M., Hwang, D.U.: Complex networks: Structure and dynamics. Physics reports 424(4), 175–308 (2006) 6. Caldarelli, G., Vespignani, A.: Large scale structure and dynamics of complex networks. World Scientific (2007) 7. Chakrabarti, D., Zhan, Y., Faloutsos, C.: R-MAT: A recursive model for graph mining. In: Proc. 4th SIAM Intl. Conf. on Data Mining (SDM). SIAM, Orlando, FL (2004) 8. Chakrabarti, D., Zhan, Y., Faloutsos, C.: R-MAT: A recursive model for graph mining. Computer Science Department p. 541 (2004) 9. Clauset, A., Shalizi, C.R., Newman, M.E.: Power-law distributions in empirical data. SIAM review 51(4), 661–703 (2009) 10. Dasari, N.S., Ranjan, D., Zubair, M.: ParK: An efficient algorithm for k-core decomposition on multicore processors. In: 2014 IEEE International Conference on Big Data, Big Data 2014, Washington, DC, USA, October 27-30, 2014, pp. 9–16. IEEE (2014) 11. Fortunato, S.: Benchmark graphs to test community detection algorithms. URL https: //sites.google.com/site/santofortunato/inthepress2 12. Geisberger, R., Sanders, P., Schultes, D.: Better approximation of betweenness centrality. In: ALENEX, pp. 90–100. SIAM (2008) 13. Goldenberg, A., Zheng, A.X., Fienberg, S.E., Airoldi, E.M.: A survey of statistical network R in Machine Learning 2(2), 129–233 (2010) models. Foundations and Trends 14. Gutfraind, A., Meyers, L., Safro, I.: Musketeer: Multiscale entropic network generator. URL https://people.cs.clemson.edu/~isafro/musketeer/index.html 15. Gutfraind, A., Safro, I., Meyers, L.A.: Multiscale network generation. In: 18th International Conference on Information Fusion, FUSION 2015, Washington, DC, USA, July 6-9, 2015, pp. 158–165 (2015) 16. Hamann, M., Lindner, G., Meyerhenke, H., Staudt, C.L., Wagner, D.: Structure-preserving sparsification methods for social networks. Social Netw. Analys. Mining 6(1), 22:1–22:22 (2016) 17. Kolda, T.G., Pinar, A., Plantenga, T., Seshadhri, C.: A scalable generative graph model with community structure. arXiv preprint arXiv:1302.6636 (2013) 18. Krioukov, D., Papadopoulos, F., Kitsak, M., Vahdat, A., Boguñá, M.: Hyperbolic geometry of complex networks. Physical Review E 82, 036,106 (2010) 19. Lancichinetti, A., Fortunato, S.: Benchmarks for testing community detection algorithms on directed and weighted graphs with overlapping communities. Physical Review E 80(1), 016,118 (2009) 20. Lancichinetti, A., Fortunato, S., Radicchi, F.: Benchmark graphs for testing community detection algorithms. Physical Review E 78(4), 046,110 (2008) 21. Leskovec, J., Faloutsos, C.: Scalable modeling of real graphs using kronecker multiplication. In: Proc. 24th Intl. Conference on Machine learning, pp. 497–504. ACM (2007) 22. von Looz, M., Meyerhenke, H., Prutkin, R.: Generating random hyperbolic graphs in subquadratic time. In: Algorithms and Computation - 26th International Symposium, ISAAC 2015, Nagoya, Japan, December 9-11, 2015, Proceedings, pp. 467–478 (2015) 23. Milo, R., Kashtan, N., Itzkovitz, S., Newman, M.E.J., Alon, U.: On the uniform generation of random graphs with prescribed degree sequences. eprint arXiv:cond-mat/0312028 (2003) 24. Newman, M.: Networks: an introduction. Oxford University Press (2010) 25. P. Erd˝os, A.R.: On the Evolution of Random Graphs. Publication of the Mathematical Institute of the Hungarian Academy of Sciences (1960)
11
26. Robins, G., Pattison, P., Kalish, Y., Lusher, D.: An introduction to exponential random graph (p*) models for social networks. Social Networks 29(2), 173 – 191 (2007). Special Section: Advances in Exponential Random Graph (p*) Models 27. Schlauch, W.E., Horvát, E.Á., Zweig, K.A.: Different flavors of randomness: comparing random graph models with fixed degree sequences. Social Network Analysis and Mining 5(1), 1–14 (2015). DOI 10.1007/s13278-015-0267-z 28. Snijders, T.A.: The statistical evaluation of social network dynamics. Sociological methodology 31(1), 361–395 (2001) 29. Staudt, C.L.: Algorithms and software for the analysis of large complex networks. Ph.D. thesis, Karlsruhe Institute of Technology (2016). DOI 10.5445/IR/1000056470 30. Staudt, C.L., Meyerhenke, H.: Engineering parallel algorithms for community detection in massive networks. IEEE Trans. on Parallel and Distributed Systems 27(1), 171–184 (2016) 31. Staudt, C.L., Sazonovs, A., Meyerhenke, H.: NetworKit: A tool suite for large-scale network analysis. Network Science To appear 32. Tamara G. Kolda Ali Pinar, S.N.L.: Feastpack. URL http://www.sandia.gov/ ~tgkolda/feastpack/ 33. Traud, A.L., Mucha, P.J., Porter, M.A.: Social structure of facebook networks. Physica A: Statistical Mechanics and its Applications 391(16), 4165–4180 (2012) 34. Viger, F., Latapy, M.: Random generation of large connected simple graphs with prescribed degree distribution. In: 11th International Conference on Computing and Combinatorics. Kunming, Yunnan, Chine (2005)
12
A
Fitting Generative Models to Input Graphs
A fitting scheme is an algorithm that takes a network as input and estimates parameters of a generative model. For this work, we test straightforward fitting schemes. We do not claim that they are the only possible or optimal schemes. Exploring different schemes would be relevant future work, but we restrict this study to one promising parametrization each which we summarize in Table 1. There and in the following, we consider an original graph O = (V, E) with no = |V |, mo = |E| and maximum degree dmax . We denote as (ai )i∈M a sequence of elements a with indexes i from an (ordered) set M, ∪kj=0 (aij )i∈M denotes the ordered concatenation of k sequences, nd = |Vd | = |{v ∈ V : deg(v) = d}| denotes the number of nodes with degree d and cd = n1 ∑u∈Vd cu denotes the average clustering coefficient for nodes of d degree d. After a brief description of the considered models, we discuss fitting of power-law distributions, and continue with a discussion of the parametrization of each model. Model Erd˝os–Rényi Barabasi-Albert Chung-Lu Edge-Switching Markov Chain RMAT Hyperbolic Unit-Disk BTER LFR
Parameters ER(n0 , p) BA(n0 , k) CL(d) EMC(d)
Fitting 2m n0 = n p = n·(n−1) 0 n =n k = bm/nc d = (deg(u))u∈V d = (deg(u))u∈V
RM(s, e, s = dlog2 ne e = bm/nc (a, b, c, d)) (a, b, c, d) = kronfit(O) ¯ γ) n = n HUD(n, d, d¯ = 2 · (m/n) γ = max{2.1, plfit((deg(u))u∈V )} BT ER(d, c) d = (nd )d∈(0,...,dmax ) c = (cd )d∈(0,...,dmax ) LFR(n0 , n0 = n ¯ γ, d, dmax , γ, dmin , dmax = plfit((deg(u))u∈V ) β , cmin , cmax ) ζs = {|C| |C ∈ PLM(O)} β , cmin , cmax = plfit*(ζs )
Fitting & Scaling by x ∈ N 2m n0 = x · n p = x·n·(n−1) 0 n = x·n k = bm/nc d = ∪xi=1 (deg(u))u∈V d = ∪xi=1 (deg(u))u∈V s = dlog2 x · ne e = bm/nc (a, b, c, d) = kronfit(O) n = x·n d¯ = 2 · (m/n) γ = max{2.1, plfit((deg(u))u∈V )} d = (nd · x)d∈(0,...,dmax ) c = (cd )d∈(0,...,dmax ) n0 = x · n γ, dmin , dmax = plfit((deg(u))u∈V ) ζs = {|C| |C ∈ PLM(O)} β , cmin , cmax = plfit*(ζs )
Table 1. Parameters set to fit a model to a given graph, and to produce a scaled-up replica.
A.1
Considered Models
Apart from ReCoN, we include the following models in our experimental study: Erd˝os–Rényi random graphs (ER) [25] are fundamental and an important baseline. The Barabasi–Albert model (BA)[2] implements a preferential attachment process by which a power-law degree distribution emerges, which has been claimed to be a typical feature of real complex networks. The Chung-Lu (CL) model [1] recreates a given degree sequence in expectation. The Edge-Switching Markov Chain Generator (ESMC) generates a graph that is randomly drawn from all graphs with exactly the given degree 13
sequence (see e.g. [23], [27]). The Recursive Matrix (RMAT) model [8] was proposed to recreate various properties of complex networks, including an optional power-law degree distribution, the small-world property and self-similarity. The Hyperbolic UnitDisk Graph (HUDG) model embeds nodes into hyperbolic geometry and connects close nodes [18], replicating some properties observed in real networks, such as a power-law degree distribution. The LFR generator was designed as a benchmark graph generator for community detection algorithms [20]. It generates graphs with a power law degree distribution and a community structure with community sizes that follow a power law distribution. A.2
On Fitting Degree Power Laws
Both LFR and HUDG generators produce graphs with a power law degree distribution. Therefore, at least the power law exponent, and, in the case of the LFR generator, also the minimum and maximum degrees need to be determined such that the degree distribution fits the real network. In Table 1, plfit refers to our custom power law fitting scheme. There are many definitions of a fit, and in the case where the real distribution is not a power law distribution, they can also lead to very different parameters. For the replication of a graph the average degree should be kept as, otherwise, the graph will be much denser or sparser. At the same time, also the minimum and the maximum degrees should be kept as, otherwise, the structure of the graph will be different as the presence of degree-1 nodes or very large hubs is a fundamental property. In general, it is assumed that a power law distribution only holds starting with a minimum degree xmin and that for smaller degrees, the distribution might be different. As the LFR generator only generates a plain power law distribution we cannot apply this assumption. Therefore we fit the power law exponent such that with the given minimum and maximum degree the average degree of the real network is expected when a degree sequence is sampled from this power law distribution. Using binary search in the range of [−6, −1] we repeatedly calculate the expected average degree until the power law exponent is accurate up to an error of 10−3 . A.3
Erd˝os–Rényi, Barabasi-Albert, Chung-Lu and ESMC
The Erd˝os–Rényi model does not provide many options for parametrization. The edge probability p is set to produce the same edge-to-node ratio mn as the original. Likewise, we set the number of edges k coming with each new node in the Barabasi-Albert model to the edge-to-node ratio. The Chung-Lu and Edge-Switching Markov Chain generators simply receive the degree sequence of the original as input. In order to achieve scaling, x copies of this sequence are concatenated, multiplying the number of nodes by x while keeping the relative frequency of each degree. A.4
RMAT
The RMAT model can only generate graphs with 2s nodes, where s is an integer scaling parameter. In order to target a fixed number of nodes nr , we calculate s so that 2s > nr 14
and delete 2s − nr random nodes. The choice of the parameters a, b, c, d requires some discussion. Leskovec et al. [21] propose a method to “given a large, real graph [. . . ], generate a synthetic graph that matches its properties”, using stochastic Kronecker graphs: Starting 2-by-2 stochastic initiator matrix I, Kronecker products are calculated so that I s is a stochastic matrix of dimension 2s that yields edge probabilities of a graph. This is equivalent to the RMAT model as it yields the same edge probabilities. They attempt to fit model parameters so that the likelihood that a given original graph O was generated starting from an initiator matrix I is maximized, and propose the kronfit gradient descent algorithm that iteratively estimates I in O(m) time. They do not explicitly mention the case of creating a scaled replica, but it is clear that the method is capable of producing graphs for arbitrary exponents s. We use an implementation of kronfit which is distributed with the SNAP network analysis tool suite. The high running times of kronfit motivate a closer look at the claim of increased realism as opposed to random guessing of the initiator matrix. In a preliminary study we compared properties of original networks, RMAT replicas with either random initator matrices or matrices generated with 50 iterations of kronfit (a value proposed in [21]). The most obvious difference between original and replicas is in the distribution of the local clustering coefficient, which is consistently lower for RMAT. Applying kronfit slightly but not fundamentally diminishes the mismatch. This points to inherent restrictions of generating graphs by stochastic Kronecker multiplication/RMAT that an elaborate parameter fitting does not overcome. Since running kronfit on every network to be replicated is not practical, we estimate RMAT parameters as follows: We assume that the 100 Facebook networks constitute a class with essential structural commonalities, and run the recommended 50 iterations of kronfit on one typical network, fb-Caltech36. The resulting initiator is applied to replicate all Facebook networks. For other sets of networks, the assumption of structural similarity cannot be made, so we use a new random initiator for each replication. A.5
Hyperbolic Unit Disk
The Hyperbolic Unit-Disk Generator receives as parameters the desired number of nodes, the average degree of the original network and a power law exponent which is fitted as described above. As the given power law exponent must be larger than 2, we supply at least an exponent of 2.1. A.6
BTER
BTER receives a degree distribution and the desired clustering coefficient per degree, i.e. for each degree to be realized the number of occurrences and the average clustering coefficient per degree. For the replication we simply pass these distributions of the original network. For scaled replicas we scale the occurrences of all degrees by the scaling factor. This leads to the target number of nodes while also preserving the general shape of the degree distribution. In order to retain the distribution of the clustering coefficients we leave them unchanged while scaling the network. 15
30 25
speedup
20 15 10 5 0
104
105
m
106
Fig. 5. Speedup of NetworKit implementation of LFR compared to the reference implementation [11] when replicating a set of networks with m edges
A.7
LFR
Fitting LFR requires community detection. We use PLM [30]. For LFR we fit a power law distribution for the degrees as described above. For the community sizes, we also fit the power law distribution in the same way as for the degree distribution. As many networks in our set of real-world networks contain a few small connected components, the smallest communities usually only contain just 2 nodes while all other communities are much larger. Therefore, frequently our minimum power law exponent 1 is chosen as exponent and the expected average community size is still too low. In these cases we also fit the minimum community size using binary search until the expected average community size is the real average community size. In Table 1 this is denoted by plfit*. For the scaling, we simply append copies of the same values.
B
Implementation aspects
A reference implementation of the LFR generator by Fortunato et al. is available online [11]. We created a custom implementation of LFR in NetworKit, which is also the first parallelized implementation. Fig. 5 illustrates the speedup that we achieve with a new implementation of the LFR generator based on NetworKit. Speed measurements were obtained on a machine with 16 physical cores. It yields speedup factors of 5 to 25 for the test set of 100 Facebook social networks, and the factor grows superlinearly with the size of the network to be generated. The running time difference can be partially traced back to implementation differences: The LFR reference implementation relies on std::set to store and test for graph adjacencies, while our implementation uses a simple but apparently more efficient sequential scan on a simple array. Further, as mentioned already, the community graphs are generated in parallel which gives an additional speedup. 16
(a) original
(b) RMAT with kronfit
(c) BTER
(d) ReCoN
Fig. 6. A small social network and its scale-2 replicas produced by different models. ReCoN is the model that best reproduces a set of essential properties, including degree distributions, clustering and community structure.
For the tested generative models, NetworKit includes efficient implementations, such as an implementation of linear-time algorithms for the Erdös-Renyi and BarabasiAlbert models [4] and a subquadratic time algorithm for HUDG [22]. We have not implemented the BTER model; instead we use the FEASTPACK implementation by Kolda et al. [32]. NetworKit implements an adapter class that performs the model fitting and transparently calls the MATLAB-based FEASTPACK binary.
C
Example Replication
As part of the evaluation of realism we replicate a small example network with each of the models. The input graph is a social network of Bottlenose dolphins. We use graph drawing with the ForceAtlas2 layout algorithm implemented in Gephi to inspect the network structure. Node sizes are proportional to degree within one drawing. Fig. 6(a) shows a layout of the original network. Consider its basic structure: The graph is connected, with two distinct communities separated by an edge bottleneck. We also layouted replicas with scaling factors of 1 and 2 for each model, finding that the ReCoN replicas (e.g. Fig. 6(d)) are the only ones commonly recognized as resembling the original. BTER (Fig. 6(c)) is able to generate a similar community structure, though not matching the original as closely. All other replicas (e.g. those created by RMAT after applying kronfit, Fig. 6(b)) lose the distinctive community structure of the original.
17