With the growing importance of enterprise architecture (EA) management currently expe- ... Figure 1: Exemplary software map of an insurance company. In order ...
Generating Visualizations of Enterprise Architectures using Model Transformations Sabine Buckl, Alexander M. Ernst, Josef Lankes, Christian M. Schweda, Andr´e Wittenburg {buckls, ernst, lankes, schweda, wittenbu}@in.tum.de Abstract: Giving account to the importance of enterprise architecture (EA) modeling, this article sketches common issues in visualization handling that we came across during an extensive survey of the existing tool support for EA management in 2005. We introduce the research project software cartography, in which we develop an approach for EA modeling including a method for the automatic creation of EA models and visualizations. This approach is based on model transformations, which we use to link the data to be visualized and their graphical representation, thereby circumventing the error prone and time consuming task of manual creation of the visual models. A brief overview of a prototypic implementation of this approach complements the theoretic findings and illustrates applicability for visual modeling and documenting the EA.
1
Motivation
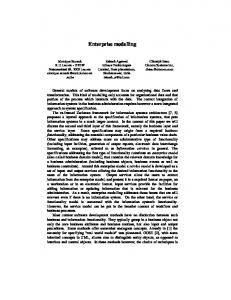
With the growing importance of enterprise architecture (EA) management currently experienced in research [LW04] and in practice [Jam05], methods for documenting, evaluating, and planning the application landscape as part of the EA gain increasing attention. This is reflected by various approaches, which try to establish and standardize languages for modeling the EA, furthermore complemented by a number of vendors claiming the emerging market of EA management tools. Nevertheless, many of these tools show common weaknesses, especially regarding the approach used for creating visualizations of the EA or the application landscape, as we found out during an extensive survey [seb05] conducted by sebis. Such visualizations, used for documenting, evaluating, and planning the application landscape make up the focus of the research project Software Cartography, which this paper originates from. In this project, we discovered a large number of different visualizations for application landscapes, which we refer to as software maps. An exemplary software map used at one of our project partners is given in Figure 1. The figure is made illegible due to the fact that it contains confidential information. Nevertheless, the figure shows the inherent complexity an approach for generating visualizations of enterprise architectures has to cope with. The software map originates from an insurance company and visualizes about 160 application systems hosted at the headquarter, which are used worldwide. The original map is commonly used as printout in DIN A0, within presentations, and is available at the corporate intranet.
Figure 1: Exemplary software map of an insurance company
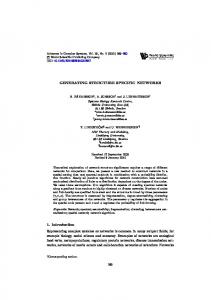
In order to discuss the requirements an approach for the generation of visualizations of EAs must satisfy, an anonymized software map similar to the one of the insurance company is shown in Figure 2. This visualization shows organizational units of a fictitious department store as rectangles, nesting the business applications hosted at the specific organizational unit represented by smaller rectangles. No established method for the creation and maintenance of such visualizations yet exists. Furthermore, most of the EA management tools show only basic capabilities in the context of automated positioning [seb05]. Within the development of such a method the following issues have to be considered: • The manual creation of the visualizations of the EA is an error prone and time consuming task, that leads to software maps containing aged data. Caused by the missing link between the present data and the visualization, no automated creation process for the visualization is available to ensure the timeliness of the visualized data. • The EA management tools commonly provide the user with the possibility to introduce visual elements without defined semantics in the context of the visualization, thereby effectively disconnecting the visualization from the respective data. We subsequently detail on the topic of EA modeling, presenting an approach, complemented by a prototypic tool implementation, which we regard to be suitable for addressing these issues. Thereby, the apporach is based on a technology originating from the field of model driven development (MDD): model transformation. This article especially focuses on the method for creating visualizations of the EA by model transformation and provides information, how a tool could actually implement this method. Thereby, the error prone and labor intensive task of manual creation of these visualizations is eliminated. The remainder of the article is structured as follows. As a starting point, software cartography as an way to support EA modeling with visual models is presented in Section 2 as well as an approach using model transformation to create the necessary visual models. The following Section 3 shows the application of our approach by providing information on a prototypic tool implementation. Section 4 emphasizes on different approaches taken in the context of EA modeling as well as on aspects of visualization consistency. Finally, sec-
Munich
Hamburg
Garching
London
Online Shop (100)
Human Resources System (700)
POS System (Germany/Munich) (1600)
Product Shipment System (Germany) (400)
POS System (Germany/ Hamburg) (1620)
Inventory Control System (200)
Monetary Transactions System (Great Britain) (350)
Customer Complaint System (1900)
Monetary Transactions System (Germany) (300)
Business Traveling System (1000)
Worktime Management (Germany/Munich) (1800)
Fleet Management System (900)
Price Tag Printing System (Germany/ Hamburg) (1720)
Data Warehouse (800)
POS System (Great Britain) (1650)
Customer Satisfaction Analysis System (2000)
Accounting System (500)
MIS (1300)
Price Tag Printing System (Germany/ Munich) (1700)
Document Management System (1100)
Worktime Management (Germany/ Hamburg) (1820)
Supplier Relationship Management System (1200)
Price Tag Printing System (Great Britain) (1750)
Costing System (600)
Financial Planning System (1400)
Campaign Management System (1500)
Customer Relationship Management System (2100)
Worktime Management (Great Britain) (1850)
Legend Map Symbols A
Visualization Rules
Location A
A
„A“ hosts „B (1)“ and „C (2)“ B (1)
B (1)
Business Application B with Id 1 C (2)
nesting
Figure 2: Exemplary software map
tion 5 provides some conclusions resulting from the taken approach and sketches aspects of further research in this field.
2
A model transformation approach
Our approach to EA modeling uses concepts and notions originating from the field of cartography. Maps in the context of cartography can be categorized into two different map types: topographic maps and thematic maps [KO96]. Topographic maps mainly deal with geographic information, whereas thematic maps show spatial information on a topographic map, as e.g. the results of a political election. In the context of EA modeling, visualizations resembling the buildup of thematic maps can be considered to be important, as they can be used to visualize different aspects of the enterprise. These visualizations, called software maps, are subject of research in our project software cartography. Aspects in the context of EA modeling that can be used to support the documentation, planning, and evaluating of the application landscape can be found in [MW04]. Thereby, metrics that point out aspects can be visualized on software maps to address specific concerns. In our research project, we gathered different visualizations of the EA and categorized them into three different types [Wit07]: • A cluster map is a type of software map that uses positioning to show how objects (e.g. applications) are grouped into larger logical units (e.g. organizational units). Thereby, the graphical representation of the object is clustered into the the representation of the logical unit. An example for a software map of type cluster map is shown in Figure 2. • A cartesian map is characterized by elements that are aligned along an x- and an y-axis. Two prominent examples of a cartesian map exist. Firstly, the process support map, which utilizes positioning to show which business processes (y-axis) are
supported by which application and used at which location (x-axis). Secondly, the time interval map, which is closely related to Gantt-like diagrams, as it uses bars for representing the life cycle on the x-axis (representing periods of time) of objects (e.g. applications) on the y-axis. • A graph layout map is a map using a typical nodes-and-edges buildup, not exerting additional restrictions on positioning to convey information. Therefore, the positioning is for example used for minimizing the numbers of lines crossing. To support the visualization of different aspects, as e.g. technical aspects or economical aspects on a software map [LMW05], the layering principle as shown in Figure 3 can be utilized.
Figure 3: Layered architecture of a software map
The exemplary software map consists of a base map including organizational units, and multiple layers, which are used to visualize relationships between different objects. In Figure 3, the layers contain applications on the first layer, interconnections representing a technical aspect on the second layer as well as measures on the third layer, visualizing operational or economical aspects. Thereby, each layer has a reference layer to which the elements correspond. As described above, we pursue an approach for EA modeling based on model transformation in order to ensure the consistency between models (e.g. data in an EA management repository) and visualizations of the EA. Therefore, a strict separation of the content to be visualized - the semantic model - and its representation - the symbolic model - is required. Additionally, a well-defined link between these models - the transformation - is needed. Figure 4 shows the basic idea of the model transformation approach. Subsequently, the individual concepts are explained in detail.
2.1
Semantic model and information model - the left side
The semantic model and the information model deal with the information describing the EA and its structure, thereby, the different models represent different levels of abstraction, similar to the notion of MOF (e.g. class and instance). The focal point of the semantic model lies on the actual information objects, which describe the application landscape
Models and Transformations
T Transformation f ti Semantic Model
Symbolic Model
is instance of based on Information Model Busine ssApplication hosted at 11
0..* 0..*
id : Integer nameEnglish : String nameGerman : String status : Enumeration
1
h version has i
0..*
0..*
0..*
supports
1..*
Visualization Model
BusinessApplicationVersion id : Integer v ersionId : Integer status : String plannedFrom : Date p plannedTo : Date inDev elopmentFrom : Date inDev elopmentTo : Date inProductionFrom : Date inProductionTo : Date inRetirementFrom : Date inRetirementTo : Date
OrganizationalUnit id : Integer nameEnglish : String nameGerman : String plzPoBoX : String city : String country : String address : String
is instance of based on
modifies
ABC
0..*
used at
BusinessPro cess 0..*
SupportRelationship child
id : Integer nameEnglisch : String nameGerman : String description : String isPrimary : Boolean lev el : Integer
0..*
superprocess
0..1
pa ren t
0..1
next
0..*
Project id : Integer nameEnglish : String nameGerman : String startDate : Date endDate : Date selected : Boolean
previous 0..1
based on
predecessor
is instance of
is instance of
based on
based on
Metamodel e.g. Meta Object Facility (MOF) 2.0
Figure 4: Basic principle of the software cartography method ##
© sebis 1
irrespective of its representation. These information objects are instances - in terms of object orientation - of the classes of the information model, thus the information model is the metamodel on which the semantic model is based. To exemplify the two tiered structure of the left side, we refer to the cluster map introduced in Section 1, i.e. the respective information about the EA contained therein. This information can be summarized as ”which location hosts which business application”. ”Munich”, for example, which is an instance of Location, hosts among others ”Online Shop (100)”, an instance of BusinessApplication. Figure 5 shows some of the information objects, which are instances of the classes from the information model in Figure 6. : hostedAt OnlineShop : BusinessApplication
Munich : Location
: hostedAt Monetary Transaction System (Germany) : BusinessApplication : hostedAt Accounting System : BusinessApplication : hostedAt Costing System : BusinessApplication
: hostedAt Product Shipment System (Germany) : BusinessApplication
Hamburg : Location : hostedAt
Fleet Management System : BusinessApplication
Figure 5: The semantic model containing some information objects presented in the cluster map
Location
BusinessApplication
hosted at
name : String 1
name : String *
id : Integer
Figure 6: The corresponding information model
The respective information model thus contains the classes BusinessApplication and Location, related by the association hostedAt. The attributes of the classes in the information model are not described in detail here, as only three of them are shown exemplarily. A more detailed description of information models and their related visualizations for EA management can be found in [BEL+ 07].
2.2
Symbolic model and visualization model - the right side
In order to provide means for describing visualizations, as the cluster map shown in Figure 2, we introduce a visualization model containing elements representing graphical concepts. These graphical concepts may on the one hand be map symbols, as e.g. the rectangle and on the other hand be visualization rules. These rules exert certain demands on the positioning, size, or overall appearance of the map symbol instances, as e.g. the Nesting rule, used in the exemplary visualization, demands that a symbol representing a business application is fully contained in the outer symbol. Utilizing these concepts, the visualization can be described by a symbolic model (see Figure 7), that consists of instances from the exemplary visualization model (see Figure 8). Nevertheless, it must be noted, that there exist more visualization rules, even in this simple example. An example is the rule demanding the different symbols representing business applications not to intersect each other. A complete model, able to describe visualizations as introduced above, is contained in [ELSW06]. : intersecting Online Shop : Rectangle
: Nesting : intersecting
Monetary Transaction System (Germany) : Rectangle
: Nesting
: intersected : intersected
Munich : Rectangle
: intersecting Accounting System : Rectangle
: Nesting
: intersected
: intersecting Costing System : Rectangle
: Nesting
: intersecting Fleet Management System : Rectangle
: intersected
: intersected : Nesting
Hamburg : Rectangle
: intersecting Product Shipment System (Germany) : Rectangle
: Nesting
: intersected
Figure 7: The symbolic model containing some visualization objects of cluster map
inner
Rectangle x : Real y : Real
1
* Nesting
width : Real height : Real backgorundColor : Color borderColor : Color
1
*
text : String outer
Figure 8: The corresponding visualization model
The object-oriented visualization model, alluded to above, greatly leverages the model transformation approach, but nevertheless is not capable of giving a strict definition for the visualization specific semantics of the map symbols and visualization rules. Therefore, we complement each class of the model with an expression in predicate calculus, describing the graphical implications in an unambiguous way. These definitions, further detailed in [ELSW06], can be used for computing the actual visualization from a symbolic model. Such a system might pursue different approaches for the computation. An exemplary one is outlined in section 3.
2.3
Model transformation and metamodel - the middle
To allow an automated creation of visual models of the application landscape and to ensure the consistency between these models and the underlying data, a link between the left side, representing the information and the right side, the representation, is required. This link is created by a transformation, which translates the information objects of the semantic model into visualization objects of the symbolic model. Selecting a transformation language specification, the concepts used in information models for EA management and the bidirectionality of the transformation, to allow changes in the semantic model by interacting with the visualization, should be considered. Figure 9 gives a short example of a transformation, resembling a notation as proposed by MOF Query, View, Transformation (QVT) [OMG05a]. rule OrgUnit2Rectangle { from i n f o O b j e c t : Semantic . O r g a n i z a t i o n a l U n i t to symbol : S y m b o l i c . R e c t a n g l e ( t e x t = i n f o O b j e c t . name , b a c k g r o u n d C o l o r = #CCCCCC ) ) r u l e BusinessApp2Rectangle { from i n f o O b j e c t : Semantic . B u s i n e s s A p p l i c a t i o n to symbol : S y m b o l i c . R e c t a n g l e ( t e x t = i n f o O b j e c t . name + ” ( ” + i n f o O b j e c t . i d + ” ) ” ), r u l e : Symbolic . Nesting ( i n n e r = symbol , outer = transforming ( infoObject . hostedAt ) ) )
Figure 9: Exemplary transformation rule set
Due to the fact that a common metamodel for the information model and the visualization model greatly simplifies the transformation specification, such a model is subsequently introduced. We extensively analyzed different EA management information models developed by industry partners in [Buc05], which pointed to the OMG’s Meta Object Facility
(MOF) [OMG06] as a suitable metamodel. The MOF model contains two core packages, Essential MOF (EMOF) and Complete MOF (CMOF), the former providing the core capabilities usually associated with object orientation, the latter extending them with advanced constructs, as e.g. constraints. However, EA management information models at our industry partners did not turn out to heavily rely on CMOF concepts, but more showed that these advanced concepts where used inconsistently. A common sense of usage only exists concerning the core concepts as contained in EMOF. Based on the results of the analysis alluded to above, we regard EMOF to be sufficient for information modeling in the field of EA, as well as a good choice in terms of an easy mapping of models to implementation. Verifying this choice, the following section details aspects of our prototypic tool realizing the approach outlined above.
3
SoCaTool: a tool for enterprise architecture modeling
Subsequently, we show the applicability of the model transformation approach for generating visual models of the enterprise architecture. Therefore, we provide information on a prototypic tool, which has been developed by sebis - giving an implementation of the approach. Prior to describing the core components of the tool and their interaction in generating visualizations, we provide a summary of our basic assumptions, which greatly influenced the software architecture of the tool. With an approach strongly centered around the usage of object-oriented models and representations thereof, a main factor is the metamodel, all these models are based on. Considerations as in Section 2.2 advocate the usage of EMOF as a common metamodel for the information model and the visualization model. An implementation of the metamodel has therefore to be incorporated in the tool. With different implementations at hand, we decided to rely on the implementation provided in the Eclipse Modeling Framework (EMF) [MDG+ 04]. This framework was chosen, as its metamodel, the ECore-metamodel, can be considered to be very similar to the EMOF-metamodel1 . Additionally, the EMF provides serialization and editing related functionalities at ”no cost”, as well as an active user and developer community. From this community various extensions to the core EMF have arisen, as e.g. a support for OCL queries. With this initial choice made, the Eclipse Rich Client Platform further deemed to be suitable for implementing our approach, especially with the Graphical Editor Framework (GEF) [MDG+ 04] providing an easy to use system for managing and interacting with visualizations. Based on the eclipse rich client platform, a component architecture containing four core components has been realized - complementing the approach outlined in section 2 with an implementation. Subsequently, these components are detailed. Repository The repository component is used for storing and managing object-oriented models, as e.g. the semantic model. This component also maintains the relation between a model 1 Only
minor differences concerning naming and the usage of references exist.
and its corresponding metamodel, as e.g. the information model. Concerning the set of functionalities offered by a repository, different types of repositories can be considered. Whereas the simplest type only enables reading access to the models as well as creating a completely new model from a set of objects, a more sophisticated repository would e.g. support editing operations on the objects contained. The support for multiple users acting on object-oriented models raises additional demands on a repository, especially concerning transaction related issues as well as issues concerning notification about model changes. More detailed considerations on the functionalities supported by a repository can be found in [OMG04]. As the prototypic implementation neither needs transaction support nor notifaction capabilities, a simple file-based repository has been chosen, thereby, every object-oriented model is serialized as a single xml-file. Nevertheless, this repository is used via the eclipse emf Resource-interface, which is also supported by repository projects providing more functionalities, as e.g. the elver persistency project [Gro07]. Transformer The transformer component is capable of interpreting visualization definitions as rules describing the transformation from an object-oriented model to another. When analyzing the transformation rules between the semantic and the symbolic model, as outlined in section 2.3, we identified basic functional requirements, as e.g. a support for queries on the semantic model data as well as a support for parametrizing rules. Additionally, a framework for bidirectional transformations would greatly leverage the approach from section 2, as it would provide means for editing semantic model data via changes to the symbolic model. These requirements mainly focus on the expressiveness of the transformation language. Nevertheless, further requirements regarding the usage context have to be considered. This is especially important, as the transformation rules should be easily definable for users without ”full-scale” programming knowledge, allowing users, as far as possible, to define auto generated custom visualizations. We deem it best, to have a graphical notation for defining these rules. Taking into consideration languages for defining model-to-model (M2M) transformations, especially prominent in the field of MDA, the Atlas Transformation Language (ATL), as described in [gaLI06], is at first sight an interesting candidate. Pursuing a strongly declarative approach in notating the rules, and not providing a graphical notation for defining the transformation, some of the functional requirements stated above are met by ATL. Nevertheless, ATL has only a limited support for querying concepts and, as with version 0.7, did not provide support for parametrized rules2 . The Bidirectional Object Transformation Language (BOTL) [BM03], pursuing a strongly declarative approach, provides an UML-based graphical notation for defining transformation rules. Furthermore, it leverages bidirectionality regarding the rules, as far as the operations performed during transformation do support this. Nevertheless, BOTL uses an independent metamodel, faintly ”inspired” by the EMOF metamodel, leaving out concepts that are of importance in information modeling, as e.g. inheritance. Furthermore, querying and external parametrization are not directly supported. 2 The
current version of ATL does support external parametrization.
Having thus ruled out two promising transformation languages from the field of MDA, we decided to use ECore reflection and java code to realize a first prototypic implementation of the transformer based on ”hard coded” transformation implementations. While this approach comprises obvious drawbacks concerning the simplicity of visualization definition by the user, it greatly leverages the definition of closely related visualization variants by inheritance and the utilization of object-oriented design patterns. Additionally, the maximum expressiveness of java helped us to gain further insights, which language concepts are necessary in constructing model transformation rules for defining EA management visualizations. Layouter The layouter component, providing the capability to actually layout visualizations described as symbolic models, can be considered the core component of the prototypic tool. This component leverages the utilization of object-oriented visualization specifications and thus enables the realization of visual modeling facilities without burdening the model creator with the implementation of layouting algorithms. When relying on the concepts provided by the visualization model as outlined in section 2, the layouter is capable of calculating the positions, dimensions, and other visual parameters of symbol instances in accordance to the visualization rule instances in the symbolic model. In performing this calculation many different approaches can be pursued. Two of them have been explored in-depth in the prototypic tool implementation, which are subsequently detailed. The first approach relies on the fact, that for every symbolic model a representation as an optimization problem can be found. This optimization problem uses the positions, dimensions, and other visual parameters of the symbol instances as variables, while constraints and target functions are derived from the visualization rule instances [ELSW06]. Solving the corresponding optimization problem is therefore equivalent to finding a valid layout for the visualization. Nevertheless, as these optimization problems are often high-dimensional as well as non-convex, specialized algorithms for solving do not commonly exist. For this reason, the first approach employed a genetic algorithm for searching an optimal solution. Due to the high genericity of such an algorithm, this approach is of limited performance. The second approach takes advantage of the fact, that there exist recurring elements in the object-oriented symbolic models, called patterns. One of these patterns could e.g. be a clustering pattern, in which a variable number of symbol instances is demanded to be nested into a surrounding symbol instance, with the nested instances demanded to be separated from each other. This pattern is prominently used in the visualization in Figure 2. For such patterns specialized layouting algorithms can be found, which incorporate the specifics of the pattern to provide superior layouting performance. A layouter pursuing this approach has been implemented as component in the tool (see [Lau07]), performing significantly better as the genetic algorithm. Nevertheless, the layouter is limited concerning the variety of symbolic models, which can be addressed, although the most prominent types of visualizations as outlined in section 2 can be layouted. Renderer The renderer component is used to present a layouted symbolic model in a specific output format. Concerning the format especially the PDF and the scalable vector graphics (SVG) format are of interest due to the inherent or potential support for layering and their vector
graphic nature. Supplementary, a renderer for direct screen output in the tool can be implemented, with additional functionalities of interest, as the option to support interactions with the rendered visualizations, e.g. via moving symbols. In the prototypic implementation a renderer for static visualizations on screen has been implemented using the eclipse Graphical Editor Framework (GEF). The output of this renderer in the graphical user interfaces of the tool is shown in Figure 10, displaying an exemplary software map of type cartesian map as outlined in section 2.
Figure 10: The GUI of the prototypic tool implementation
4
Related Work
With an approach for visual modeling presented above, the following section links to related work from the area of software engineering and EA modeling as well as issues regarding consistency of visual models. In the field of software engineering, the unified modeling language (UML) [OMG05c, OMG05b] provides the common sense for modeling single software systems, which is lacking in the field of enterprise architecture modeling. Therefore, the attempt of transferring the concepts and notations of UML to EA modeling could be undertaken. Nevertheless, the specific concerns of this area of modeling are not well supported by UML, as e.g. concepts like business applications or business processes are not known. While these concepts could be introduced via UML profiles, specific diagramming semantics are not easily realizable using the concepts of UML, effectively ruling out the unified modeling language as a language for EA modeling. This fact is also reflected by the variety of different approaches for enterprise architecture modeling regarding languages, methods, and tools, which can be found in the academic community. One approach is outlined in [vdTLtD+ 04] and specially focuses on a formal way of defin-
ing visualizations of the application landscape. This approach relies on the concept of signatures to establish a well-defined relation between the visualization and the underlying model of the enterprise architecture. While this approach also considers aspects of interest in the context of visualizations, e.g. relative positioning, no simple to use notation for a model describing the visualizations is provided. Further the approach does not provide an executable way for creating visualizations from the information. Regarding the absence of a state of the art, [Fra02] suggests another approach to enterprise architecture modeling, emphasizing the necessity to support different views on the enterprise. These views use different special purpose modeling languages to meet the concerns of the different stakeholders. These languages are defined in metamodels, which correspond to a common meta-metamodel to support integration. Nevertheless, as the approach is more focused on the provision of an integrated meta-metamodel for the different languages, it does not provide a method for generating the required views of the EA. The approach presented in section 2 can been seen as supportive in this context, for realizing tool support for the special purpose modeling languages and their visual models, as outlined above. An approach centered around an EA metamodel (information model in our terms) can be found in [BW05]. The models contains over 50 classes and thus spanns various aspects of interest in EA modeling. Additionally, this information model is complemented by means for structuring, which can be considered very helpful in reducing the inherent complexity of the modeling subject. Nevertheless, with the emphasis of the approach on the information model, aspects of visual models and their creation are not addressed in the article. Again, we see the approache presented in section 2 as a valuable contribution in the context, actually providing a way for supporting visual modeling based on the EA metamodel provided in [BW05]. Regarding the inconsistency issue between visualizations and the underlying data, an approach to ensure visualization consistency is pursued in [DV02] and especially focuses on aspects of executability. In order to provide an ”open visualization framework applicable to metamodel based modeling languages” the issue is approached from the direction of visual languages (visualization models). Pointing out, that many domain specific visualization environments exist, the approach quickly calls to XML as a lingua franca for representing the concepts of these languages. Furthermore, information to be visualized is also serialized as XML, such that concepts of transforming between XML document, as e.g. XSLT can be used for visualizing the information. Nevertheless, the article does not encompass a visual language suitable for expressing the aspects of relative positioning, as the application presented in therein concerns petri-nets and their representation as nodes-and-edges. Targeting EA modeling, an approach using object-oriented models for describing the EA and the visualizations is given in [SAtDL04]. These models are, similar to the approach presented in section 2 connected via transformations. Nevertheless, these transformations are limited to object-to-object transformations, while the links (instances of associations) are not taken into consideration - again leaving out an aspect crucial for modeling the EA. Furthermore, a language for describing the visualizations as outlined in section 2.2, especially concerning relative positioning, is not provided.
5
Outlook
In this article, we emphasized on the importance of models of the enterprise architecture. As we outlined, various approaches and information models for this modeling task exist, with no model or approach being prominent and all-embracing. Complementarily, we outlined the importance of visual models of the enterprise architecture to make the information about the EA perceivable. With the absence of the one information model for the EA and the need for visual models obviously existing, the approach presented in Section 2 targets to bridge this gap. Utilizing model transformation concepts and providing a flexible model for describing visualizations, our approach can be seen as an extension to the information modeling approaches as presented in Section 4. The applicability of the model transformation approach is shown in Section 3 by providing details of a prototypic tool implementation, which is able to ensure consistency between the data modeled according to an arbitrary information model and the visualization representing this data. Nevertheless, the prototypic implementation can be seen as a first step towards a visual modeling tool supporting a variety of information models. Concerning the modeling capabilities further extension for the e.g. for semantic-preserving editing of the visualizations as well as for propagating semantic changes in the visualization to the underlying semantic model have to be explored and currently subjected to research at sebis.
References [BEL+ 07]
S. Buckl, A.M. Ernst, J. Lankes, K. Schneider, and C.M. Schweda. A Pattern based Approach for constructing Enterprise Architecture Management Information Models. In A. Oberweis, C. Weinhardt, H. Gimpel, A. Koschmider, V. Pankratius, and Schnizler, editors, Wirtschaftsinformatik 2007, pages 145–162, Karlsruhe, Germany, 2007. universit¨atsverlag karlsruhe.
[BM03]
P. Braun and F. Marschall. BOTL - The Bidirectional Object Oriented Transformation Language. http://wwwbib.informatik.tu-muenchen.de/infberichte/2003/TUMI0307.pdf (cited 2007-01-26), 2003.
[Buc05]
S. Buckl. Modell-basierte Transformationen von Informationsmodellen zum Management von Anwendungslandschaften. Diploma thesis, Fakult¨at f¨ur Informatik, Technische Universit¨at M¨unchen, 2005.
[BW05]
C. Braun and R. Winter. MA Comprehensive Enterprise Architecture Metamodel and Its Implementation Using a Metamodeling Platform. In Enterprise Modelling and Information System Architectures (EMISA), pages 64–79, 2005.
[DV02]
P. Domokos and D. Varr´o. An Open Visualization Framework for Metamodel-Based Modeling Languages. Electronic Notes in Theoretical Computer Science, 72(2), 2002.
[ELSW06]
A. Ernst, J. Lankes, C.M. Schweda, and A. Wittenburg. Using Model Transformation for Generating Visualizations from Repository Contents - An Application to Software Cartography. Technical report, Technische Universit¨at M¨unchen, Chair for Informatics 19 (sebis), Munich, 2006.
[Fra02]
U. Frank. Multi-Perspective Enterprise Modeling (MEMO) - Conceptual Framework and Modeling Languages. In Proceedings of the 35th Annual Hawaii International Conference on System Sciences 35, pages 1258–1267, 2002.
[gaLI06]
ATLAS group at LINA & INRIA. ATL: Atlas Transformation Language, 2006.
[Gro07]
The Elver Group. Elver Pesistency, 2007.
[Jam05]
G. James. Magic Quadrant for Enterprise Architecture Tools, 4Q04, 2005.
[KO96]
M. J. Kraak and F. Ormeling. Cartography: Visualization of Spatial Data. Addison Wesley Longman, 1996.
[Lau07]
S. Lauschke. Automatische Generierung von Softwarekarten: Entwicklung eines Ansatzes zum Layout deklarativ beschriebener Visualisierungen. Master’s thesis, Fakult¨at f¨ur Informatik, Technische Universit¨at M¨unchen, 2007.
[LMW05]
J. Lankes, M. Matthes, and A. Wittenburg. Softwarekartographie: Systematische Darstellung von Anwendungslandschaften. In Wirtschaftsinformatik 2005, Bamberg, Germany, 2005.
[LW04]
K. Langenberg and A. Wegmann. Enterprise Architecture: What Aspects is Current Research Targeting? Technical report, Ecole Polytechnique F´ed´erale de Lausanne, Laboratory of Systemic Modeling, 2004.
[MDG+ 04]
B. Moore, D. Dean, A. Gerber, G. Wagenknecht, and P. Vanderheyden. Eclipse Development using the Graphical Editing Framework and the Eclipse Modeling Framework. http://www.redbooks.ibm.com/redbooks/pdfs/sg246302.pdf (cited 2007-0704), 2004.
[MW04]
F. Matthes and A. Wittenburg. Softwarekarten zur Visualisierung von Anwendungslandschaften und ihrer Aspekte. Technical report, Technische Universit¨at M¨unchen, Chair for Informatics 19 (sebis), Munich, 2004.
[OMG04]
OMG. MOF 2.0 Facility and Object Lifecycle Specification, ad/2004-04-02, 2004.
[OMG05a]
OMG. Revised Submission for MOF 2.0 Query/View/Transformation (ptc/05-1101), 2005.
[OMG05b]
OMG. UML 2.0 Infrastructure Specification (formal/05-07-05), 2005.
[OMG05c]
OMG. Unified Modeling Language: Superstructure, version 2.0 (formal/05-07-04), 2005.
[OMG06]
OMG. Meta Object Facility (MOF) Core Specification, version 2.0 (formal/06-0101), 2006.
[SAtDL04]
M.W.A. Steen, D.H. Akehurst, H. ter Doest, and M.M. Lankhorst. Supporting Viewpoint-Oriented Enterprise Architecture. Technical report, Information Centre of Telematica Instituut AND University of Kent, Enschede, Netherlands & Canterbury, United Kingdom, 2004.
[seb05]
sebis. Enterprise Architecture Management Tool Survey 2005, 2005. +
[vdTLtD 04] L. van der Torre, M.M. Lankhorst, H. ter Doest, J. Campschroer, and F. Arbab. Landscape Maps for Enterprise Architectures. Technical report, Information Centre of Telematica Instituut, Enschede, Netherlands, 2004. [Wit07]
A. Wittenburg. Softwarekartographie: Modelle und Methoden zur systematischen Visualisierung von Anwendungslandschaften. Phd thesis (in publication), Fakult¨at f¨ur Informatik, Technische Universit¨at M¨unchen, 2007.