Generative Model-driven Resource Efficient ECG Monitoring method. Our key observation is that ECG is a fairly periodic signal, with a known morphology and ...
Generative Model-driven Resource-efficient Monitoring of ECG Sidharth Nabar∗ , Ayan Banerjee† , Sandeep K.S. Gupta† and Radha Poovendran∗ ∗ Network
Security Lab (NSL), Electrical Engineering Department, University of Washington, Seattle † IMPACT Lab, Arizona State University, Tempe. Email: {snabar, rp3}@uw.edu, {abanerj3, Sandeep.Gupta}@asu.edu
Abstract—With recent advances in smartphones and wearable sensors, Body Sensor Networks (BSNs) have been proposed for use in continuous, remote electrocardiogram (ECG) monitoring. In such systems, sampling the ECG at clinically recommended rates (250 Hz) and wireless transmission of the collected data incurs high energy consumption at the energy-constrained body sensor. The large volume of collected data also makes data storage at the sensor infeasible. Thus, there is a need for developing a method to reduce the energy consumption and data size at the sensor, while maintaining the ECG quality required for diagnosis. In this report 1 , we propose GeM-REM, a resource-efficient ECG monitoring method for BSNs. GeM-REM uses a generative ECG model at the base station and its lightweight version at the sensor. The sensor transmits data only when the sensed ECG deviates from model-based values, thus saving transmission energy. Further, the model parameters are continually updated based on the sensed ECG. The proposed approach enables storage of ECG data in terms of model parameters rather than data samples, which reduces the required storage space. Implementation on a sensor platform and evaluation using MIT-BIH dataset shows transmission energy and data storage reduction ratios of 42.086:1 and 37.3:1 respectively, which are better than state of the art ECG data compression schemes.
I. I NTRODUCTION Electrocardiogram (ECG) is a time-varying signal representing the electrical activity of the heart, and is an effective, non-invasive diagnostic tool for cardiac monitoring. Recently, several systems have been developed for continuous, remote ECG monitoring using Body Sensor Networks (BSNs) [1]. Such systems typically consist of a wireless, battery-operated, body-worn sensor that collects ECG data and transmits it to a gateway device such as a smartphone. The gateway reports this data over the internet to a remote base station, which is typically a hospital server or caregiver’s computer. Such remote monitoring allows collection of data during a person’s daily routine and enables early detection of conditions such as tachycardia or angina. Further, the availability of continuous long-term data can help identify gradual, long-term trends in the cardiac health of at risk patients. A key challenge in BSN-based ECG monitoring is the large volume of data collected by the sensor in a short time interval. For example, with a sampling rate of 250 Hz and resolution of 12 bits/sample, more than 2 KB of data is collected within 6 seconds. Local storage of this data on the sensor or 1 This document is a technical report, and the associated conference paper is to appear in BSN 2011.
the gateway device is impractical due to storage limitations. Further, wireless transmission of this data consumes significant power at the energy-constrained sensor. At the same time, the quality and continuity of the reported ECG signal must be maintained at the base station to allow effective investigation and diagnosis by a physician. In this paper, we focus on this problem of resourceefficient ECG monitoring for BSNs, and develop GeM-REM: a Generative Model-driven Resource Efficient ECG Monitoring method. Our key observation is that ECG is a fairly periodic signal, with a known morphology and well-understood temporal variations. A set of key features are collected from a patient’s ECG and incorporated into a generative ECG model that is stored on the sensor as well as the base station. The sensor transmits data to the base station only when the sensed ECG deviates from the assumed model. When no data is received from the sensor, the base station uses the generative model to generate synthetic ECG data closely resembling the patient’s ECG. This data can be used as the patient’s ECG for clinical investigations. Through experiments on real-life ECG data, we show that this approach significantly reduces sensor energy consumption, while preserving the diagnostic quality of the reported ECG. We report the following contributions: •
•
•
We develop a novel generative model based scheme for continuous ECG monitoring. In this scheme, the sensor and the base station store a common ECG model, and the sensor transmits data only when the sensed ECG deviates from this model. We design a base station module that can learn a model based on training data and generate synthetic ECG signals using the trained model. We also develop a lightweight sensor module that performs comparison of the sensed ECG data to the model. We implement the proposed system on a sensor platform and show the resultant savings in energy consumption and data storage memory requirement.
The rest of the paper is organized as follows. Section II presents background and related work. Section III discusses the overall architecture and operation of GeM-REM. Sections IV and V present the design and implementation of the base station and sensor modules respectively. We present our results in Section VI, and discuss some extensions in Section VII. Section VIII concludes the paper.
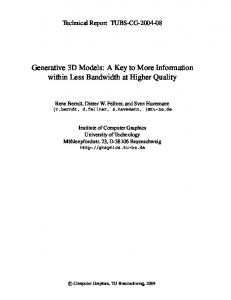
Fig. 1. Morphology features of an ECG beat. A beat is comprised of P, Q, R, S and T waves, with a U wave present in some cases.
II. BACKGROUND AND R ELATED W ORK In this section, we outline some key aspects of the ECG signal and the generative ECG model used in this paper, followed by a discussion of related work. A. Background The ECG signal has been extensively studied and used for cardiac diagnosis. The basic unit of an ECG is a beat, and its shape is referred to as the ECG morphology. As shown in Figure 1, a single beat consists of P, Q, R, S and T waves, with a U wave present in some cases. The R wave is typically the most prominent and easy to identify in a beat. The Q, R and S waves are often jointly considered as a single complex, called QRS complex. The shape, amplitude and relative locations of the constituent waves are key features of an ECG, and are referred to as morphology features in this paper. These features vary across individuals, but are expected to remain fairly stable for a given person, in the absence of pathological conditions. The distance between two consecutive R peaks is called the R-R interval, and its reciprocal gives the instantaneous heart rate. Even in a healthy person, the R-R interval varies across beats due to several physiological factors [2]. This variation is described using temporal features such as mean and standard deviation of heart rate, and spectral features such as Low Frequency/High Frequency (LF/HF) ratio [2]. In this paper, we refer to these features as inter-beat features. ECG is inherently a low amplitude electrical signal and is often corrupted by noise from various sources such as electrical mains, muscle noise and patient movement or respiration. As a result, the measured signal must be filtered to extract the underlying ECG waveform. Among the constituent waves, the QRS complex can be extracted using computationally lightweight algorithms such as [3]. The extraction of P and T waves, however, requires advanced filtering techniques that are computationally expensive to implement on sensors. Further, several conditions such as bradycardia, tachycardia, myocardial infarction and bundle branch block can be diagnosed from the QRS complex alone. As a result, in the current version of GeM-REM, we focus only on the QRS complex. Future extensions to GeM-REM will include improved filtering methods that can extract P and T waves. A key aspect of GeM-REM is the use of a generative ECG model. Such models can generate synthetic ECG signals, given
a set of input parameters. In this paper, we use the widely accepted dynamical generative model ECGSYN, proposed in [2]. ECGSYN models the ECG signal as a point moving around a unit circle, and uses differential equations to describe its motion. The individual waves are modeled as Gaussian attractors/repellers placed at specific points on the circle. The inter-beat features of ECG are modeled using 3 parameters: hrmean, hrstd and lfhfratio, corresponding to mean heart rate, standard deviation of heart rate and LF/HF ratio respectively. For the morphology features, each wave is represented by 3 parameters: (a, b, θ), which determine its height, width and distance to R peak, respectively2 . For example, the Q wave is represented by the 3-tuple (aQ , bQ and θQ ). The authors of ECGSYN provide a MATLAB implementation [4] to generate synthetic ECG, given a set of input parameters. To avoid duplication, we use this implementation in GeM-REM. B. Related Work Most current approaches to reduce energy consumption and data size in ECG monitoring are based on data compression, where the sensed ECG is compressed before transmission. Several techniques based on wavelets, Huffman coding and priority-based encoding have been proposed in literature [1]. These schemes, unlike GeM-REM, need to continuously transmit data, thus limiting their energy savings. In Section VII, we discuss how these schemes can be combined with GeM-REM to further improve energy savings. An alternative approach is proposed in [5], where a set of features is extracted from the sensed ECG and used for classification. The preprocessing and pattern recognition workload is transferred to local nodes close to the ECG leads to reduce transmission energy consumption. This scheme, however, is designed for ECG classification and does not provide the complete ECG signal at the base station. Recently, a compressive sensing approach has been proposed for ECG monitoring [6], which uses the sparsity of the ECG signal in specific wavelet transformations to reduce sampling rate. However, reconstruction of the received signal is complex and strongly depends on error-free transmission of all coefficients. III. M ODEL -BASED A RCHITECTURE OF G E M-REM In this section, we describe the overall architecture and operation of GeM-REM. The generative ECG model used at the sensor and base station is denoted as G, and the assumed BSN system model is shown in Figure 2a. Architecture: As shown in Figure 2b, GeM-REM consists of the following two modules: 1) Base Station Module (MBS ): This module uses G to generate synthetic ECG data given a set of input parameter values. Additionally, it includes a model learning function, which is used to train G based on a specific patient’s ECG. This function derives suitable input parameter values for G from the given ECG data. 2 Note that the height of a wave is not exactly equal to the value of a. Similarly, the width of the wave is not directly equal to value of b.
(a) System Architecture
(b) Data Reporting Scheme Sensor Module MLITE Sensed ECG
ECG Leads Sensor Platform
Preprocess
Compare inter-beat features
Base Station Module MBS If not within threshold Transmit value
Feature Updates
Generative Model (G)
Generated ECG
Compare beat morphology
If below threshold Transmit raw signal
Model Learning
Training Data
Temporal Alignment
Output ECG
Generative Model (G)
Base Station Mobile Phone Gateway
Parameter Update
Raw Signal Updates
Raw Data
Fig. 2. System architecture and data reporting scheme of GeM-REM. The computationally intensive model learning component is implemented in MBS , while MLIT E only has lightweight components. The model G in MLIT E is a simpler version of the one in MBS , and can only generate individual beats.
2) Sensor Module (MLIT E ): This module is intended for use in the ECG sensor and uses a lightweight implementation of the model G to generate an expected ECG signal. It also performs a comparison between this signal and the sensed ECG, to decide when to transmit data to base station. Initialization: Prior to deploying the system for a patient, the learning functionality of MBS is used to train the model G using the patient’s ECG data. This training process outputs a set of parameter values, which are then stored on the base station as well as the sensor. These values are intended to be used as inputs to G, for generating synthetic ECG data closely resembling the patient’s actual ECG. Basic Operation: During regular operation of the system, the sensor compares the sensed ECG signal to that generated by G, and if these signals match within a pre-defined threshold, the sensor does not report any data to the base station.3 Conversely, if the sensed data deviates from the model, the sensor transmits data updates to the base station. At the base station, if data is received from the sensor, it is directly recorded as the patient’s ECG. Otherwise, it assumes that the ECG of the patient is close to the model-based values. The model G is then used to generate a synthetic ECG signal, which is used to represent the patient’s ECG. Model Updates: Several features of ECG data, such as mean heart rate and the LF/HF ratio vary over time with activities such as sleeping, walking and exercise. As a result, a single, static model G cannot effectively represent a patient’s ECG over extended periods of time. For effective operation of GeM-REM, it is necessary to dynamically update G as the patient’s ECG changes. Since the deviation of sensed ECG from model-based values is first detected at the sensor, the modifications to G must be triggered by the sensor. This can be achieved by two possible approaches: • Feature Updates: Features of the sensed ECG signal (e.g. mean heart rate) are calculated from sensed data, and when these values change significantly, the sensor updates the corresponding parameters of the model G in MLIT E . Further, the sensor reports these calculated 3 To differentiate between absence of data reports and sensor or network failure, we use a periodic sensor heartbeat scheme, where the sensor periodically sends ‘HELLO’ messages to the base station.
feature values to the base station. Such reports are called feature updates, and are used by the base station to modify the model in MBS . • Raw Signal Updates: When the patient’s ECG deviates from the current model, the sensor sends raw sensed data to the base station. This transmission is referred to as a raw signal update. Based on this update, the base station derives new parameter values for G using its model learning functionality. These values are sent to the sensor, to update the model in MLIT E . We use a combination of the above two approaches in GeM-REM. For features that can be calculated on the computationally-limited sensor, we use the feature update approach. For the remaining features, raw data is reported to the base station. A. Advantages of Proposed Model-Based Architecture The model-based architecture of GeM-REM provides two main advantages: flexible energy consumption-data accuracy tradeoff, and reduced data size for ECG storage. By defining suitable thresholds for the comparison between the sensed and model-generated ECG, a large fraction of data transmission at the sensor can be suppressed, thus significantly reducing sensor energy consumption. These threshold values can be specified by the physician based on the application requirements as well as the patient’s age, lifestyle and health condition. Further, they can be adjusted over time to tradeoff data accuracy and communication energy. The proposed approach also provides reduced ECG data size for storage, by representing ECG using model parameters instead of data samples. For a time interval denoted [tA , tB ], if the patient’s ECG follows model G with parameter values [p1 ,p2 , · · · pN ], the data can be stored as: “[tA , tB ] : [p1 , p2 , · · · pN ]”. These values can be used at a later time as inputs to G to regenerate the corresponding ECG data. This representation significantly reduces data size, and can enable local storage of ECG data on the patient’s smartphone, which is not feasible with direct storage of sample values. We note that the approach outlined in this section does not depend on specific characteristics of the generative model G, and can be applied to any given ECG data model. In this paper, we use the ECGSYN [2] model as an example.
IV. BASE S TATION M ODULE MBS In this section, we describe the design and implementation of the base station module MBS . The ECGSYN model is used as the generative model G. The two main functions of the MBS module are learning the input parameter values for G from given training data and generating a synthetic ECG when no data is received from the sensor. Given a set of parameter values, the ECGSYN function can be used to generate a synthetic ECG, as noted in Section II. However, for this synthetic ECG to closely match the actual, sensed ECG, a set of suitable input parameter values needs to be obtained. This key functionality is provided by the model learning function. The model learning function takes a real ECG signal as input, and generates a set of suitable input parameters for ECGSYN. As discussed in Section II, the ECGSYN model uses two groups of parameters to characterize an ECG signal: inter-beat parameters and morphology parameters. The learning method for each of these groups is as follows: Inter-beat parameters: This group includes the parameters hrmean, hrstd and lfhfratio, corresponding to the mean heart rate, standard deviation of heart rate and LF/HF ratio features of ECG respectively. To calculate the LF/HF ratio, a set of 256 R-R interval values is obtained from the given ECG data and the Power Spectral Density (PSD) of this set is computed. The Low Frequency (LF) and High Frequency (HF) components are then obtained by integrating the PSD over the ranges (0.04Hz - 0.15Hz) and (0.15Hz - 0.4Hz) respectively. The ratio between these components gives the value of the lfhfratio parameter. The hrmean and hrstd values are obtained by performing averaging and standard deviation calculations on a set of 60 R-R interval values. Morphology parameters: This group includes the (a, b, θ) parameters for each of the P, Q, R, S and T waves, as described in Section II. Since we focus on the QRS complex in this paper, only 9 parameters (aQ , aR , aS , bQ , bR , bS , θQ , θR , θS ) are used to represent the beat morphology. Given an ECG signal, the first step is to detect QRS complex. The signal is then divided into windows each containing 10 QRS complexes. These QRS complexes are then averaged to form a mean QRS complex (MeanBeat). The ECGSYN model, expresses the Q, R, and S waves as Gaussian functions as: m(t) = am exp
−(θ−θm )2 bm 2
m ∈ {Q, R, S}
(1)
The learning function determines the values of the coefficients am , bm , and θm for each of the waves Q, R and S using the MeanBeat as the sample ECG wave. The θm values are obtained in radians as 2∗π times the ratio between the distance of the individual peaks from the R peak and the R-R interval (θR is zero, by definition). For learning the remaining parameters (aQ , aR , aS , bQ , bR , bS ), we use a curve fitting approach based on a least square minimization technique. This starts with an initialization step, where two different theta values are selected close to each of Q, R, and
S peaks, which directly correspond to positions on the time axis. Let the ECG signal value at the two theta positions be denoted by M1 and M2 . The two resultant instances of the equation 1 for each peak, are then solved simultaneously to obtain the initial values of the coefficients using the following equations: s 2π 2 (2) bm = M1 log M2 × RRM ean2 × fECG am =
M1 bm 2
(3)
where RRM ean is the mean R-R interval in the ECG signal and fECG is the sampling rate of the signal. The mean square error between the MeanBeat and the generated signal for a given coefficient estimation is then set as the objective function of the nonlinear optimization. The solution of these optimization problems results in coefficient values, which can accurately resemble the MeanBeat. Thus, a total of 12 input parameters (hrstd, hrmean, lfhfratio, aQ , aR , aS , bQ , bR , bS , θQ , θR , θS ) are learned from the patient’s true ECG and used to generate a matching synthetic ECG. We note that the morphology of ECG depends on the lead configuration and may vary across patients. Hence, the data used for learning the model should be obtained from the intended user of the system, and using the same lead configuration as the final system. V. S ENSOR M ODULE MLIT E In this section, we describe the operation of the sensor module MLIT E . The model G used in MLIT E is a lightweight TinyOS implementation of ECGSYN, developed by us as a part of GeM-REM. The energy savings provided by GeM-REM are mainly from suppressing data transmission from the sensor when the sensed ECG matches the assumed model. These savings can be maximized through efficient implementation of the set of components in MLIT E shown in Figure 2. In this paper, as a proof of concept, we implement these components in software, on a commercially available TelosB sensor board. In future versions, some of these components will be converted to hardware implementations for reduced energy consumption. The first task performed by MLIT E is preprocessing the sensed ECG to convert it into a format suitable for comparison with the stored model. This involves operations such as scaling, filtering and peak detection. The implementation details for each of these operations are as follows: 1) Scaling: The amplitude of the sensed ECG signal is highly dependent on the sensor hardware and the ECG lead configuration. To ensure an accurate comparison between the sensed data and the model data, they must both be converted to a common, device-independent scale. This is achieved by linearly scaling each signal to a maximum of 1.2 mV and minimum of -0.4 mV. 2) Filtering: As discussed in Section II, the sensed ECG is typically noisy, and must be filtered to extract the
underlying signal. For extracting the QRS complex, a passband of 5-12 Hz is required, which is achieved by cascading lowpass and highpass filters with cutoff frequencies 5 Hz and 12 Hz respectively. For low computational overhead, a Finite Impulse Response (FIR) filter design of 6 taps and order 32 is used. A similar filter design was used in [3] and was shown to achieve good performance. 3) Peak Detection: Measuring ECG features such as RR intervals or QRS complex width requires the identification of Q, R and S peaks. In order to perform this peak detection at low computational overhead, we developed a lightweight QRS peak detection algorithm shown in Table I. This algorithm detects all the positive and negative peaks in a signal, and then imposes a relative threshold on the amplitude to qualify peaks as Q, R and S. The threshold values thresholdQ, thresholdR and thresholdS were empirically derived by studying several ECG signals from the MIT-BIH database [4]. A baseline is derived by calculating the mean of the signal, and then the upward and downward dynamic ranges are calculated as dynamicRangeU p = max(signal) − baseline and dynamicRangeDown = baseline − min(signal) respectively. The thresholds are then initialized to specific fractions of the dynamic range. Such dynamic range-based thresholds allow adaptability to ECG signals with different morphologies. The threshold values used in this paper are: thresholdR = 0.3∗dynamicRangeU p, thresholdQ = thresholdS = 0.1 ∗ dynamicRangeDown. These values are low enough to minimize false negatives. False positives are reduced by imposing conditions based on the previous peak detected. For example, for a negative peak to be declared as ‘S’, the previous peak must be an R peak. Further, the relative amplitudes are compared and a threshold is imposed on this value. For example, for a peak to be declared as an ‘R’ peak, it eak) must satisfy: (peak−previousP > 1.5. This relative previousP eak amplitude comparison captures the expected generic shape of the ECG waveform. Once preprocessing is complete, the sensed ECG is compared to the signal generated by the model. Such a comparison can be performed in two ways: (i) the preprocessed ECG can be directly compared to the model-generated signal; or (ii) a set of representative features can be extracted from each signal and these feature values can be compared. The feature comparison approach is more robust to noisy measurements but incurs computational overhead for calculation of features from sensed data. It was observed that the interbeat features (mean and standard deviation of heart rate, and the LF/HF ratio) can be calculated from the sensed ECG at low computational cost. As a result, we use the feature comparison approach for these features. On the other hand, as discussed in Section IV, calculating the morphology features requires a curve fitting approach. Since this is not feasible
TABLE I QRS D ETECTION ALGORITHM USED IN THE SENSOR MODULE For each incoming data sample x[i] //-0.4 ≤ x[i] ≤ 1.2 if (x[i] > MAX) then Set MAX = x[i] //Initially, MAX = -100 if (x[i] < MIN) then Set MIN = x[i] //Initially, MIN = 100 if (Looking for upward peak) then if (x[i] < MAX) then Mark x[i-1] as PossiblePeak if (x[i] < (MAX - thresholdUp)) then Mark latest PossiblePeak as RealPeak if (magnitude(RealPeak) > thresholdR) then Mark peak as R peak Start Looking for downward peak else // looking for downward peak if (x[i] > MIN) then Mark x[i-1] as PossiblePeak if (x[i] > (MIN + thresholdDown)) then Mark latest PossiblePeak as RealPeak if ((magnitude(RealPeak) > thresholdQ) AND (PreviousPeak is S)) then Mark peak as Q peak if ((magnitude(RealPeak) > thresholdS) AND (PreviousPeak is R)) then Mark peak as S peak Start Looking for upward peak
for sensor class devices with limited computational capability, we use the direct signal comparison approach for the ECG morphology. The algorithms for performing these comparisons are as follows: Inter-beat features comparison: For the sensed data, the mean and standard deviation of the heart rate are obtained by calculating the mean and standard deviation of a set of 30 consecutive R-R intervals. The calculation of LF/HF ratio is similar to that described in Section IV for MBS . However, to optimize computation speed and power consumption, we developed an efficient TinyOS implementation for Fast Fourier Transform (FFT). Once these calculations are complete, the feature values are compared to model parameter values hrmean, hrstd and lfhfratio respectively. Morphology comparison: A sample, representative beat, referred to as MeanBeat, is obtained by averaging 10 consecutive beats of the sensed ECG. On the other hand, we use our lightweight ECGSYN implementation to generate a sample ECG beat, referred to as ModelBeat. The ModelBeat and MeanBeat are aligned by superimposing the respective R peaks, and the fit is compared using a mean square error approach. The mean square metric is chosen since it captures shape as well as amplitude of the Q, R and S waves. Since the generation of ModelBeat was found to be computationally expensive, it is performed only once, when new morphology parameter values are assigned. The generated ModelBeat is then stored in memory for future use. Based on these comparisons, if the sensed data is found to deviate from the model, the sensor triggers a model update, as discussed in Section III. For inter-beat features, if the mismatch between true feature values and corresponding model parameter values exceed a pre-defined threshold, the sensor updates the model parameters in MLIT E . It also reports this feature update to the base station. In the morphology comparison, if the error between MeanBeat and ModelBeat is above a specified threshold, the entire ECG data for the corresponding
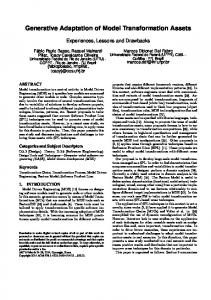
time interval (10 beats) is sent to the base station. If the base station receives multiple such raw signal updates, it retrains the morphology parameters of the ECGSYN model, and communicates the new values to the sensor. Although such raw signal updates incur significant data transmission at the sensor, its impact on overall energy consumption is minimal, since the ECG morphology of a person is not expected to vary much over time, as discussed in Section II. VI. E XPERIMENTAL R ESULTS In this section, we present experimental results for the evaluation of GeM-REM. Specifically, we evaluate the following aspects: (i) Accuracy of model learning functionality of MBS , (ii) Energy consumption of MLIT E , (iii) Reduction in energy consumption and data storage provided by GeM-REM, and (iv) Accuracy of GeM-REM. The data used for evaluation is a set of real life 3-lead ECG traces sampled at 250 Hz, obtained from the MITBIH database [4]. This ECG is further scaled and filtered, as described in Section V. This filtered version of ECG is referred to as ECGraw for the remainder of this section. Similarly, the ECG reported by GeM-REM at the base station is referred to as ECGGR . The MBS module is implemented in MATLAB, while the MLIT E module is implemented in TinyOS 2.x, and run on the TelosB platform. In MLIT E , all numerical values (ECG samples and feature values) are implemented as 16-bit integers to optimize performance. A. Learning Function in MBS The model learning function of MBS was tested over 20 ECG traces of two different types: (i) 10 Normal ECG, (ii) 10 Congestive Heart Failure (CHF) ECG. For each ECGraw , a sample beat was obtained by averaging 10 consecutive beats. An ECGSYN model was trained on this beat, and then used to generate a synthetic ECG, which was compared to ECGraw . As shown in Figure 3, the trained model achieves very good fit for different morphologies of ECGraw . An average mean square error of 2.13 % was observed over 20 ECG traces. B. Energy Consumption of MLIT E We evaluate the energy consumption of MLIT E since it can be an important factor in the battery life of the ECG sensor. Some tasks in MLIT E , such as filtering, are executed continuously, while others, such as hrmean calculation, occur
1.5
1.2
Original ECG Trained Model
1 ECG amplitude (mV)
ECG Amplitude (mV)
1 0.8 0.6 0.4 0.2 0
Original ECG Trained Model
100 Sample Number
150
(a) Normal ECG
200
Occurrence
Energy (mJ)
Energy/Beat (mJ/beat)
Scaling, Filtering and Peak detection Generate ModelBeat using ECGSYN * Cross-correlation between MeanBeat and ModelBeat Calculate heart rate mean, std. deviation Calculate LF/HF ratio
Every beat
0.63
0.62
-
22.176
-
10 beats
1.008
0.1
60 beats
3.434
0.056
256 beats
3.072
0.012
Total Computational energy/beat *
0.79
Since this is a one-time task, it is not considered in per beat energy.
once for a set of several beats. To jointly consider these tasks, a per beat energy consumption is calculated for each task, and their sum is considered as the total energy consumption per beat. Table II shows that the highest contribution is from simple tasks such as scaling and filtering, since they are executed continuously. Using hardware implementations of these tasks in future versions is expected to drive down the energy consumption of MLIT E . C. Transmission Energy and Storage Memory Savings of GeM-REM We now discuss the reduction in transmission energy consumption and data storage provided by GeM-REM, and compare our results to state of the art compression schemes proposed for ECG monitoring. Transmission Energy Reduction: Since data transmission is the main factor in energy consumption on energyconstrained ECG sensors [5], transmission energy is an important performance metric for ECG monitoring schemes. Since transmission energy consumption is directly proportional to the size of data being transmitted, compression-based methods use the compression ratio (CR) as an indication of transmission energy reduction [7]. To enable a comparison of GeM-REM to state of the art compression schemes, we define a similar ratio for GeM-REM as: CRGR =
Total ECG data Data transmitted by GeM-REM
TABLE III C OMPRESSION R ATIO OF G E M-REM COMPARED TO EXISTING COMPRESSION SCHEMES
Scheme/Algorithm
Compression Ratio
AZTEC [1] CORTES [1] Wavelet and Huffman [1] DCT & arithmetic [1] DCT & LZW [1] SPITH [7] DWLT & MSVQ [7] GeM-REM (ours)
10 : 1 4.3 : 1 9.4 : 1 14.73 : 1 9:1 21.4 : 1 29.3 : 1 42.08 : 1
0
−0.5
50
Task
0.5
−0.2 −0.4 0
TABLE II E NERGY CONSUMPTION ON T ELOS B MOTES FOR DIFFERENT COMPUTATIONAL TASKS IN MLIT E
−1
50
100 150 Sample Number
200
(b) ECG showing CHF
Fig. 3. Comparison of model generated ECG and filtered original ECG for different ECG morphologies. The model achieves > 97% fit.
TABLE IV P ERFORMANCE OF G E M-REM FOR DIFFERENT THRESHOLD VALUES Threshold Values CRGR Feature Error (%) (hrmean, hrstd, Morphology Max Mean MSE lfhfratio) (3,2,4) 0.07 42.08:1 6.92 4.03 0.07 40.19:1 6.32 3.24 (2,1,3) 0.2 7892:1* 14.3 8.64 (10,5,6) 0.01 1.16:1† 0.5 0.1 (10,5,6) * †
This case does not send any raw signal updates This case transmits almost entire ECGraw
To calculate CRGR , we ran GeM-REM for a set of ECGraw signals from 5 different subjects. Each ECG signal is 5.4×10⁶ samples long (approx. 6 hours). Since we use 16 bits/sample, the total data is 10.8 MB. The thresholds for hrmean, hrstd and lfhfratio parameter comparison were 3 beats per min (bpm), 2 bpm and 4, respectively. For morphology comparison, the threshold for mean squared error between ModelBeat and MeanBeat was set as 0.07. These values were obtained by consulting with clinical practitioners experienced in ECG analysis and diagnosis. As shown later, these values preserve the diagnostic content of ECG. With these threshold values, the average data transmission per ECGraw was found to be 4420 bytes in feature updates (2210 updates) and 252.2 KB in raw signal updates (65 updates). Thus, total data transmitted is 256.62 KB, giving: CRGR = 10.8 MB/256.62 KB = 42.086 : 1. Table III shows the comparison between GeM-REM and state of the art compression schemes [1], [7]. The variation in CRGR based on the chosen threshold values is shown in Table IV. We observe that a larger threshold for morphology mean square error (MSE) gives very high gain in CRGR since it almost eliminates data-intensive raw signal updates. Storage Space Reduction: To measure the effectiveness of the data representation described in Section III-A, we used it to store ECGGR in memory. For each feature value update, a new time interval is started, and the set of model parameters is appended to the file. The data samples received through raw signal updates are stored directly. On an average, for an ECGraw file size of 32.9 MB, we obtained a size of 903 KB for ECGGR (Compression Ratio of 37.3), which is significantly higher than existing compression schemes. We note that this ratio relates to the storage requirements and is different from CRGR which is related to data transmission. D. Accuracy of GeM-REM To evaluate the accuracy of GeM-REM, we consider the following two aspects: diagnostic quality of the ECGGR signal and the ability of GeM-REM to detect occurrence of unexpected events in the sensed ECG. Signal Quality: The Percent Root-mean-square Distortion (PRD) metric typically used by compression schemes to measure distortion is not applicable to GeM-REM since the output signal EGR is not intended to match the input Eraw sample-to-sample. Instead, the goal is to preserve the diagnostic information. As a result, we measure signal quality by evaluating a set of 6 diagnostically relevant features of
TABLE V P ERCENT ERROR BETWEEN ECGraw AND ECGGR FOR 6 DIAGNOSTICALLY RELEVANT FEATURES
Feature
Error(%)
R-R interval QRS complex width Polarity of QRS Number of peaks in QRS QRS: Max amplitude QRS: Min amplitude
6.47 6.92 0.6 1.1 4.8 4.13
ECG4 [8] for ECGraw and the corresponding ECGGR signal. A percent error is then obtained for each feature. As shown in Table V, the average error over 5 different ECG traces is below 7% for the same set of threshold values used for calculating CRGR . This indicates that the diagnostic quality of ECG is retained by GeM-REM. Like CRGR , the signal quality also varies with chosen threshold values, as shown in Table IV. It was observed that lower threshold values for inter-beat features improve accuracy, with minimal effect on CRGR . Detection of unexpected events: To evaluate the response of GeM-REM to occurrence of critical, unexpected events such as acute cardiac failure, we used a trace consisting of a CHF ECG appended to a normal ECG waveform. This was used as ECGraw , to simulate the occurrence of a heart failure. As expected, the change in ECG was detected in the morphology comparison, and was reported to the base station within 5 beats (approximately 5 s). VII. E XTENSIONS AND F UTURE W ORK In this section, we discuss possible extensions to GeMREM, and proposed future work. A. Extensions to GeM-REM Data Compression in MLIT E : As discussed in Section II, several data compression schemes have been proposed in literature for ECG. These schemes can be added on to GeMREM to further improve the energy and data size savings. Based on our experimental validation of GeM-REM, it was observed that a very high percentage (approximately 95%) of the sensor transmission in GeM-REM occurs in the form of raw signal samples when ECG morphology differs from the reference model. In these cases, existing compression schemes can be used to reduce the data to be transmitted. This will further reduce sensor energy consumption in GeM-REM. Hardware implementation of MLIT E : The scaling and filtering tasks of MLIT E can easily be implemented in hardware using existing techniques. This is expected to significantly reduce the computation energy consumption at the sensor, and will be included in the next version of GeM-REM. Incorporating P, T waves: Diagnosis of conditions such as atrial hypertrophy and cardiac ischemia require P and T waves to be reconstructed in the ECG at the base station. To enable this reconstruction, the filtering and peak detection algorithms 4 We only consider features related to the QRS complex and the R-R process.
at the sensor need to be modified and the set of morphology parameters must be extended to incorporate P and T waves. This extension will be presented in our future work. Other physiological parameters: Along with ECG, BSNs are used for measuring several other physiological parameters, such as SpO2, blood pressure and glucose. Like ECG, these parameters are also highly regular and have well understood variation patterns. Thus, the proposed generative model-based approach can be used for these parameters as well. B. Future Work Since GeM-REM is intended for use in long-term, remote ECG monitoring scenarios, it is important to evaluate its robustness to communication packet loss and measurement noise due to patient movement, that commonly occur in BSNbased ECG monitoring. In order to investigate these issues, we intend to build a complete system implementation of GeMREM and perform sample trials. VIII. C ONCLUSION In this paper, we proposed GeM-REM, a generative modelbased method for ECG monitoring using BSNs. Based on validation with real ECG data, GeM-REM is observed to significantly reduce sensor energy consumption and ECG data storage space, while maintaining the diagnostic quality of the reported ECG signal. R EFERENCES [1] B. Yu, L. Yang, and C.-C. Chong, “Ecg monitoring over bluetooth: Data compression and transmission,” in Wireless Communications and Networking Conference (WCNC), 2010 IEEE, 2010, pp. 1 –5. [2] P. McSharry, G. Clifford, L. Tarassenko, and L. Smith, “A dynamical model for generating synthetic electrocardiogram signals,” Biomedical Engineering, IEEE Transactions on, vol. 50, no. 3, pp. 289–294, 2003. [3] L. Ren-Guey, I. CHOU, L. CHIEN-CHIH, L. MING-HSIU, and M. CHIU, “A Novel QRS Detection algorithm applied to the analysis of heart rate variability of patients with sleep apnea,” Biomedical Eng. Application, Basis & communication, vol. 17, no. 5, 2005. [4] http://www.physionet.org/. [5] R. Jafari, H. Noshadi, S. Ghiasi, and M. Sarrafzadeh, “Adaptive electrocardiogram feature extraction on distributed embedded systems,” IEEE Transactions on Parallel and Distributed Systems, pp. 797–807, 2006. [6] C. Eduardo, P. Octavian Adrian, S. Pedro et al., “Implementation of Compressed Sensing in Telecardiology Sensor Networks,” International Journal of Telemedicine and Applications, vol. 2010, 2010. [7] B. Kim, I. Jung, I. Lee, and Y. Kim, “DWLT compression method based on MSVQ for a real-time ECG monitoring system in WSNs,” in Proceedings of the International Conference on Mobile Technology, Applications, and Systems. ACM, 2008, pp. 1–5. [8] Y. Zigel, A. Cohen, and A. Katz, “The weighted diagnostic distortion (WDD) measure for ECG signal compression,” Biomedical Engineering, IEEE Transactions on, vol. 47, no. 11, pp. 1422–1430, 2002.