Technical Guidelines - Generator Efficiency Standards December 2006 ...... For a
typical coal fired power plant with three-stage steam turbo-generator and single
...... (CPI) and the net cash flows over the years discounted back to “today's” $ to ...
TECHNICAL GUIDELINES Generator Efficiency Standards
Australian Greenhouse Office Department of the Environment and Heritage December 2006
Technical Guidelines Generator Efficiency Standards
December 2006
2
Technical Guidelines - Generator Efficiency Standards December 2006
Published by the Australian Greenhouse Office in the Department of the Environment and Heritage. © Commonwealth of Australia 2006 This work is copyright. Apart from any use as permitted under the Copyright Act 1968, no part may be reproduced by any process without prior written permission from the Commonwealth, available from the Department of the Environment and Heritage. Requests and inquiries concerning reproduction and rights should be addressed to: Assistant Secretary Industry Partnerships Branch Department of the Environment and Heritage GPO Box 787 Canberra ACT 2601 ISBN: 1 9212 97 247 This document is available electronically at: www.greenhouse.gov.au/ges/ The views and opinions expressed in this publication are those of the authors and do not necessarily reflect those of the Australian Government or the Minister for the Environment and Heritage. While reasonable efforts have been made to ensure that the contents of this publication are factually correct, the Commonwealth does not accept responsibility for the accuracy or completeness of the contents, and shall not be liable for any loss or damage that may be occasioned directly or indirectly through the use of, or reliance on, the contents of this publication.
Australian Greenhouse Office, Department of the Environment and Heritage
1 1
Technical Guidelines - Generator Efficiency Standards December 2006
Contents 1.0
SCOPE ..........................................................................................................................5
2.0
REFERENCE DOCUMENTS ........................................................................................6
3.0
DEFINITIONS..............................................................................................................10
4.0
APPLICATION OF GREENHOUSE EFFICIENCY STANDARDS..............................13
4.1 PRINCIPLES ...............................................................................................................13 4.2 APPLICABLE GASES AND ASSOCIATED GREENHOUSE WARMING POTENTIAL ................15 4.3 APPLICATION TO EXISTING, REFURBISHED AND NEW PLANT ........................................15 4.3.1 General .............................................................................................................15 4.3.2 Existing/Refurbished Plant................................................................................18 4.3.3 New Plant .........................................................................................................23 4.4 OPTIONS FOR REDUCING GREENHOUSE EMISSIONS ...................................................25 5.0
EMISSION FACTORS FOR GAS-FIRED PLANT ......................................................26
5.1 MEASUREMENT OF GAS VOLUME AND QUALITY ..........................................................26 5.1.1 General .............................................................................................................26 5.1.2 Volumetric Measurement..................................................................................26 5.1.3 Energy Measurement .......................................................................................27 5.1.4 Gas Metering Equipment ..................................................................................27 5.1.5 Standard Conditions .........................................................................................28 5.1.6 Inspection and Audit .........................................................................................29 5.2 EMISSION FACTORS ...................................................................................................29 5.2.1 Carbon Dioxide (CO2) .......................................................................................29 5.2.2 Methane (CH4) and Nitrous Oxide (N2O) ..........................................................29 6.0
EMISSION FACTORS FOR OIL-FIRED PLANT ........................................................31
6.1 FUEL OIL QUANTITY AND QUALITY ..............................................................................31 6.1.1 Oil Metering ......................................................................................................31 6.1.2 Oil Sampling .....................................................................................................31 6.1.3 Fuel Oil Analysis ...............................................................................................31 6.2 EMISSION FACTORS ...................................................................................................32 6.2.1 Carbon Dioxide (CO2) .......................................................................................32 6.2.1 Methane (CH4) and Nitrous Oxide (N2O) ..........................................................32 7.0
EMISSION FACTORS FOR COAL-FIRED PLANT ....................................................33
7.1 COAL QUANTITY AND QUALITY ...................................................................................33 7.1.1 Coal weighing ...................................................................................................33 7.1.2 Stockpile quantities...........................................................................................34 7.1.3 Coal sampling and sample preparation ............................................................35 7.1.4 Coal analysis ....................................................................................................37 7.1.5 Carbon in ash ...................................................................................................37 7.2 EMISSION FACTORS ...................................................................................................38 7.2.1 Carbon Dioxide (CO2) .......................................................................................38 7.2.2 Methane (CH4) ..................................................................................................39 7.2.3 Nitrous Oxide (N2O) ..........................................................................................39 8.0
MEASUREMENT PROTOCOL FOR ELECTRICITY OUTPUT ..................................40
9.0
MEASUREMENT PROTOCOL FOR COGENERATION PLANTS.............................41
9.1 9.2 9.3
GENERAL ..................................................................................................................41 DETERMINATION OF GREENHOUSE INTENSITY .............................................................42 ENERGY AS PROCESS STEAM ....................................................................................42
Australian Greenhouse Office, Department of the Environment and Heritage
2 2
Technical Guidelines - Generator Efficiency Standards December 2006
APPLICATION TO COGENERATION PLANTS ..................................................................43 9.4 9.5 ENERGY METERING ...................................................................................................43 9.5.1 Electricity ..........................................................................................................43 9.5.2 Steam, condensate return, and make-up water................................................43 9.5.3 Other energy products (e.g., compressed air) ..................................................44 10.0 10.1 10.2
CALCULATION OF GREENHOUSE INTENSITY...................................................45 GREENHOUSE INTENSITY MEASUREMENT INTERVAL ................................................45 ANNUAL AVERAGE GREENHOUSE INTENSITY ...........................................................45
11.0
GREENHOUSE EFFICIENCY REPORTING REQUIREMENTS.............................46
12.0
REVIEW OF GREENHOUSE EFFICIENCY STANDARDS ....................................47
APPENDIX A
THERMAL EFFICIENCY THEORY AND PRINCIPLES ...........................48
A.1 GENERATED AND SENT-OUT THERMAL EFFICIENCY ....................................................48 A.2 THERMAL PLANTS ......................................................................................................49 A.2.1 Boiler Efficiency ................................................................................................49 A.2.2 Steam Turbine Efficiency..................................................................................51 A.3 GAS TURBINE PLANTS ...............................................................................................52 A.4 COMBINED CYCLE PLANTS .........................................................................................53 A.5 COGENERATION/COMBINED HEAT AND POWER PLANTS ..............................................53 A.5.1 General .............................................................................................................53 A.5.2 Cogeneration Thermal Efficiency......................................................................54 A.5.3 Greenhouse Intensity........................................................................................54 A.6 CALORIFIC VALUE OF FOSSIL FUELS ...........................................................................54 APPENDIX B
POWER PLANT DEGRADATION ............................................................56
B.1 INTRODUCTION ..........................................................................................................56 B.2 BACKGROUND ...........................................................................................................56 B.3 TYPES OF DEGRADATION ...........................................................................................56 B.3.1 Recoverable losses ..........................................................................................56 B.3.2 Non-recoverable degradation ...........................................................................56 B.4 GAS TURBINES ..........................................................................................................57 B.4.1 Causes of degradation - overview ....................................................................57 B.4.2 Rates of degradation ........................................................................................57 B.4.3 Compressor degradation ..................................................................................58 B.4.4 Turbine degradation...............................................................................................61 B.5 STEAM TURBINES AND ANCILLARIES ...............................................................................62 B.5.1 Steam turbine ........................................................................................................62 B.5.2 Condensers ...........................................................................................................66 B.6 BOILERS ........................................................................................................................67 B.6.1 Boiler (PF fired, for Steam power plant) ................................................................67 B.6.2 Heat Recovery Steam Generators.........................................................................68 B.7 CYCLING OPERATION .....................................................................................................68 B.7.1 Gas turbines ..........................................................................................................68 B.7.2 Steam turbines.......................................................................................................69 B.7.3 Boilers....................................................................................................................69 B.8 LITERATURE REFERENCES .............................................................................................69 APPENDIX C GAS METER CATEGORIES AND MEASUREMENT RECOMMENDATIONS..........................................................................................................70 APPENDIX D INDICATIVE OPTIONS FOR REDUCING GREENHOUSE GAS EMISSIONS FROM EXISTING PLANTS...............................................................................72 D.1 RANGE OF OPTIONS ......................................................................................................72
Australian Greenhouse Office, Department of the Environment and Heritage
3 3
Technical Guidelines - Generator Efficiency Standards December 2006
APPENDIX E
COSTING OF OPTIONS ...........................................................................77
APPENDIX F
NEW PLANT STANDARDS......................................................................80
F.1 TYPES OF POWER GENERATION CYCLES .........................................................................80 F.2 PERFORMANCE OF ELECTRIC POWER GENERATION SYSTEMS ....................................80 F.2.1 Background.......................................................................................................80 F.2.2 Reference conditions ........................................................................................81 F.2.3 Simulation results .............................................................................................83 F.3 REFERENCES ............................................................................................................91 APPENDIX G
GES GREENHOUSE INTENSITY CALCULATOR...................................92
Australian Greenhouse Office, Department of the Environment and Heritage
4 4
Technical Guidelines - Generator Efficiency Standards December 2006
1.0
SCOPE
This guide covers the application of Generator Efficiency Standards, measured in terms of greenhouse intensity, to Australian fossil fuel based electricity and steam producers (when in conjunction with electricity production), existing and proposed, and sets out recommended practices for: a) determining best practice greenhouse efficiency standards for existing/refurbished power/cogeneration plant b) determining best practice greenhouse efficiency standards for new power/cogeneration plant c) determining the actual greenhouse intensity for power plant based on total fuel burned over a twelve month period and the corresponding energy output as electricity, and steam if applicable d) comparison of actual greenhouse intensity with best practice efficiency standards e) reporting greenhouse intensity performance. This guideline also provides background theory and principles on power plant and cogeneration plant thermal efficiency, and indicative options for reducing greenhouse intensity. Greenhouse efficiency is measured on the basis of the six Inter-governmental Panel on Climate Change (IPCC) gases. However, this guideline is applicable only to greenhouse gases from fuel burning, i.e., CO2, CH4 and N2O1. Greenhouse intensity is measured as the ratio of the quantity of greenhouse gases expressed as carbon dioxide equivalent to the quantity of electrical and if applicable thermal energy dispatched. The other greenhouse gases are not normally applicable but should be included where they arise.
1
Carbon dioxide, methane and nitrous oxide,respectively.
Australian Greenhouse Office, Department of the Environment and Heritage
5 5
Technical Guidelines - Generator Efficiency Standards December 2006
2.0
REFERENCE DOCUMENTS
American Gas Association/American Petroleum Institute AGA Report No. 3
Orifice Metering of Natural Gas Part 1: General Equations & Uncertainty Guidelines (1990) Part 2: Specification and Installation Requirements (2000) Part 3: Natural Gas Applications (1992) Part 4: Background, Development Implementation Procedure (1992)
AGA Report No. 7
Measurement of Gas by Turbine Meters (1996)
AGA Report No. 8
Compressibility Factor of Natural Gas and Related Hydrocarbon Gases (1994)
ANSI/API 14.3.1 - 2003
General Equations and Uncertainty Guidelines - Concentric, Square edged Orifice Meters (reaffirmed 2001)
ANSI/API 14.3.2 - 2000
Specification and Installation Requirements - Concentric, Squareedged Orifice Meters
ANSI/API 14.3.3 - 2003
Natural Gas Applications (reaffirmed 2003)
API 14.3 Part 4 1991
Background, Development, Implementation Subroutine Documentation (reaffirmed 1999)
Procedures
and
ASME/ANSI Codes ANSI B109.3 -
'00 for Rotary-Type Gas Displacement Meters
ASME PTC 4 - 1998
Fired Steam Generators
ASME PTC 4.4 - 1981
Gas Turbine (reaffirmed 2003)
ASME PTC 4.3 - 1968
Air Heaters (reaffirmed 1991)
ASME PTC 6 - 1996
Performance Test Code for Steam Turbines
ASME PTC 6S - 1988
Procedures for Routine Performance Test of Steam Turbines (reaffirmed 2003)
ASME PTC 22 - 1997
Performance Test (reaffirmed 2003)
ASME PTC 46 - 1996
Overall Plant Performance
Heat
Recovery
Code
Steam
on
Gas
Generators
Turbines
ASTM Standards ASTM D1298-99 Ed 2
Standard Test Method for Density, Relative Density (Specific Gravity), or API Gravity of Crude Petroleum and Liquid Petroleum Products by Hydrometer Method
ASTM D1945-03
Standard Test Method for Analysis of Natural Gas by Gas Chromatography
ASTM D4057-95(2000)
Standard Practice for Manual Sampling of Petroleum and Petroleum Products
ASTM D4916-04
Standard Practice for Mechanical Auger Sampling
Australian Greenhouse Office, Department of the Environment and Heritage
6 6
Technical Guidelines - Generator Efficiency Standards December 2006
ASTM D6347/D6347M-99
Standard Test Method for Determination of Bulk Density of Coal Using Nuclear Backscatter Depth Density Methods
Australian Codes AS/NZS 1376:1996
Conversion factors
NMI R76-1 Ed 3 Rev 3 2002
Non-automatic Weighing Instruments Part 1 - Metrological and Technical Requirements - Tests Continuous Totalising Automatic Weighing Instruments (Belt weighers) Part 1 - Metrological and Technological Requirements Automatic Rail Weighbridges National Electricity Code Version 1, Amendment 9 - 2004
NMI R50-1 Ed 3 Rev 3 2004
NMI R106 Ed 3 Rev 1 2004
Australian Standards AS ISO 1000-1998
The international system of units (SI) and its application
AS 1038.1-2001
Coal and coke - Analysis and testing - Higher rank coal - Total moisture (supersedes 1038.1 - 1992)
AS 1038.3-2000
Coal and coke - Analysis and testing - Proximate analysis of higher rank coal
AS 1038.5-1998
Coal and coke - Analysis and testing - Gross calorific value
AS 1038.6.1-1997
Coal and coke - Analysis and testing - Higher rank coal and coke Ultimate analysis - Carbon and hydrogen
AS 1038.6.2-1997
Coal and coke - Analysis and testing - Higher rank coal and coke Ultimate analysis - Nitrogen
AS 1038.6.3
Coal and coke - Analysis and testing - Higher rank coal and coke Ultimate analysis Total sulfur (Part 1 1997, Part 2 2003, Part 3 1997)
AS 1038.6.4-2005
Coal and coke - Analysis and testing - Higher rank coal and coke Ultimate analysis - Carbon, hydrogen and nitrogen - Instrumental method
AS 1038.16-1996
Coal and coke - Analysis and testing - Assessment and reporting of results
AS/NZS 1376-1996
Conversion factors
AS 2096-1987
Classification and coding systems for Australian coals
AS 2434.1-1999
Methods for the analysis and testing of lower rank coal and its chars - Determination of the total moisture content of lower rank coal
AS 2434.6.1-2002
Methods for the analysis and testing of lower rank coal and its chars - Lower rank coal - Ultimate analysis - Classical methods (supersedes AS2434.6.1-1986)
AS 2434.8-2002
Methods for the analysis and testing of lower rank coal and its chars - Lower rank coal - Determination of ash (supersedes AS2434.8 - 1993)
AS 2649-1983
Petroleum liquids and gases - Measurement - Standard reference conditions
Australian Greenhouse Office, Department of the Environment and Heritage
7 7
Technical Guidelines - Generator Efficiency Standards December 2006
AS 2651-1983
Liquid hydrocarbons - Volumetric measurement by turbine meter systems (and Amendment 1 - 1984)
AS 2652-1983
Liquid hydrocarbons - Volumetric measurement by displacement meter systems other than dispensing pumps
AS 3583.2-1991
Methods of test for supplementary cementitious materials for use with Portland cement - Determination of moisture content
AS 3583.3-1991
Methods of test for supplementary cementitious materials for use with Portland cement - Determination of loss on ignition
AS 4250.1-1995
Liquid hydrocarbons - Dynamic measurement - Proving systems for volumetric meters - General principles
AS 4250.2-1995
Liquid hydrocarbons - Dynamic measurement - Proving systems for volumetric meters - Pipe provers
AS 4250.3-1995
Liquid hydrocarbons - Dynamic measurement - Proving systems for volumetric meters - Pulse interpolation techniques
AS 4250.4-1995
Liquid hydrocarbons - Dynamic measurement - Proving systems for volumetric meters - Temperature corrections in volumetric calibration by water transfer method
AS 4250.5-1995
Liquid hydrocarbons - Dynamic measurement - Proving systems for volumetric meters - Dynamic measurement
AS 4264.1-1995
Coal and coke - Sampling - Higher rank coal - Sampling procedures
AS 4264.3-1996
Coal and coke - Sampling - Lower rank coal - Sampling procedures
AS 4264.4-1996
Coal and coke - Sampling - Determination of precision and bias
AS 4264.5-1999
Coal and coke - Sampling - Guide to the inspection of mechanical sampling systems
AS 4323.1-1995
Stationary source emissions - Selection of sampling positions (and Amendment 1 1995)
AS 4323.2-1995
Stationary source emissions - Determination of total particulate matter - Isokinetic manual sampling - Gravimetric method
British Standards BS 845-1:1987
Methods for assessing thermal performance of boilers for steam, hot water and high temperature heat transfer fluids. Concise procedure
BS 845-2:1987
Methods for assessing thermal performance of boilers for steam, hot water and high temperature heat transfer fluids. Comprehensive procedure
BS 2869:1998
Specification for fuel oils for agricultural, domestic and industrial engines and boilers
BS 3135:1989
Specification for gas (identical with ISO 2314 - 1989)
BS EN 12952-15:2003
Water-tube boilers and auxiliary installations. Acceptance tests
BS EN 60953-1:1996
Rules for steam turbine thermal acceptance tests. High accuracy for large condensing steam turbines
turbine
Australian Greenhouse Office, Department of the Environment and Heritage
acceptance
test
8 8
Technical Guidelines - Generator Efficiency Standards December 2006
BS EN 60953-2:1996
Rules for steam turbine thermal acceptance tests. Wide range of accuracy for various types and sizes of turbines
BS EN 60953-3:2002
Rules for steam turbine thermal acceptance tests. Thermal performance verification tests of retrofitted steam turbines
ISO Standards ISO 2314:1989
Gas turbines; acceptance tests (and amendment 1 1997, and technical corrigendum 1 1997)
ISO 2314:1989
Gas turbines - Acceptance tests; Amendment 1: Acceptance test for combined-cycle power plants
ISO 6976:1995
Natural gas - Calculation of calorific values, density, relative density and Wobbe index from composition (and technical corrigendums* 1,2 1997 & 3 1999)
New Zealand Standards NZS 5259:2004
Gas measurement
US EPA Methods Method 1 - 1996
Sample and Velocity Traverses for Stationary Sources
Method 5 - 1996
Determination of Particulate Matter Emissions from Stationary Sources
Method 3A - 1989
Carbon Dioxide and Oxygen Concentrations - IAP
Method 4 - 1995
Moisture Content in Stack Gases
Method 10B - 1994
Carbon Monoxide from Stationary Sources
General References Australian Greenhouse Office, Efficiency Standards for Power Generation, Integrating report (to identify best practice emission standards for Australian or fossil fuel generation and assess the financial and economic implications of the measure) SKM Final Report, Jan 2000. Australian Greenhouse Office, Australian Methodology for the Estimation of Greenhouse Gas Emissions and Sinks 2004 Energy (Stationary Sources), National Greenhouse Gas Inventory Committee, 2006 Babcock & Wilcox, Steam - Its Generation and Use, 40th edition, 1992 DPIE/Australian Cogeneration Association, Profiting from Cogeneration, 1997 Intergovernmental Panel on Climate Change (IPCC), Climate Change 2001: The Scientific Basis. Contribution of Working Group I to the Third Assessment Report of the Intergovernmental Panel on Climate Change (IPCC), 2001 Smith I M, Greenhouse Gas Emission Factors for Coal - The Complete Fuel Cycle, IEA Coal Research (London) CR/98 Nov 1998 Walsh P P and Fletcher P, Gas Turbine Performance, Blackwell Science, 1998
Australian Greenhouse Office, Department of the Environment and Heritage
9 9
Technical Guidelines - Generator Efficiency Standards December 2006
3.0
DEFINITIONS
Ash (Aar)
Ash in fuel, expressed as mass % as-received, as-sampled or as-fired.
Auxiliary power/energy
All electricity consumed internally within the boundary of a power station or cogeneration plant to run the plant.
Black coal
Synonymous with higher rank coal. (ref AS 2096)
Brown coal
Synonymous with lower rank coal. (ref AS 2096)
Calorific value, gross (Qgr,p,ar)
Gross calorific value - The number of heat units liberated per unit quantity of fuel burned in oxygen under standard conditions (25 °C; 101.325 kPa); the products of combustion are assumed to consist of gaseous oxygen, carbon dioxide, nitrogen and oxides of nitrogen, sulfur dioxide, and liquid water.
Calorific value, net (Qnet)
The number of heat units liberated per unit quantity of fuel burned in oxygen under standard conditions (25°C; 101.325 kPa); the products of combustion are assumed to consist of gaseous oxygen, carbon dioxide, nitrogen and oxides of nitrogen, sulfur dioxide and water vapour.
Capacity
The rated continuous load-carrying ability, expressed in megawatts, of generation equipment; sometimes referred to as maximum continuous rating (MCR) or continuous maximum rating (CMR).
Capacity factor
Total energy produced for a specified period relative to the total possible amount of energy that could have been produced for the same period.
Total period energy generated ( MWh) × 100% Total installed capacity ( MW ) × period hours Carbon (C)
Carbon in fuel, expressed as mass % as-received, as-sampled or as-fired (Car); and for coal, mass % dry ash-free (Cdaf).
Carbon-in-ash (Ca)
Unburned carbon in ash (furnace ash, economiser ash, or fly ash), expressed as mass % as-sampled.
Cogeneration/ combined heat and power
Simultaneous production of both useful thermal energy (heat, typically as steam) and electrical energy.
Fossil fuels
Energy-rich substances created from the partial decomposition of prehistoric organisms over long periods of time. Examples are coal, coal seam methane, natural gas, and oil.
Australian Greenhouse Office, Department of the Environment and Heritage
10 10
Technical Guidelines - Generator Efficiency Standards December 2006
Global warming potential (GWP)
The instantaneous radiative forcing that results from the addition of 1 kg of a gas to the atmosphere, relative to that of 1 kg of carbon dioxide.
Greenhouse efficiency
General term indicating the performance of a power plant with respect to greenhouse emissions resulting from the combustion of fossil fuels. Also see greenhouse intensity.
Greenhouse intensity (GI)
Measure of Greenhouse efficiency as the emission rate of greenhouse gases from fuel burning expressed in kg CO2 (equiv.)/MWh sent-out. For cogeneration, this is discounted for steam/heat production.
Greenhouse gases (GHG)
Those gaseous constituents of the atmosphere, both natural and anthropogenic, that absorb and re-emit infra-red radiation.
Heat Rate
Heat Rate is a measure of generating station heat efficiency. This is the total fuel heat input expressed in MJ divided by the energy produced by the power plant expressed in MWh. It is related to thermal efficiency by the following expression
HR =
3,600 × 100 given in units of MJ/MWh Thermal Efficiency (%)
See also Equation A.5 Higher heating value (HHV)
This is synonymous with gross calorific value.
Higher rank coal
Coal that is geothermally mature, as defined quantitatively in AS 2096 (gross calorific value ≥ 27 MJ/kg dry, ash-free).
Lower heating value (LHV)
This is synonymous with net calorific value.
Lower rank coal
Coal that is geothermally immature, as defined quantitatively in AS 2096 (gross calorific value 5% of total fuel), it is recommended that the metering system used be inspected and certified on an annual basis in accordance with the relevant State requirements under the National Measurement Act (1960). For plant that uses less than nominal 5% fuel oil, the following clauses are a guide only to metering, sampling and analysis. The following methodology covers the measurement of annual quantities of oil and the determination of the emission factors for CO2, CH4 and N2O from oil-fired power plant.
6.1
Fuel Oil Quantity and Quality
The calculation of emission factors for oil firing requires that procedures be in place for the following operations: (i) (ii) (iii)
oil metering oil sampling oil analysis.
Specific requirements of each operation are as follows.
6.1.1
Oil Metering
Australian standards applicable to the measurement of fuel oil quantities include: • • • • • • • •
6.1.2
AS 2649 AS 2651 AS 2652 AS 4250.1 AS 4250.2 AS 4250.3 AS 4250.4 AS 4250.5.
Oil Sampling
The recommended practice for the sampling of fuel oil for analysis, be it from tanker, drum or fuel oil tank, is ASTM D4057.
6.1.3
Fuel Oil Analysis
For the purpose of determining greenhouse emission factors, Table 4 sets out the recommendations for fuel oil analysis.
Australian Greenhouse Office, Department of the Environment and Heritage
31 31
Technical Guidelines - Generator Efficiency Standards December 2006
Table 4 – Oil analysis requirements for greenhouse efficiency reporting.
Parameter
Frequency of testing
Method
Gross calorific value
Monthly, quarterly or by consignment
BS 2869, API Data Book (Figure 14A1-2), ASTM D 240, or other equivalent Internationally recognised code.
Density (for calculation of calorific value)
Monthly, quarterly or by consignment
ASTM D1298-99 Ed 2
Carbon
Monthly, quarterly or by consignment
Instrumental carbon analysis or calculation from gas chromatograph analysis.
6.2
Emission Factors
6.2.1
Carbon Dioxide (CO2)
The emission factor for CO2 in kg CO2/kg fuel from combustion shall be calculated as follows.
FCO2 =
C a 44 × 100 12
Eqn (9)
where, Ca carbon in fuel, mass % as-received, as-sampled, or as-fired
6.2.1
Methane (CH4) and Nitrous Oxide (N2O)
There is no significant production of methane from combustion of oil in a boiler or gas turbine. As in the gas of gas-fired plant, it is not possible to calculate the quantity of methane emitted as a result of incomplete combustion. Methane emissions must either be measured using a program of regular sampling and analysis, or estimated. For the purposes of this guideline, emission factors for methane and nitrous oxide shall be taken from the most recent Methodology Workbook - Energy (Stationary Sources)5 released by the National Greenhouse Gas Inventory Committee. The conversion of emission factor from t/PJ to kg/kg fuel is as follows:
kg t = × Q gr , p ,ar × 10 −6 kgFuel PJ
Eqn (10)
where, Qgr,p,ar is gross calorific value of the fuel oil in MJ/kg.
5
available at: http://www.greenhouse.gov.au/inventory/methodology/index.html
Australian Greenhouse Office, Department of the Environment and Heritage
32 32
Technical Guidelines - Generator Efficiency Standards December 2006
7.0
EMISSION FACTORS FOR COAL-FIRED PLANT
In this guide, coal-fired plant includes all plant consuming coal and producing electricity that meets the criteria in Clause 4.1. The following methodology covers the measurement of annual quantities of coal, coal quality, and the determination of the emission factors for CO2, CH4 and N2O from coal-fired power plant.
7.1
Coal Quantity and Quality
The calculation of emission factors for coal firing requires that procedures be in place for the following operations: (i) (ii) (iii) (iv) (v)
coal weighing stockpile quantities coal sampling and sample preparation coal analysis carbon in furnace ash and fly ash.
Specific requirements for each of the operations are defined below. In each case, with the agreement of the AGO, alternate methodologies can be used if it can be demonstrated that these alternatives provide values of the same accuracy or better as those recommended in the guidelines.
7.1.1
Coal weighing
The method of weighing coal depends on the mode of transport of the coal to the power plant and can be carried out at the coal loading facility or at the coal receiving facility. Equipment for weighing or determining coal quantity includes rail weighers, weigh bridges, hopper weighers, and belt weighers. Calibration of the coal weighing system should be carried out as per the manufacturer’s instructions and at least on an annual basis. Some types of weighing system, e.g., belt weighers will require more frequent calibration. Calibration masses should be traceable to the appropriate National Standard of measurement. Guidance on technical requirements for weighers is included in the following codes: • • •
NMI R76-1 Ed 3 Rev 3 2002 NMI R50-1 Ed 3 Rev 3 2004 NMI R106 Ed 3 Rev 1 2004.
The maximum permissible error for weighers as prescribed by the National Standards Commission (Australia) is given in Table 5. Other methods for determining total coal quantity, such as mine volume change, may be used provided that any such method has a demonstrated maximum error not exceeding ±1.5%.
Australian Greenhouse Office, Department of the Environment and Heritage
33 33
Technical Guidelines - Generator Efficiency Standards December 2006
Table 5 – Maximum permissible errors for coal weighers on installation.
Weigher
NSC Document
MPE
Weigh bridges Class III (Static conditions)
Doc. 100
0 - 500 scale intervals 501 - 2,000 >2,000
Hopper weighers Class III (Dynamic conditions)
Doc. 100
±0.1% (new) ±0.1% (re-verification)
Belt weighers (dynamic conditions) Class I Class II
Doc. 102 Doc. 102
±0.5% ±1.0%
Rail weighers
Doc’s 113 and 117
Train: ± 5t or ± 0.2% of total mass, whichever is the greater.
±0.5 SI ±1 SI ±1.5 SI
Wagons: ±1t or ±1% of total mass, whichever is the greater (under dynamic conditions).
7.1.2
Stockpile quantities
The determination of the quantity of coal on a stockpile at a particular point in time should be determined using the following two-step procedure: (i) (ii)
Volume survey Stockpile bulk density.
It should be noted that the determination of the quantity of coal on a stockpile is relatively imprecise particularly because of the inherent difficulties in measuring bulk density. In most locations, the amount of coal on a stockpile at any given point in time is relatively small (5 10% of the total quantity of coal burnt in one year). However, at some locations it has been the practice to stockpile very large quantities of coal in which case the estimation of stockpile quantity becomes problematic. 7.1.2.1 Volume survey Stockpile volume may be estimated using accepted aerial survey or general survey techniques. 7.1.2.2 Stockpile bulk density The determination of the bulk density of a stockpile is inherently difficult because most of the coal is inaccessible to sampling. The recommended procedure for determining the bulk density of stockpiled coal is detailed in ASTM D6347/D6347M-99. Failing that, the recommended procedure is dependent on the quantity of coal stockpiled relative to the quantity of coal burnt for the year. Recommended procedures are given in Table 6.
Australian Greenhouse Office, Department of the Environment and Heritage
34 34
Technical Guidelines - Generator Efficiency Standards December 2006
Table 6 – Recommended procedures for stockpile bulk density.
Approximate Stockpile Mass (mSTOCKPILE)
Bulk Density Procedure
mSTOCKPILE ≤10% of annual coal burn
Extraction of sample by mechanical auger as per ASTM D4916 - 89 • Weigh mass of sample extracted • Measure volume of hole • Bulk density equals mass over volume
mSTOCKPILE > 10% of annual coal burn
Extraction of sample by coring • Weigh mass of sample extracted • Measure volume of hole • Bulk density equals mass over volume
7.1.3
Coal sampling and sample preparation
7.1.3.1 Coal sampling and sample preparation procedures The purpose of coal sampling is to obtain representative samples of the coal burnt for analysis as required to determine CO2 emissions. For the purposes of measurement as-received and as-fired will be treated as equivalent methods, dependent upon sampler location and plant configuration. Standards for the sampling, preparation of test samples, and verification of sampling and sample preparation systems and operations are ASTM D6347/D6347M-99 and AS 4264 Parts 1, 3, 4 & 56. As coal is a heterogeneous material, for the sample to be truly representative it must contain the correct proportions of each particle size present, as well as the correct proportions of particles of varying impurity content. Therefore, in the process of collecting a representative sample, each particle in the Lot must have an equal probability of being sampled (’equal selection probability’); the representivity of the sample being a function of the mass of the sample, or more correctly, the number of particles in the sample. A mechanical sampling system, designed and operated in accordance with AS 4264 should be used to sample the coal. Ideally, this type of sampling system would be set up to intersect coal as it is either being loaded at the coal source or unloaded at the power plant, and that a Lot of coal will normally represent 1 day or one train load of coal. If necessary, manual sampling of the coal may be used provided that the sampling equipment and procedure used is in accordance with AS 4264. Sample preparation as required providing a laboratory sample for analysis is normally carried out in two steps:
6
Standards Australia Committee MN1 is currently preparing a guide to the sampling of coal stockpiles for the determination of bulk density.
Australian Greenhouse Office, Department of the Environment and Heritage
35 35
Technical Guidelines - Generator Efficiency Standards December 2006
Step 1 – Initial crushing and subdivision of the samples as part of an operation that is integrated with the coal sampling Step 2 – Final crushing and subdivision at the laboratory to provide the analysis sample. 7.1.3.2 Inspection and Audit Having installed a mechanical sampling system which conforms to the design criteria of AS 4264 (Part 1 or Part 2), this Guideline recommends that an in-house inspection and technical audit program be implemented, as described in AS 4264 Part 5, to cover equipment and operations associated with the sampling of coal. 7.1.3.3 Sampling precision Precision is defined as a measure of the extent to which the observations within a set agree with each other; usually expressed as twice the standard deviation (95% confidence level). Precision checks should be carried out on the sampling process to confirm that the sampling rate is acceptable, and it can be carried out on the sample preparation process. The procedure for determining the precision of coal sampling and sample preparation is prescribed in AS 4264.5. It is recommended that precision tests be undertaken on a yearly basis and whenever there is a change in the coal source or a significant change in the quality characteristics of a particular coal. In the case where several coals are being sampled through a given plant, sampling conditions and sample precision checks should be carried out on the coal that exhibits the highest degree of heterogeneity. 7.1.3.4 Sampling bias Bias can be defined as the tendency to obtain a value that is either consistently higher or consistently lower than the reference value; in practice, the difference between the reference value and the average result obtained from a large number of determinations. The recommended procedure for the estimation of bias in a coal sampling system is given in AS 4264.4. In the case of bias testing of mechanical samplers, the reference samples are usually stopped belt samples off a conveyor belt. For the purposes of verification of a coal sampling system, the coal samples taken for bias testing (i.e., pairs consisting of a reference sample and a sample taken by the coal sampler) should be analysed for total moisture and ash. Bias testing should always be carried out on a new sampling system. For an existing system the following verification procedure may be followed if there is some doubt about the conformance of the sampling system. (a) (b) (c)
Conduct a detailed technical audit of the sampling system. Correct any non-conformances that have been observed. Conduct a limited bias test on the system, usually with the coal that exhibits the widest stochastic variability in total moisture or ash, to provide a more quantitative verification that the sampling system is performing correctly.
Australian Greenhouse Office, Department of the Environment and Heritage
36 36
Technical Guidelines - Generator Efficiency Standards December 2006
7.1.4
Coal analysis
For the purposes of determining CO2 per unit mass of coal, Table 7 sets out the recommendations for coal analysis. Table 7 – Coal analysis requirements for CO2 reporting.
Parameter
Frequency of testing
Standard method
Total moisture (as-received or as-fired basis)
Every consignment
Higher rank coal: AS 1038.1 and AS 1038.3 Lower rank coal: AS 2434.1
Ash (as-received or as-fired basis)
Every consignment
Higher rank coal: AS 1038.3
Carbon (dry, ash free basis)
Monthly analysis sample Higher rank coal: AS 1038.6 composite Lower rank coal: AS 2434.6.1
Gross calorific value
Monthly analysis sample AS 1038.5 composite
Lower rank coal: AS 2434.8
Coal analysis verification and reporting practices are described in AS 1038.16.
7.1.5
Carbon in ash
It is recognised that the configuration of plant varies and measurement of carbon in ash should be based on representative operating conditions for the plant. 7.1.5.1 Furnace ash Furnace ash includes ash collected at the bottom of the furnace hopper of the coal unit and ash collected within the economiser hopper at the rear pass of the coal fired power plant. There is no standard procedure to collecting furnace ash or economiser hopper ash; however, in a wet extraction system reasonable samples may be obtained by using sampling ladles to collect material from sluiceways, whilst in a dry extraction system good representative samples can be obtained directly from the conveyor. Note: Particular care must be taken in attempting to obtain samples of furnace ash because of the inherent dangers associated with such operations. 7.1.5.2 Fly ash Fly ash is that ash which is carried over from the furnace. There are several procedures for sampling fly ash:
Australian Greenhouse Office, Department of the Environment and Heritage
37 37
Technical Guidelines - Generator Efficiency Standards December 2006
Method I
Sampling of the dust either at the outlet of the boiler airheater or the inlet to the flue gas cleaning plant using isokinetic sampling procedures as per AS 4323.1 - 1995 and AS 4323.2 - 1995.
Method II
Collection of fly ash using standard industry ‘cegrit’ extraction equipment.
Method III
Sampling of the fly ash from the fly ash collection hoppers of the flue gas cleaning plant or downstream of the fly ash collection hoppers from ash silos or sluice ways.
Method IV
On-line carbon in ash analysers using sample extraction probes and infra-red analysers have been installed in some power plants.
Method I is preferred. If Method II or Method IV is used, the carbon in ash determined from such samples should be calibrated against isokinetic fly ash samples collected using Method I. For the purposes of determining carbon in ash, the following sampling frequency is recommended: Method I Method II Method III Method IV
Every two years, and as a function of load. Every year, and as a function of load. Every year. Every two years, and as a function of load.
7.1.5.3 Carbon in ash In the case where physical furnace ash and fly ash samples have been taken, the carbon in ash should be determined using the following methods: • •
AS 3583.2 - 1991 AS 3583.3 - 1991
Determination of moisture content Determination of loss on ignition
7.2
Emission Factors
7.2.1
Carbon Dioxide (CO2)
The emission factor for CO2 (in kg CO2/kg Coal), from combustion, shall be calculated as follows.
⎞ 44 ⎛C Ca × Aar ⎟× FCO2 = ⎜⎜ ar2 − 2 ⎟ ⎝ 10 (100 − Ca ) × 10 ⎠ 12
Eqn (11)
where Car Ca Aar
carbon in fuel, % as-received or as-fired carbon in ash, % as-sampled (weighted average of fly ash and furnace ash) ash in fuel, % as-received or as-fired
Australian Greenhouse Office, Department of the Environment and Heritage
38 38
Technical Guidelines - Generator Efficiency Standards December 2006
In addition,
C ar = C daf ×
(100 − M ar − Aar ) 100
Eqn (12)
Where Cdaf Mar Aar
carbon in coal, mass % dry ash-free basis the moisture in coal, mass % as-received or as-fired the ash, mass % as-received or as-fired.
7.2.2
Methane (CH4)
There is no significant production of methane from combustion of coal in a boiler, although it could be an issue in the case of synthesis gas (syngas) leakage from coal gasifier plants as syngas usually contains a proportion of methane. For the purposes of this guideline, emission factors for methane and nitrous oxide shall be taken from the most recent Methodology Workbook - Energy (Stationary Sources)7 released by the National Greenhouse Gas Inventory Committee. To convert t CH4/PJ to kg CH4/kg coal multiply by Qgr/106. For example, if the gross calorific value of the coal were 25 MJ/kg or 25 GJ/t, then an emission factor of 0.9 t CH4/PJ becomes 0.0000225 kg CH4/kg coal.
7.2.3
Nitrous Oxide (N2O)
Nitrous oxide is generally formed under low temperature, reducing conditions (in other words, pyrolysis conditions) and as a consequence its concentration is normally very low in coal fired power plants. For the purposes of this guideline, emission factors for methane and nitrous oxide shall be taken from the most recent Methodology Workbook - Energy (Stationary Sources)7 released by the National Greenhouse Gas Inventory Committee. To convert t N2O/PJ to kg N2O/kg coal multiply by Qgr/106. For example, if the gross calorific value of the coal were 25 MJ/kg or 25 GJ/t, then an emission factor of 1.4 t N2O/PJ becomes 0.000035 kg N2O/kg coal.
7
available at: http://www.greenhouse.gov.au/inventory/methodology/index.html
Australian Greenhouse Office, Department of the Environment and Heritage
39 39
Technical Guidelines - Generator Efficiency Standards December 2006
8.0
MEASUREMENT PROTOCOL FOR ELECTRICITY OUTPUT
This section sets out how electricity generation is to be measured for the purposes of this guideline. The period of one year used for determining the annual quantity of electricity shall coincide with the period of one year used for determining the annual amount of fuel consumption. The quantity to be measured is the net or sent-out electricity generation in energy terms, using units of MWh, designated MWhso for the purposes of this guideline. The terms “net” and “sent-out” are synonymous in this guideline and are defined in accordance with the National Electricity Rules (NER): In relation to a generating unit, the amount of electricity supplied to the transmission or distribution network at its connection point. It is recommended that sent-out electricity generation be measured in terms of active energy, in units of watt-hours, and in accordance with the applicable requirements of Chapter 7 (Metering) of the National Electricity Rules (NER). GES participants must comply with NER metering requirements and use the best installed equipment for electricity metering.. Access to the NER may be obtained via the Australian Energy Market Commission web site at http://www.aemc.gov.au/rules.php. Electricity consumed by workshops or other facilities attached to the plant but serving other functions than plant operations shall not form part of the calculation of greenhouse intensity.
Australian Greenhouse Office, Department of the Environment and Heritage
40 40
Technical Guidelines - Generator Efficiency Standards December 2006
9.0
MEASUREMENT PROTOCOL FOR COGENERATION PLANTS
9.1
General
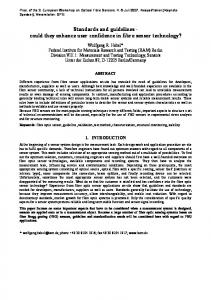
Cogeneration can be both a means of reducing the heat energy rejected by conventional power generation technologies, and a means of generating electricity as a by-product of thermal energy produced for or by industrial processes. The term “cogeneration” may cover a range of technologies and the plant configuration is host specific. (Note: the term “host” refers to the industrial process providing or using the thermal energy). In this guide, cogeneration is treated as a special case for the following reasons: (i) (ii)
the power plant is usually configured around particular process needs and not the converse many cogeneration plants are off grid and the host consumes all the electricity produced.
Theoretical concepts for cogeneration are outlined in Appendix A. The energy inputs and outputs for the process (Figure 3) are generally as follows: Energy Inputs
Fuel, in GJ (EFuel)
Energy Outputs
Thermal energy (usually as steam), in GJ (EThermal) Electricity sent-out, GJ, including electricity used by the host and, where applicable, electricity exported to grid (Esent-out) Cogeneration plant boundary
Power Plant
Power generated
Power sent-out Electricity to grid
Fuel Auxiliary power Make-up water
Condensate return
Process steam
Power cogeneration
Process
Imported electricity
Figure 3 – Schematic representation of a typical cogeneration plant.
Australian Greenhouse Office, Department of the Environment and Heritage
41 41
Technical Guidelines - Generator Efficiency Standards December 2006
Therefore, the Cogeneration Efficiency (ηCOGEN) is as follows:
η COGEN =
EThermal + E Sent Out E Fuel
× 100%
Eqn (16)
where ESent-out is the electrical energy sent-out (i.e., electricity generated less power plant auxiliary load) in MWhs. Electricity used off-grid by the cogeneration host (the receiver of energy, either thermal or electrical) is to be considered as electricity sent-out.
9.2
Determination of Greenhouse Intensity
For cogeneration plant, greenhouse intensity shall be calculated as follows:
GI COGEN . =
m F × 3.6 FCO2 + 21FCH 4 + 310 FN 2O E Sent −out + EThermal
(
)
Eqn (17)
Where mF is quantity of fuel consumed for the measurement period, in kg (see Sections 5-7), and EThermal and Esent-out are in units of GJ. Note: 1 MWh = 3.6 GJ. The Emission Factors (Fi) are as previously defined.
9.3 (a)
Energy as Process Steam For process steam, calculation of the thermal energy consumed by the process requires the measurement and recording of the following temperature, pressure, and mass quantity data at a frequency sufficient to provide reliable annual average data. Delivered steam temperature, in °C Delivered steam pressure, in kPa or bar Delivered steam quantity, designated msteam, in tonnes Condensate return temperature, in °C Condensate return quantity, designated mcond, in tonnes Make-up water temperature, in °C Make-up water quantity, designated mmake, in tonnes
(b)
From the above pressure and temperature data, the specific enthalpy in units of GJ/t for each stream shall be determined from the Steam Tables and designated as follows. Delivered steam enthalpy Condensate enthalpy Make-up water enthalpy
(c)
hg (in GJ/t) hf,cond (in GJ/t) hf,make (in GJ/t)
The energy delivered to the host, designated EThermal, in units of GJ, shall be calculated by using the following formula.
Australian Greenhouse Office, Department of the Environment and Heritage
42 42
Technical Guidelines - Generator Efficiency Standards December 2006
EThermal = {msteam × hg − (mcond × h f , cond + mmake × h f , make )} GJ
Eqn (18)
i.e., EThermal = EProcess steam – ECondensate return – EMake-up
9.4
Application to Cogeneration Plants
This guide treats cogeneration plant as a special case because the ηCOGEN is a function of electrical and thermal energy outputs; each of which can vary widely depending on process requirements. Therefore, for cogeneration plant, greenhouse efficiency should be assessed in terms of individual plant elements using the results of tests conducted periodically or by measuring or modelling actual performance. The tests to be carried out should be designed to do the following. •
Boilers - Compare the actual performance of the boiler at a range of loads calculated using the heat loss method described in Appendix A, with the performance expected under a series of reference conditions as referred to in Clause 4.3.2.2.
•
Gas Turbine Generators - Compare the actual performance of the gas turbine at a range of loads based on simplified heat rate tests, with the performance expected under a range of reference conditions.
•
Steam turbines - Compare the actual performance of the steam turbine at a range of loads/steam off-takes based on simplified heat rate tests, with the performance expected under a range of reference conditions.
•
Auxiliaries - Compare the consumption of power of plant auxiliaries with that expected under reference conditions.
It is recommended that cogeneration plants prepare an in-house protocol based on the methodology described above or alternative appropriate methods for approval by the AGO, as a basis for assessing greenhouse efficiency under GES.
9.5
Energy Metering
9.5.1
Electricity
Electricity sent-out as shown in Figure 3 shall be metered at the output terminals to the electrical transmission grid using metering equipment supplied with the plant. In the case of new cogeneration plant, electricity metering shall be in accordance with the requirements of the National Electricity Code (see Section 8 of this guide). Where electricity used by the host is not measured, a site-specific protocol shall be developed for determining Electricity sent-out for approval by the AGO.
9.5.2
Steam, condensate return, and make-up water
The measurements required for steam in cogeneration plants include flow, temperature and pressure; and for condensate return and make-up water, flow and temperature. In the case where greenhouse intensity of a particular plant is to be reported on the basis of a series of periodic tests at one or more loads or cogeneration ratios [i.e., MW thermal/(MW thermal + MW electrical)], then the standards of measurement described in ASME PTC 4, 4.4, 22 or equivalent International code, shall apply.
Australian Greenhouse Office, Department of the Environment and Heritage
43 43
Technical Guidelines - Generator Efficiency Standards December 2006
9.5.3
Other energy products (e.g., compressed air)
Cogeneration plants, especially those that are physically mingled and commercially vertically integrated with host industry sites may pose challenges to the application of these guidelines because of: • the absence of metering on all energy streams • the production of energy streams other than electricity and process heat (typically in the form of steam). Examples of other energy streams are hot water, chilled water (from absorption chiller), hot oil, compressed air, and hot exhaust gas. Where energy streams are presently not accurately metered then either accurate metering will need to be fitted by the owner or a site-specific methodology developed for estimating those streams. Where the cogeneration plant produces energy streams other than electricity and process heat in the form of steam, it is recommended that the cogeneration plant boundary be redrawn upstream on the energy conversion chain such that it crosses the primary energy product from the cogeneration plant. This concept is illustrated by the following example. A cogeneration plant exports compressed air to the host. Both steam turbines and electric motors drive the air compressors. The respective energy conversion chains could be depicted as shown below, where the symbol M (metering) shows the recommended location for the redrawn cogeneration plant boundary: Fuel → Heat → Steam → M → Turbine Drive Shaft Power → Compressed Air → Consumer Fuel → Heat → Steam → Turbine Alternator Shaft Power → Electricity → M → Electric Drive Shaft Power → Compressed Air → Consumer While compressed air is exported from the cogeneration plant to the host, the compressed air is considered a secondary energy product, the primary energy products being steam, in the case of the steam turbine compressor drives, and electricity, in the case of the electric motor compressor drives.
Australian Greenhouse Office, Department of the Environment and Heritage
44 44
Technical Guidelines - Generator Efficiency Standards December 2006
10.0 CALCULATION OF GREENHOUSE INTENSITY 10.1 Greenhouse Intensity Measurement Interval This guide recommends that the greenhouse intensity for a given plant, expressed in units of kg CO2 equiv./MWh sent-out, be measured at intervals of not more than 3 months (and preferably monthly). The greenhouse intensity for the measurement interval shall be calculated as follows:
GI =
Tonnes Fuel × 103 FCO2 + 21FCH 4 + 310 FN 2 O MWh sent−out
(
)
Eqn (19)
For cogeneration plant, refer to Section 9.2.
10.2 Annual Average Greenhouse Intensity The Annual Average Greenhouse Intensity (AAGI) shall be calculated as the average GI for each measurement period (e.g., 12 × 1 month intervals) weighted on the basis of the MWh sent-out for the measurement period. All fuels used in the maintenance of the plant need to be included in calculating AAGI. However, the fuel used in plant vehicles does not need to be included. Annual average greenhouse intensity initially needs to be reported for comparison to a best practice performance range, and subsequently reported annually.
Australian Greenhouse Office, Department of the Environment and Heritage
45 45
Technical Guidelines - Generator Efficiency Standards December 2006
11.0 GREENHOUSE EFFICIENCY REPORTING REQUIREMENTS GES participants are obligated to provide an annual business report to the Commonwealth. Key Performance Indicators to be incorporated are: • • • • • • • • • •
type of fuel (black coal, brown coal, gas, oil, other) average annual greenhouse intensity capacity capacity factor output factor tonnes of fuel used MWh generated, MWh sent-out, MWh imported, GJ thermal energy produced in cogeneration. sent-out thermal efficiency details of improvement options undertaken and other options identified greenhouse target.
Australian Greenhouse Office, Department of the Environment and Heritage
46 46
Technical Guidelines - Generator Efficiency Standards December 2006
12.0 REVIEW OF GREENHOUSE EFFICIENCY STANDARDS Greenhouse Efficiency Standards are to be reviewed every 5 years for existing and new plants. Any affected GES participant may request a review for their plant at any time during this period. A review of the standards applicable to an existing power plant will be triggered by a significant refurbishment. Refurbishments are "significant" if they result in an accumulative capacity upgrade of at least 10% above the maximum capacity used to determine the GES reference curve. When this occurs the reference curve and best practice performance range will be recalculated with new acceptance/performance data resulting from the refurbishment. The non-recoverable degradation period will also be reset.
Australian Greenhouse Office, Department of the Environment and Heritage
47 47
Technical Guidelines - Generator Efficiency Standards December 2006
APPENDIX A A.1
THERMAL EFFICIENCY THEORY AND PRINCIPLES
Generated and Sent-Out Thermal Efficiency
The thermal efficiency of the power plant is defined as the ratio of energy out to the useful energy in, and may be expressed in terms of Generated Thermal Efficiency (ηGEN) or Sentout Thermal Efficiency (ηSO):
η GEN =
η SO =
PG × 100 % m F Q gr , p ,ar
PN × 100 % m F Q gr , p ,ar
PN = PG − PA
and, η SO = η B ×
Eqn (A.1)
Eqn (A.2)
Eqn (A.3)
ηT
⎛ P ⎞ × ⎜⎜1 − A ⎟⎟ % 100 ⎝ PG ⎠
Eqn (A.4)
where
ηB, ηT efficiency of boiler and turbine, respectively, % power at the generator terminals less the auxiliary load (not driven by the turbine or PN other prime mover), i.e., sent-out power, in MWh PG power at the generator terminals, MWh PA auxiliary load (including unit and station auxiliaries), MWh mF fuel burn rate, kg/s Qgr,p,ar gross calorific value of the fuel at constant pressure, as-fired, MJ/kg An alternative expression for thermal efficiency is Heat Rate (HR), where:
HR =
3600 × 100 , in units of MJ/MWh Thermal Efficiency (%)
Eqn (A.5)
In expressing the units of power, it is common to draw a distinction between electrical power MWe and thermal power MWT. The terms Generated Heat Rate (GHR), and Sent-out Heat Rate (SHR), relate to ηGEN and ηSO, respectively.
Australian Greenhouse Office, Department of the Environment and Heritage
48 48
Technical Guidelines - Generator Efficiency Standards December 2006
A.2
Thermal Plants
A.2.1 Boiler Efficiency There are two basic approaches to the determination of boiler efficiency: • •
Heat loss method Input/Output method.
Heat Loss Method The heat loss method is usually the most accurate and simplest and is based on a subtraction from the total heat input of heat losses from the boiler (ASME PTC 4 - 1998). The boiler absorbs most of the heat released on combustion of the fuel, however, the following significant energy losses invariably occur depending on ambient air conditions, coal quality, and the size, configuration and age of the boiler. (i) (ii) (iii) (iv) (v) (vi) (vii)
Heat loss due to moisture in combustion air (La) Heat loss due to dry flue gas (Lg) Heat loss due to moisture in coal (Lmf) Heat loss due to water from combustion of hydrogen (H) in coal (LH) Heat loss due to sensible heat in fly ash, furnace ash, economiser ash and mill rejects (LA) Radiation and convective heat losses from the external surface of the boiler, (LR) Radiation loss to ash hopper.
Hence, the overall boiler efficiency is 100 less the sum of the losses in (i) to (vi) above. The following Equations (based on ASME PTC 4 - 1998) may be applied in the calculation of boiler heat losses from the combustion of fuels. (i)
Heat loss due to moisture in combustion air
La = WaWA (Tg − Ta )c p , wv MJ/kg
Eqn (A.6)
where Wa is the mass of water vapour per kg of combustion air, WA the mass of combustion air per kg of fuel as-fired, Tg is the exit flue gas temperature in °C, Ta the inlet air temperature in °C, and cp,wv the average specific heat capacity of water vapour (0.002 MJ/kgC between 20 and 200°C). (ii)
Heat loss due to dry flue gas
Lg = Wg (Tg − Ta )c p , g MJ/kg
Eqn (A.7)
where Wg is the mass of dry flue gas per kg of fuel as-fired using theoretical air, and cp,g the average specific heat capacity of flue gas (0.001 MJ/kgC between 20 and 200°C). (iii)
Heat loss due to moisture in fuel
Lmf =
M ar {(100 − Ta )c p,w + hwg + (Tg − 100)c p,wv } MJ/kg 100
Australian Greenhouse Office, Department of the Environment and Heritage
Eqn (A.8)
49 49
Technical Guidelines - Generator Efficiency Standards December 2006
(iv)
where Mar is the moisture content of the fuel in % as-fired, cp,w the specific heat of water (0.0042 MJ/kgC at 17,500
Satisfies all Standards referenced in Sect. 5.1.2/5.1.3
Smart Transmitters: Pressure < ±0.10% Diff. Pressure < ±0.10% Temperature < ±0.25%
•
On-line instantaneous measurement preferred.
• • • •
Australian Greenhouse Office, Department of the Environment and Heritage
71 71
Monthly validation (includes orifice plate inspections) by an approved person. The validation period may be extended to a maximum of 3 months subject to satisfactory test history and check procedures. Turbine meters spin test to be carried out every 3 months. Orifice meter inspected, cleaned and certified every 2 years. Turbine and PD meters certified by an independent testing authority or Master Meter every 6 months. The period may be extended to 12 months subject to satisfactory test history and check procedures. Master meter certified annually. Monthly validation (includes orifice plate inspections) by an approved person. Turbine meters spin test to be carried out every 3 months. Orifice meter inspected, cleaned and certified every 2 years. Turbine meters certified by an independent testing authority or Master Meter every 6 months. Master meter certified annually.
Technical Guidelines - Generator Efficiency Standards December 2006
APPENDIX D INDICATIVE OPTIONS FOR REDUCING GREENHOUSE GAS EMISSIONS FROM EXISTING PLANTS D.1 Range Of Options A range of options for increasing plant efficiency and, thus, reducing CO2 emissions is available. These can be categorised into three classes of action: • • •
Restore the Plant to Design Condition Change Operational Settings Retrofit Improvements.
Tables D.1 and D.2 list options for CO2 reduction, and provides a brief description of each action with an indication of the reduction in Greenhouse Intensity that could be achieved. This list is not intended to be exhaustive - there may be other alternatives. Not all the options listed can be applied to all plants and some of these options are mutually exclusive.
Australian Greenhouse Office, Department of the Environment and Heritage
72 72
Technical Guidelines - Generator Efficiency Standards December 2006
Table D.1 – Options for greenhouse gas reduction: boiler, steam turbine and heat recovery steam generator plant. Action
Description
Potential Efficiency Improvement, % HHV
Restore the Plant to Design Condition Operate boiler at the design O2 in flue gas
Any O2 in the flue gas represents an excess of air above that needed for combustion and is a loss of energy because that excess air leaves the boiler at a higher temperature than it entered. Reduced excess air will bring an immediate increase in boiler efficiency.
Up to 0.6
Restore and maintain airheaters
The air-heater plays an important part in recovering energy from the combustion products. If the air-heater is allowed to operate with ash deposits or with damaged or missing surface (in the case of rotary air-heaters), boiler efficiency will be reduced.
Up to 0.3
Minimise boiler tramp air
Boiler tramp air does not pass through the air-heater, which means that the reduced air flow through the air-heater will not cool the flue gas as much as intended resulting in lower efficiency. It also forces operation with higher than necessary excess air.
Up to 1.0
Reinstate any feed-heaters out of service
Feed-heaters improve steam cycle efficiency by using lowgrade heat from low-pressure steam from the turbine to heat the boiler feed water. Feed-heaters are sometimes taken out of service permanently to overcome water leakage problems. This can lead to an increase in power output, but at reduced fuel efficiency. The effect on efficiency is different depending on the plant design.
Up to 2.0
Reduce turbine gland leakage
The main gland leakage point is between the high pressure cylinder and the intermediate pressure cylinder. Any leakage of steam at this point allows it to bypass the high pressure turbine without any useful work being done by it.
Up to 0.2
Change Operational Settings Low excess air operation
Low excess air operation reduces the quantity of combustion gases and, hence, the heat loss from the dry flue gases leaving the boiler. The excess air level is a trade-off between unburnt fuel loss at low excess air and flue gas heat loss at high excess air. The level can often be reduced, particularly if the combustion system is properly tuned and controlled.
Up to 1.2
Improved combustion control
Improved combustion control enables the boiler to operate with lower excess air without the risk of combustion instability or excessive unburnt fuel. It involves both burner tuning better control system performance to keep the plant in a safe condition with low excess air.
Up to 0.5
Australian Greenhouse Office, Department of the Environment and Heritage
73 73
Technical Guidelines - Generator Efficiency Standards December 2006
Table D.1 – Options for greenhouse gas reduction: boiler, steam turbine and heat recovery steam generator plant. Action
Description
Increased condenser cleaning
Condenser fouling causes the turbine back pressure to increase. More frequent cleaning can keep this increase to a minimum, allowing higher efficiency. The cleaning can either be on-line or off-line. The rate of condenser fouling depends on many factors. The improvement that is possible is plant specific.
Increased boiler cleaning
Boiler ash deposits reduce heat transfer rates and ultimately lead to higher flue gas temperatures. The boiler can be kept cleaner, either through off-load cleaning or through the use of better on-load cleaning systems such as soot blowers, water blowers and water cannons.
Potential Efficiency Improvement, % HHV Up to 0.5
Up to 1.0
Retrofit Improvements Add extra heat transfer surface in the boiler, e.g. economiser or air-heater Install additional sootblowers
Extra heat transfer surface in the boiler will enable additional heat to be extracted from the flue gas leading to lower flue gas temperatures. In some cases, the boilers already have space allowance for extra air-heater surface. There is an increased risk of low temperature corrosion.
Up to 0.8
Additional sootblowers will help keep the boiler surfaces cleaner and, thus, increase the effective surface area. This will bring a slight reduction in flue gas temperature.
Up to 0.4
Install dry furnace ash extraction system
Replace existing wet furnace ash extraction system with a dry system to reduce heat losses due to sensible heat in furnace ash, and radiation to ash hopper and save auxiliary power.
Up to 0.7
Install new high efficiency turbine blades
Modern turbine blades have 3-dimensional variation in shape and are more efficient than the original blades. It is possible to install new blades in the last rows or replace all blades and install new rotors.
Up to 1.0
Change to steam driven feed pumps
Steam driven feed pumps can reduce the auxiliary power requirements of the plant by using lower grade energy for feed pumping.
Install variable speed drives on major plant items
Variable speed drives allow the auxiliary power consumption to be reduced as the plant load is reduced, and thus the benefits plants that have long periods of operation at reduced load.
Up to 0.4
Install on-line condenser cleaning system
Improved condenser cleaning can improve efficiency by allowing lower turbine exhaust temperatures. On-line cleaning will allow the condenser to be kept at a high level of cleanliness.
Up to 0.5
Australian Greenhouse Office, Department of the Environment and Heritage
74 74
Technical Guidelines - Generator Efficiency Standards December 2006
Table D.1 – Options for greenhouse gas reduction: boiler, steam turbine and heat recovery steam generator plant. Action
Description
Install new cooling tower film pack
In plants that use cooling towers, installing new film-type packs can reduce the cooling water temperature to the condensers. Some cooling towers only have spray systems, which are less effective.
Australian Greenhouse Office, Department of the Environment and Heritage
Potential Efficiency Improvement, % HHV Up to 1.0
75 75
Technical Guidelines - Generator Efficiency Standards December 2006
Table D.2 – Options for greenhouse gas reduction: open-cycle gas turbine plant. Action
Description
Potential Efficiency Improvement, % HHV
Restore the Plant to Design Condition Replace/clean fouled air filters
Fouled air filters increase the pressure drop across the air inlet to the gas turbine compressor.
Up to 0.4%
Change Operational Settings Increase frequency of compressor cleaning Check control system settings
Compressor washing restores compressor efficiency.
Up to 0.5% per wash
Check IGV angles, instrument calibration and hardware for correct operation.
Up to 0.5%
Retrofit Improvements Consider inlet air conditioning Upgrade components to increase firing temperature Review air inlet and GT exhaust arrangements
Options are evaporative cooler, mist/fog system.
Up to 0.5%
Increased firing temperature increases efficiency.
Application specific
Revised inlet and exhaust duct arrangements may reduce pressure drop.
Up to 0.3%
Australian Greenhouse Office, Department of the Environment and Heritage
76 76
Technical Guidelines - Generator Efficiency Standards December 2006
APPENDIX E
COSTING OF OPTIONS
The $ cost/t CO2 equivalent avoided is broadly calculated as follows:
Cost / tCO2 avoided =
Net $ Cost of implementing greenhouse actions Tonnes CO2 saved
Eqn (E.1)
where the $ savings are usually in the form of fuel savings. For example, if a particular action is identified which will cost $100,000 per annum (annualised capital cost plus any additional non-fuel operating and maintenance cost, less annual fuel saving) but with savings of 20,000 t CO2 per annum, then the $ Cost/t CO2 avoided is $5/t. The Australian Greenhouse Office (AGO) developed a tool, the GES Abatement Calculator, to help GES Measure participants and other generators carry out cost analyses in a consistent way. GES participants are encouraged to use the GES Abatement Calculator for financial assessments of proposed abatement actions. The costing calculator includes the following tools: • •
Spreadsheet-based model that calculates the cost of abatement in $/tonne CO2-e terms (see note below) User Guide.
These publications are available from http://www.greenhouse.gov.au/ges/publications/index.html The steps necessary to calculate the $/tonne cost of abatement (whether negative or positive) are explained within the calculator itself. The Model calculates the $/tonne cost of GHG abatement by evaluating the costs and benefits of carrying out an action to reduce GHG emissions. The cost/benefit analysis is carried out using a standard Net Present Value (NPV) project analysis. An improvement project would be considered viable if the NPV of the project was zero (at the selected discount rate) if all relevant factors affecting the financial analysis were taken into account. The costs and revenues are escalated at some percentage of the consumer price index (CPI) and the net cash flows over the years discounted back to “today’s” $ to reflect the “time value of money”. A negative NPV would indicate a project that did not meet the criteria set, caused by insufficient revenue to offset the capital cost and changes in operating costs. The cost of GHG abatement is defined as the Net Present Value below zero. A positive NPV would indicate a project that was viable purely on financial grounds without assigning any value to the GHG savings that will occur as a direct result of the project. The Model uses equations from the GES Technical Guidelines to calculate the Greenhouse Intensity in kg/MWh for the plant before the modification or action (called “business as usual”) and after the action (called “after modification”). The Model is arranged in two sections each comprising two worksheets for: •
Coal fired plant (which can be expanded to cater for other fuels). methodology in the GES Technical Guidelines Section 7.2 Eqn. (11)
Australian Greenhouse Office, Department of the Environment and Heritage
This uses the
77 77
Technical Guidelines - Generator Efficiency Standards December 2006
•
Gas fired plant - This uses Table 5.1 to evaluate the emission factor for the gas being used and then the formula on page 51 of the Technical Guidelines to calculate the Greenhouse Intensity.
Provision has been made to include the affects of tax and depreciation. Generally, to provide a “level playing field” for the assessments these would be set to zero. These have been included for special cases where there is something unusual about the circumstances of the modification i.e. it attracts a special tax break or increased depreciation. The use of values other than zero would need to be justified. A discount rate of 12% was considered appropriate if the evaluation is being made without considering tax and depreciation. 12% was considered a reasonable Weighted Average Cost of Capital in the electricity industry. A default duration of 10 years of operation with the modification in place is used, but may be amended by users. Generally, a 10 year period is considered a reasonable period for the benefits to be realised. After 10 years operation, the plant may need to be refurbished (above normal maintenance) and the performance gain may decrease considerably. The main inputs that can be varied on the financial modelling worksheet are: •
Unit capacity - Many modifications that improve the efficiency of plant also increase (but not always) the maximum capacity. For some plant this increases the revenue earning potential of the plant
•
Auxiliary Load - some modifications change the auxiliary load required for the plant either increasing or decreasing the amount of electricity available for sale
•
Capacity Factor (and Reliability) - some modifications change these either increasing or decreasing the amount of electricity available for sale
•
Efficiency (expressed as heat rate) - the user can nominate the change in heat rate on a yearly basis as the affect of the modification may vary over time
•
Fuel Price - for example as a result of changing fuel source or preparation
•
Capital Cost of the modification
•
Changes in operating cost - personnel, materials and contracts.
The greenhouse gas savings are calculated by multiplying the change in Greenhouse Intensity by the “after” electricity output, expressed in MWh. The “value” of the GHG abatement over the calculation period is calculated by: •
Escalating the Dollar/Tonne cost of GHG abatement, using the cumulative CPI at present. There may be reasons why this would change, e.g. carbon trading values
•
Converting these value to “real” $ values (i.e. discounting by the cumulative CPI)
•
Obtaining “real” $ per year values by multiplying by the amount of GHG abated (in tonnes) for the year
•
Discounting these $ values by the discount rate to obtain an NPV for the “value” of GHG abatement
Australian Greenhouse Office, Department of the Environment and Heritage
78 78
Technical Guidelines - Generator Efficiency Standards December 2006
•
A solution is found for the $/tonne of abatement where the sum of the NPV’s from the financial analysis and the abatement analysis are zero. This is the cost of the GHG abatement.
The spreadsheets give worked examples of a modification of both a coal and a gas fired plant.
Australian Greenhouse Office, Department of the Environment and Heritage
79 79
Technical Guidelines - Generator Efficiency Standards December 2006
APPENDIX F
NEW PLANT STANDARDS
F.1 Types of Power Generation Cycles An overview of the application of a range of various fossil fuels in power generation technologies is given in Table F.1 below. A general description of the technologies is readily obtained from the literature (see References Section F.3) and is, therefore, not replicated in this guideline. Table F.1 – Fossil fuel/power generation technology applications
Fossil Fuels
Combustion Turbine OCGT
CCGT
X X
X X
Natural Gas Coal Seam Gas/Coal Bed Methane Black coal Brown coal Coal washery rejects Coke oven off-gas Coal mine methane
Air Turbine OCGT
Retort/ Air Turbine
Boiler SubC
SC/ USC
AFBC
OCGT
PFBC
IGCC
SubC
X X
X X
X X X
X X
X X
X X X
X X
X X
X
Heavy fuel oil X X Diesel X X X X Distillate X X X Petroleum Coke X X X X Fuel oil residues X Shale oil X X Notes: a. Abbreviations – OCGT – Open cycle gas turbine; CCGT – Combined cycle gas turbine; SubC – Sub-critical; SC – super-critical; USC – ultra super-critical; Atmospheric fluidised bed combustor; PFBC – pressurised fluidised bed combustor; IGCC – Integrated gasification combined cycle b. X – indicates possible fossil fuel/technology applications. c. Shaded cells indicate fossil fuel/technology options specifically covered in the present guide, which represent the most common applications for electricity generation. d. No distinction is drawn in the present guide between Natural Gas and Coal Seam Gas/Coal Bed Methane.
F.2
Performance of Electric Power Generation Systems
F.2.1
Background
The AGO recognises that new plant standards for a given class of plant should reflect Best Available Technology (BAT) under a range of Australian conditions. Indicative values of power plant efficiency and Greenhouse Intensity have been determined (CCSD, May 2005) using a recognised power industry software package, GateCycle© from GE Enter Software, for the following technology/fuel types:
Australian Greenhouse Office, Department of the Environment and Heritage
80
Technical Guidelines - Generator Efficiency Standards December 2006
(i) (ii) (iii)
Super-critical PF plant under wet and dry cooling conditions (SCW, SCD) for black and brown (lignite) Australian coals Ultra-super-critical PF plant under wet and dry cooling conditions (USCW, USCD) for black and brown (lignite) Australian coals Open and combined cycle gas turbines using natural gas/coal seam gas, and distillate fuels.
In addition, a basic set of ambient corrections or dry bulb temperature, wet bulb temperature (or relative humidity) and ambient pressure for each of the technology options has been established. The modeling work was validated and tested using the following procedures: (i)
(ii)
(iii)
F.2.2
Comparison of predicted performance from the GateCycle© model against actual performance of state-of-the-art coal fired plant (super-critical) and gas turbine combined cycle power plant recently installed and operating under Australian conditions Comparison of model outputs for the PF super-critical and ultra-super-critical cases against outputs from other proprietary models such as Steam Master and SteamPro Comparison of performance differences against literature data.
Reference conditions
The power plant efficiency and greenhouse intensity standard values presented in these Guidelines have been based on the reference coal, natural gas/coal seam gas and fuel oil specifications summarised in Tables F.2 – F.4 below. The fuel types assessed were as follows: • • • • • • •
Black Coal: BLC1 - Medium ash, high volatile domestic coal (e.g., Surat basin coal) Black Coal: BLC2 - Medium ash, low - medium volatile domestic coal (e.g., Hunter Valley coal) Black Coal: BLC3 - Medium ash, very high volatile domestic coal (e.g., Collie coal) Brown Coal: BRC1 - Low ash, high moisture brown coal/lignite (e.g., Latrobe Valley brown coal) Natural gas - NG Coal seam gas - CSG (or Coal Bed Methane, CBM) Distillate – D.
Australian Greenhouse Office, Department of the Environment and Heritage
81
Technical Guidelines - Generator Efficiency Standards December 2006
Table F.2 - Reference coals Black coal 1
Black coal 2
Black coal 3
Brown coal 1
7.5 21.2 29.2 42.1 24.4
25.0 8.0 27.6 39.4 19.20
61.5 0.8 19.5 18.2 10.2
84.3 5.3 1.8 0.6 7.9 5.0 2.0 90
75.1 4.36 1.39 0.55 18.6 3.0 1.0 90
69.8 4.90 0.60 0.40 24.3 18.0 18.0 90
Proximate Analysis Total moisture (%, ar) 12.4 Ash (%, ar) 25.4 Volatile matter (%, ar) 33.3 Fixed carbon (%, ar) 28.7 Gross calorific value (MJ/kg, ar - HHV) 20.14 Ultimate analysis Carbon (%, daf) 76.5 Hydrogen (%, daf) 6.45 Nitrogen (%, daf) 0.95 Sulphur (%, daf) 0.53 Oxygen (%, daf) 15.57 Unburnt carbon in furnace ash (%) 5.0 Unburnt carbon in fly ash (%) 1.7 Proportion of ash emitted as fly ash (%) 90 Abbreviations: ar - as-received; daf - dry, ash-free Table F.3 – Reference natural gas/coal seam gas Base pressure (bar, absolute) 1.01325 Base temperature (°C) 15 SG of mixture 0.6185 Gross calorific value (MJ/Sm3, HHV) 38.91 Net calorific value (MJ/Sm3, HHV) 35.11 Density (kg/Sm3) 0.7579 Wobbe Index (MJ/Sm3, HHV) 49.48 Composition (mole %) Methane 90.91 Ethane 4.50 Propane 1.04 n-Butane 0.21 i-Butane 0.13 Helium 0.04 Nitrogen 1.11 Carbon Dioxide 2.06 Table F.4 – Reference distillate Moisture (%) Ash (%) Gross calorific value (MJ/kg, HHV) Composition (mass %) Carbon Hydrogen Nitrogen Sulfur
0 0 45.74 86.67 13.23 0.09 0.01
In addition, the following ambient conditions apply. Table F.5 – Reference ambient conditions Parameter Base 1 Dry bulb temperature (°C) 25.00 10.00 Wet bulb temperature (°C) 19.45 6.46 Relative humidity (%) 60 60 Pressure (bar, a) 1 1 Equivalent altitude (m) 111 111
Ambient Conditions 2 3 4 35.00 25.00 25.00 28.16 19.35 19.40 60 60 60 1 0.945 0.975 111 584 323
Australian Greenhouse Office, Department of the Environment and Heritage
5 25.00 14.37 30 1 111
6 25.00 22.37 80 1 111
82
Technical Guidelines - Generator Efficiency Standards December 2006
A range of steam conditions were selected for the PF power plant assessments to cover a range of super-critical and “ultra-super-critical” steam conditions. The steam conditions applied to the combined cycle gas turbine application were based on a large state-of-the-art plant already installed in Australia. The steam turbine conditions are given in Table F.6. Table F.6 – Steam turbine conditions PF plants Wet cooling
Main steam inlet Pressure (MPa) Temperature (°C) Reheat steam inlet Pressure (MPa) Temperature (°C) Condenser pressure (kPa) - based on 90% cleanliness factor
Brown coal Case 4 Case 5
Dry cooling
Gas turbine combined cycle plants
Case 1
Black coal Case 2
Case 3
27.5 605
28.5 600
30.0 630
25.0 566
26.5 576
27.5 605
11.3 565
5.7 613 6
6.1 620 6
6.1 630 6
4.4 565 6
5.7 600 6
5.7 613 12
2.7 565 6
In all cases, the main boiler feed water pump is steam driven and a mechanical draft cooling tower is used. The turbine generator efficiency was assumed to be 99.1% with a power factor of 0.9. The transformer loss of 0.3% was assumed.
F.2.3
Simulation results
F.2.3.1 Ultra super-critical PF plant with wet cooling with black coals The simulation model for this plant was based on an existing super-critical PF plant. In raising the steam conditions from super-critical to ultra super-critical (see Table F.7), it was assumed that the turbine stage efficiency of each pressure stage remained constant. This was a triple pressure, single reheat cycle with seven feed water pre-heaters, including a deaerator. The main feed water pump was steam driven. The condenser was wet cooled with the cooling water and operated at 6 kPa. The cooling tower was a mechanical-draft type. The boiler exhaust gas left the stack at 130°C. The simulations were performed with three different black coals and the results are shown in Table F.8. Table F.7 – Steam turbine conditions Main steam inlet Temperature (°C) Pressure (MPa) Reheat steam inlet Temperature (°C) Pressure (MPa) Condenser pressure (kPa) Isentropic stage efficiency High pressure stage Intermediate pressure stage Low pressure stage * Case 1 in Table 6
Super-critical
Ultra super-critical*
566 25.0
605 27.5
565 4.4 6
613 5.7 6
0.902 0.890 0.896
0.902 0.890 0.896
Australian Greenhouse Office, Department of the Environment and Heritage
83
Technical Guidelines - Generator Efficiency Standards December 2006
Table F.8 – Ultra super-critical PF plant with black coals & wet cooling system, coal variation results Coal Black coal 1 Black coal 2 Black coal 3 CO2 emission factor (kgCO2/GJ fuel) 85.4 90.1 96.1 Ambient and steam conditions 25 25 25 Dry bulb temperature (°C) Relative humidity (%) 60 60 60 Ambient air pressure (mbar absolute) 1,000 1,000 1,000 Main (superheat) steam @ turbine inlet 605 605 605 Temperature (°C) Pressure (MPa) 27.5 27.5 27.5 Reheat (single) steam @ turbine inlet 613 613 613 Temperature (°C) Pressure (MPa) 5.7 5.7 5.7 290 290 290 Final feedwater temperature (°C) Unit performance Gross power (MWe) 446 446 446 Net power (MWe) 425 426 425 Sent-out power (MWe) 424 425 424 Boiler efficiency (%, HHV) 87.4 89.4 87.3 Turbine efficiency (%) 48.4 48.4 48.4 Sent-out thermal efficiency (%, HHV) 40.2 41.2 40.2 Power station CO2 emission (kg/MWh SO) 765 785 860 Power station SO2 emission (kg/MWh SO) 2.9 3.1 3.4 Water consumption (kg/MWh SO) 1,880 1,870 1,880 Coal feed rate (kg/hr) 188,300 151,900 197,600
F.2.3.2 Ultra super-critical PF plant with black coal and dry cooling system The simulation model in F.2.3.1 was modified by replacing the mechanical-draft water-cooled condenser with a mechanical-draft air-cooled condenser. The condenser operating pressure was increased from 6 kPa to 12 kPa. The simulations were performed with three different black coals and the results are shown in Table F.9.
Australian Greenhouse Office, Department of the Environment and Heritage
84
Technical Guidelines - Generator Efficiency Standards December 2006
Table F.9 – Ultra-super-critical PF plant with dry cooling, coal variation results Coal Black coal 1 Black coal 2 Black coal 3 CO2 emission factor 85.4 90.1 96.1 (kgCO2/GJ fuel) Ambient and steam conditions 25 25 25 Dry bulb temperature (°C) Relative humidity (%) 60 60 60 Ambient air pressure (mbar 1,000 1,000 1,000 absolute) Main (superheat) steam @ turbine inlet Pressure (MPa) 27.5 27.5 27.5 605 605 605 Temperature (°C) Reheat (single) steam @ turbine inlet Pressure (MPa) 5.7 5.7 5.7 613 613 613 Temperature (°C) Final feedwater 290 290 290 temperature (°C) Unit performance Gross power (MWe) 429 429 429 Net power (MWe) 409 410 408 Sent-out power (MWe) 407 408 408 Boiler efficiency (%, HHV) 87.4 89.4 87.3 Turbine efficiency (%) 46.6 46.6 46.6 Sent-out thermal efficiency 38.7 39.7 38.7 (%, HHV) Power station CO2 795 820 895 emission (kg/MWh SO) Power station SO2 3.0 3.2 3.6 emission (kg/MWh SO) Water consumption 0 0 0 (kg/MWh SO) Coal feed rate (kg/hr) 188,300 151,900 197,600
F.2.3.3 Ultra super-critical PF plant with wet cooling with black coal 1 The simulation model in F.2.3.1 was modified by changing the steam turbine inlet conditions (see Conditions 2 & 3 in Table F.6). Again, it was assumed that the turbine stage efficiency of each pressure stage remained constant for different steam conditions. The excess air fraction, stack gas temperature and boiler efficiency were also kept constant. The simulations were performed with black coal 1 only and the results are shown in Table F.10.
Australian Greenhouse Office, Department of the Environment and Heritage
85
Technical Guidelines - Generator Efficiency Standards December 2006
Table F.10 – Super-critical and ultra super-critical PF plant with black coal 1 and wet cooling system, steam condition variation results Case 1 Case 2 Case 3 Case 4 SC USC USC USC CO2 emission factor (kgCO2/GJ fuel) 85.4 85.4 85.4 85.4 Ambient and steam conditions 25 25 25 25 Dry bulb temperature (°C) Relative humidity (%) 60 60 60 60 Ambient air pressure (mbar absolute) 1,000 1,000 1,000 1,000 Main (superheat) steam @ turbine inlet Pressure (MPa) 25.0 27.5 28.5 30.0 566 605 600 630 Temperature (°C) Reheat (single) steam @ turbine inlet Pressure (MPa) 4.4 5.7 6.1 6.1 565 613 620 630 Temperature (°C) 287 290 290 292 Final feedwater temperature (°C) Unit performance Gross power (MWe) 421.3 446.3 446.9 460.7 Net power (MWe) 401.1 424.9 425.5 438.6 Sent-out power (MWe) 399.9 423.6 424.2 437.2 Boiler efficiency (%, HHV) 87.4 87.4 87.4 87.4 Turbine efficiency (%) 47.1 48.4 48.5 49.1 Sent-out thermal efficiency (%, HHV) 39.1 40.2 40.3 40.8 Power station CO2 emission (kg/MWh 785 764 763 753 SO) Power station SO2 emission (kg/MWh 3.01 2.92 2.92 2.88 SO) Water consumption (kg/MWh SO) 2000 1877 1871 1825 Coal feed rate (kg/hr) 182,800 188,300 188,200 191,600
F.2.3.4 Ultra super-critical PF plant with wet cooling with black coal 1 – ambient condition variations The simulations under varying ambient conditions were performed with black coal 1 only and the results are shown in Table F.11.
Australian Greenhouse Office, Department of the Environment and Heritage
86
Technical Guidelines - Generator Efficiency Standards December 2006
Table F.11 – Ultra super-critical PF plant with black coal 1 and wet cooling system – ambient condition variations results Ref. Case 1 Case 2 Case 3 Case 4 Case 5 Case 6 CO2 emission factor 85.4 85.4 85.4 85.4 85.4 85.4 85.4 (kgCO2/GJ fuel) Ambient and steam conditions Dry bulb temperature 25 10 35 25 25 25 25 (°C) Relative humidity (%) 60 60 60 60 60 30 80 Ambient air pressure 1,000 1,000 1,000 945 975 1,000 1,000 (mbar absolute) Main (superheat) steam @ turbine inlet Pressure (MPa) 27.5 27.5 27.5 27.5 27.5 27.5 27.5 605 605 605 605 605 605 605 Temperature (°C) Reheat (single) steam @ turbine inlet Pressure (MPa) 5.70 5.70 5.70 5.70 5.70 5.70 5.70 613 613 613 613 613 613 613 Temperature (°C) Final feedwater 290 289 289 290 290 289 290 temperature (°C) Unit performance Gross power (MWe) 446 446 434 446 446 446 446 Net power (MWe) 425 425 412 425 425 425 425 Sent-out power (MWe) 424 424 411 424 424 424 424 Boiler efficiency (%, 87.4 87.3 87.5 87.4 87.4 87.5 87.4 HHV) Turbine efficiency (%) 48.4 48.6 47.5 48.5 48.4 48.6 48.2 Sent-out thermal 40.2 40.4 39.4 40.2 40.2 40.4 40.0 efficiency (%, HHV) Power station CO2 765 760 780 765 765 760 770 emission (kg/MWh SO) Power station SO2 2.9 2.9 3.0 2.9 2.9 2.9 2.9 emission (kg/MWh SO) Water consumption 1,877 1,498 2,167 1,888 1,883 2,009 1,808 (kg/MWh SO) Coal feed rate (kg/hr) 188,300 187,500 186,500 188,100 188,300 187,500 189,300
F.2.3.5 Ultra super-critical PF plant with dry cooling with black coal 1 – ambient condition variations The simulations under varying ambient conditions were performed with black coal 1 only and the results are shown in Table F.12.
Australian Greenhouse Office, Department of the Environment and Heritage
87
Technical Guidelines - Generator Efficiency Standards December 2006
Table F.12 – Ultra super-critical PF plant with dry cooling with black coal 1 – ambient condition variations results Ref. Case 1 Case 2 Case 3 Case 4 Case 5 Case 6 CO2 emission factor 85.4 85.4 85.4 85.4 85.4 85.4 85.4 (kgCO2/GJ fuel) Ambient and steam conditions 25 10 35 25 25 25 25 Dry bulb temperature (°C) Relative humidity (%) 60 60 60 60 60 30 80 Ambient air pressure (mbar 1,000 1,000 1,000 945 975 1,000 1,000 absolute) Main (superheat) steam @ turbine inlet Pressure (MPa) 27.5 27.5 27.5 27.5 27.5 27.5 27.5 605 605 605 605 605 605 605 Temperature (°C) Reheat (single) steam @ turbine inlet Pressure (MPa) 5.70 5.70 5.70 5.70 5.70 5.70 5.70 613 613 613 613 613 613 613 Temperature (°C) Condenser back-pressure 12.2 5.57 19.4 12.4 12.3 12.3 12.2 (kPa) Final feedwater 290 287 289 290 290 290 290 temperature (°C) Unit performance Gross power (MWe) 429 429 414 429 429 429 429 Net power (MWe) 409 409 394 409 409 409 409 Sent-out power (MWe) 407 408 392 407 408 407 407 Boiler efficiency (%, HHV) 87.4 87.3 87.5 87.4 87.4 87.5 87.4 Turbine efficiency (%) 46.6 47.9 45.3 46.6 46.6 46.5 46.6 Sent-out thermal efficiency 38.67 39.8 37.55 38.66 38.66 38.60 38.66 (%, HHV) Power station CO2 emission 795 770 820 795 795 796 795 (kg/MWh SO) Power station SO2 emission 3.04 2.95 3.13 3.04 3.04 3.05 3.04 (kg/MWh SO) Water consumption 0 0 0 0 0 0 0 (kg/MWh SO) Coal feed rate (kg/hr) 188,300 183,100 186,800 188,400 188,400 188,700 188,300
F.2.3.6 Super-critical and ultra super-critical PF plants with wet cooling with brown coal 1 The simulation model in F.2.3.1 was modified to be run with brown coal 1. The most significant changes made were the lower furnace exit gas temperature and higher stack gas temperature (160°C); and unburnt carbon in ash (18%). The operating conditions on the steam side were the same as in the black coal cases. Only the overall heat and mass balances around the boiler were performed and the coal drying stage was not modeled separately. The simulations were performed for two sets of steam conditions (see Conditions 4 & 5 in Table F.5). Again, it was assumed that the turbine stage efficiency of each pressure stage remained constant for different steam conditions. The results of the simulations are shown in Table F.13.
Australian Greenhouse Office, Department of the Environment and Heritage
88
Technical Guidelines - Generator Efficiency Standards December 2006
Table F.13 – Super-critical and ultra super-critical PF plants with brown coal 1 and wet cooling system Condition 4 Condition 5 CO2 emission factor (kgCO2/GJ fuel) 94.2 94.2 Ambient and steam conditions 25 25 Dry bulb temperature (°C) Relative humidity (%) 60 60 Ambient air pressure (mbar absolute) 1,000 1,000 Main (superheat) steam @ turbine inlet Pressure (MPa) 25.0 26.5 566 576 Temperature (°C) Reheat (single) steam @ turbine inlet Pressure (MPa) 4.39 5.7 565 600 Temperature (°C) 287 288 Final feedwater temperature (°C) Unit performance Gross power (MWe) 421 432 Net power (MWe) 394 405 Sent-out power (MWe) 393 404 Boiler efficiency (%, HHV) 72.0 72.0 Turbine efficiency (%) 47.1 47.8 Sent-out thermal efficiency (%, HHV) 31.8 32.3 Power station CO2 emission (kg/MWh SO) 1,065 1,050 Power station SO2 emission (kg/MWh SO) 3.36 3.31 Water consumption (kg/MWh SO) 2,013 1,957 Coal feed rate (kg/hr) 435,900 440,700
F.2.3.7 Open cycle gas turbine plants with natural gas and distillate fuels The data presented below is based on a large scale class F gas turbine representing stateof-the-art commercial technology with high pressure-ratio, staged combustion and proven blade cooling technology. The simulation model utilised the GateCycle© built-in gas turbine library for the performance data of this gas turbine modelled. Auxiliary power loss of 3.9 MWe was included in the overall plant efficiency calculation. The results of the simulations are shown in Table F.14.
Australian Greenhouse Office, Department of the Environment and Heritage
89
Technical Guidelines - Generator Efficiency Standards December 2006
Table F.14 – Open cycle gas turbine plants with natural gas and distillate results NG/CSG Distillate Ambient conditions 25 25 Dry bulb temperature (°C) Relative humidity (%) 60 60 Ambient air pressure (mbar absolute) 1,000 1,000 Unit performance CO2 emission factor (kgCO2/GJ fuel) 51.2 69.5 Gross Power (MWe) 269 258 Net power (MWe) 265 253 Sent-out power (MWe) 264 250 Sent-out thermal efficiency (%, HHV) 33.1 32.5 Power station CO2 emission (kg/MWh SO) 555 760 Power station SO2 emission (kg/MWh SO) 0 0.05 Fuel feed rate (kg/hr) 55,950 60,570
F.2.3.8 Combined cycle gas turbine plants with natural gas - ambient condition variations The simulation model for this plant was based on an existing natural gas combined cycle plant. As in F.2.3.7 the gas turbine chosen was Alstom GT26. The steam cycle was subcritical, triple pressure single reheat cycle extracting all of its heat energy from the gas turbine exhaust via a heat recovery steam generator. The feed water pumps were electric driven. The operating pressure of the water-cooled condenser was 6 kPa. The cooling tower was a mechanical-draft type. The results of the simulations are shown in Table F.15. Table F.15 – Combined cycle gas turbine plant with natural gas/coal seam gas – condition variations results Ref. Case Case Case Case 1 2 3 4 Ambient conditions 25 10 35 25 25 Dry bulb temperature (°C) Relative humidity (%) 60 60 60 60 60 Ambient air pressure (mbar absolute) 1,000 1,000 1,000 945 975 Unit performance CO2 emission factor (kgCO2/GJ fuel) 51.2 51.2 51.2 51.2 51.2 Gross power (MWe) 406 424 388 386 396 Net power (MWe) 400 417 382 380 390 Sent-out power (MWe) 399 416 381 379 389 Sent-out thermal efficiency (%, HHV) 51.6 51.9 51.1 51.7 51.7 Power station CO2 emission (kg/MWh SO) 355 355 360 355 355 Power station SO2 emission (kg/MWh SO) 0 0 0 0 0 Water consumption (kg/MWh SO) 950 730 1120 985 965 Natural gas feed rate (kg/hr) 54,290 56,360 52,370 51,500 52,910
ambient Case 5
Case 6
25 30 1,000
25 80 1,000
51.2 404 398 397 52.1 355 0 1010 53,600
51.2 407 401 400 51.6 355 0 920 54,430
F.2.3.9 Combined cycle gas turbine plant with distillate The simulation model in F.2.3.8 was modified to run with distillate in place of natural gas.
Australian Greenhouse Office, Department of the Environment and Heritage
90
Technical Guidelines - Generator Efficiency Standards December 2006
The results of the simulations are shown in Table 16. Table F.16 – Combined cycle gas turbine plant with distillate results 25 Dry bulb temperature (°C) Relative humidity (%) 60 Ambient air pressure (mbar absolute) 1000 Unit performance CO2 emission factor (kgCO2/GJ fuel) 69.5 Gross power (MWe) 411 Net power (MWe) 404 Sent-out power (MWe) 403 Sent-out thermal efficiency (%, HHV) 54.0 Power station CO2 emission (kg/MWh SO) 465 Power station SO2 emission (kg/MWh SO) 0.03 Distillate feed rate (kg/hr) 58,770
F.3
References
CCSD – Technology Assessment Report 42: Technical Performance of Electric Power Generation Systems in Australian Conditions (Aug. 2004); E Ikeda, J Stubington, and C Spero. CCSD – New Plant Standards – Simulation of performance of electric power generation systems under Australian conditions (May 2005); E Ikeda, J Stubington, and C Spero. IEA Report CCC/74 – Clean Coal Technologies (October 2003); C Hendersen. IEA CCC/91 – Understanding coal-fired power plant cycles, October 2004, C Henderson. NRW, Concept Study – Reference Power Plant North Rhine-Westfalia, 2004. Power Clean Thematic Network – Fossil Fuel Power Generation State-of-the-art, July 2000.
Australian Greenhouse Office, Department of the Environment and Heritage
91
Technical Guidelines - Generator Efficiency Standards December 2006
APPENDIX G
GES GREENHOUSE INTENSITY CALCULATOR
The AGO advises that an electronic copy of the following GES Greenhouse Intensity Calculator is available from the GES website. Broadly, it calculates current performance GI and a best practice performance range for comparison. It requires the participant to input the following classes of data: • • • •
performance test results fuel properties fuel consumption electrical output.
Please note that the worksheet below has been truncated in order to fit on the following pages, by reducing the number of months of visible data from 12 to 6 months and by removing the performance test data input page.
Australian Greenhouse Office, Department of the Environment and Heritage
92
Technical Guidelines - Generator Efficiency Standards December 2006
Australian Greenhouse Office, Department of the Environment and Heritage
93
Technical Guidelines - Generator Efficiency Standards December 2006
Australian Greenhouse Office, Department of the Environment and Heritage
94


![recommended technical standards for generator licensing in south ... [PDF]](https://m.moam.info/img/260x300/recommended-technical-standards-for-generator-lice_64a1e010098a9ebf4f8b461b.jpg)