Genetic Algorithms and Support Vector Machines for Time Series Classification Damian Eads*a,b , Daniel Hillb , Sean Davisa , Simon Perkinsa , Junshui Maa , Reid Portera , and James Theilera a Nonproliferation
and International Security Division Los Alamos National Laboratory MS D436 Los Alamos, NM 87545
b Department
of Computer Science Rochester Institute of Technology 102 Lomb Memorial Drive Rochester, NY 14623
ABSTRACT We introduce an algorithm for classifying time series data. Since our initial application is for lightning data, we call the algorithm Zeus. Zeus is a hybrid algorithm that employs evolutionary computation for feature extraction, and a support vector machine for the final “backend” classification. Support vector machines have a reputation for classifying in high-dimensional spaces without overfitting, so the utility of reducing dimensionality with an intermediate feature selection step has been questioned. We address this question by testing Zeus on a lightning classification task using data acquired from the Fast On-orbit Recording of Transient Events (FORTE) satellite. Keywords: time series classification, genetic algorithm, genetic programming, support vector machines, feature selection, lightning, tornado, n-fold cross validation
1. INTRODUCTION In this paper, we address the task of creating classification algorithms for time series data. Machine learning techniques can be used to automatically derive such classifiers from sets of labeled sequences, but care must be taken to achieve adequate performance on the task without overfitting the training data. Overfitting occurs when the learning algorithm effectively “memorizes” the training data, and then performs poorly when applied to data not in the training set. Machine learning methods for classification can often be broken down into two steps: (a) selecting features, and (b) fitting a model which takes these features as input and provides a classification as output. We have developed a time series classification system which handles both these steps. The system is called Zeus, after the supreme ruler of Mount Olympus who controlled thunder, lightning, and rain. Feature selection is performed by generating random collections of signal processing algorithms that extract information from the time series concerned, and then refining these features using a form of evolutionary computation. The final model for classification is derived in the resulting feature space using a support vector machine (SVM), which allows some control of overfitting. The SVM is also used to derive fitness scores for different feature sets during the feature selection stage. A feature is a meaningful and distinguishing characteristic of a data sample used by a classifier to associate it with a particular data category. The process of selecting or extracting features involves mathematically manipulating the data sample, and producing hopefully a useful statistic. The process of selecting or extracting several features to form a feature set is known as feature selection or feature extraction. The manner in which Zeus selects features shall be the primary subject of this paper. In developing a classifier, often feature selection is used to prune irrelevant and noisy features as well as producing effective features. The selected feature set must be refined until the desired classification performance is achieved. Thus, manually developing a feature set can be a very time consuming and costly endeavor. An *Correspondence: Damian Eads – Email:
[email protected]; Telephone: 505-667-9227; Fax: 505-665-4414
alternative is to automate this process by having a genetic algorithm refine the feature selectors by means of evolution. Zeus produces feature sets that are composed of primitive signal processing and statistical algorithms. Such operators include integral approximation, smoothing, differentiation, sub-sampling, and convolution filtering. Each chromosome takes a time series record and derives a vector of features from it. We have tested Zeus on a lightning classification task using data acquired from the Fast On-orbit Recording of Transient Events (FORTE) satellite.
2. BACKGROUND The FORTE satellite detects transient electromagnetic events associated with lightning using a suite of optical and radio-frequency (RF) instruments. FORTE, along with satellites launched and operated by the National Aeronautics and Space Administration (NASA), is paving the way for a global, space-based lightning monitoring system. Of particular interest to such a system is the ability to identify different types of lightning in an automated fashion. Relative percentages of certain types of lightning have been shown to be a sensitive indicator of storm evolution, and have been correlated to the onset of severe weather conditions, including tornadoes. Previous work has established a technique for manually identifying lightning types using spectrograms and power density time series from FORTE Very High Frequency (VHF) data. However, due to the mass quantity of data collected by the FORTE VHF instrument (over 3 million events in it’s two-year lifetime), it is impractical for a human to manually identify lightning type for each event.1, 2 In addition to automating the lightning classification process, incorporating feature extraction and machine learning techniques may be used to overcome tight operational constraints of satellites. Such constraints include bandwidth limitations between ground stations and satellites as well as payload storage resource restrictions. If a classifier could be produced which performs well out-of-sample then the bandwidth and payload storage requirements can be reduced by uploading or storing a much smaller set of features. Before discussing how feature extraction and classification is performed, it may be helpful to explain how data is acquired from the satellite.
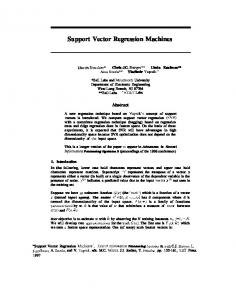
2.1. Acquisition The FORTE VHF instrumentation consists of 2 broadband receivers that can each be configured to cover a 22-MHz sub-band in the 30-300 MHz frequency range. Triggering occurs when at least 5 of 8 1-MHz wide subbands within the bandwidth exceed an amplitude threshold. Data is collected with a sample rate of 50 MHz for 800 microseconds. As shown in Figure 1, lightning events (A) which propagate through the ionosphere (B) trigger the FORTE VHF instruments. The data is then sent to a ground station (C) where scientists preprocess and produce power density profiles(D). These power density profiles are then sent to Zeus for training (E).
2.2. Preprocessing A Fourier transform is performed on the input data to produce a spectrogram. The spectrograms are then collapsed in frequency to produce a power density time series, with 3181 samples in each time series. These time series represent individual training points within the Zeus system. Zeus uses genetic programming to evolve chromosomes that transform the raw time series feature vector into one that is considerably smaller, typically with only 10 or so elements.
2.3. Categories of Lightning Zeus classifies the power densities into seven different categories of lightning. These categories have several different distinguishing physical characteristics. The next table lists each class label name used for storage in our database, a descriptive name associated with the label, as well as a brief explanation of the physical characteristics of the event. A total of 143 samples currently exist in the database.
C
GROUND STATION D
FORTE Satellite PREPROCESSING B A E
Image of Earth Courtesy of NASA
ZEUS CLASSIFIER GENERATOR Earth
Figure 1. Illustrates the Acquisition of Lightning Data to be Used for Classification.
Label: CG
Name: Positive Initial Return Stroke
IR
Negative Initial Return Stroke
SR
Subsequent Negative Return Stroke
I
Impulsive Event
I2
Impulsive Event Pair
KM O
Gradual Intra-Cloud Stroke Off-record
Description: A positive charge is lowered from a cloud to the ground. The characteristic feature of this type of event in the power density time series is a sharp turn-on of radiation, followed by a few hundreds of microseconds of noise. A negative charge is lowered from a cloud to ground. The power waveform slowly ramps up to a level known as an attachment point, where a large surge current causes the VHF power to ’spike’. This attachment is followed by an exponentially shaped decline in the waveform. A negative charge is lowered from a cloud to ground. As the name implies, subsequent return strokes come after initial return strokes. Note that subsequent positive return strokes don’t exist. Typically an intra-cloud event characterized by a sudden peak in the waveform. Another intra-cloud event characterized by sudden peaks in the waveform that come in closely separated pairs. These are also called TIPPs (Trans-Ionospheric Pulse Pairs). An intra-cloud event which increases in power more gradually than an impulsive event. As the name implies, 800 microseconds was not enough to fully capture the lightning event.
Three sample power density profiles for each of the classes listed in the table are shown in Figure 2. Most lightning events that FORTE detects can be classified by visually examining these power density profiles. However, an individual training record is not necessarily representative of its class. Notice the wide variation between records of the same class. For example, the first CG record bears little resemblance to the third CG record. Also note the similarity of records from different classes. The I and I2 classes in particular are very similar. This wide intra-class variation as well as interclass similarities in the samples cause difficulty in producing a good classifier. Before discussing the experiments we performed and the results we obtained, it is necessary to introduce some basic background so the motivation behind our technique is clear.
CG
I
I2
KM
IR
SR
O
Figure 2. Three examples of power densities are shown for each class. Note the wide intra-class variation and interclass similarity.
2.4. Classifier Generator The automatic generation of classifiers is a cost effective alternative to manually developing them by hand. Zeus was inspired by the AFREET5 and GENIE3–7 projects which generate pixel classifiers for multispectral imagery. Both of these systems use a stochastic search technique (such as GP/hill-climbing) to derive feature sets, together a backend classifier to combine those features into an answer. GENIE evolves image processing algorithms for feature extraction by means of genetic programming. Each primitive operator outputs its result onto a feature (or “scratch plane”). These scratch planes are represented by matrices, and a Fisher Discriminant or Maximum Likelihood Classifier is used for classification. In contrast, AFREET employs hill-climbing techniques to generate feature extraction algorithms and uses a support vector machine to derive models for classification. Zeus has a similar front-end/back-end architecture to GENIE and AFREET, and uses genetic programming and support vector machines to generate time series classifiers rather than pixel classifiers.
2.5. Feature Selection and Support Vector Machines According to Duda and Hart, a common problem in pattern recognition is Bellman’s “curse of dimensionality”, which states that the difficulty of a learning problem increases exponentially with dimension. 8 It has been a common practice to use dimensionality reduction to alleviate this problem.8, 9 SVMs use a different technique, based on margin maximization, to cope with high dimensional problems. Empirically, they have been shown to to work in high dimensional spaces with remarkable performance. In fact, rather than reducing dimensionality as suggested by Duda and Hart, an SVM increases the dimension of the feature space. Without delving into too much detail, the SVM computes a simple linear classifier, after mapping the original problem into a much higher dimension space using a non-linear kernel function. 9, 10 In order to control overfitting in this extremely high-dimensional space, the SVM attempts to maximize the margin,
which is characterized by the distance between the nearest training point and the separating discriminant. 9–11 Refer to Cristianini,9 Burgess,11 or Vapnik12 for more information on support vector machines. 2.5.1. Purpose of Feature Selection The question arises, that if SVMs can handle such large dimensions, why select or prune features? Does feature selection do anything that the SVM can’t do by itself? This question has been the recent subject of numerous papers. Barzilay and Brailovsky10 demonstrated an improvement in performance when feature selection was employed on a texture recognition problem. Cao and Tay13 used saliency analysis before training SVM on a financial time series forecasting problem to improve performance. Abrahart, et al 14 defines “saliency analysis” in the context of neural networks as the “disaggregation of a neural network solution in terms of its forecasting inputs.” Interestingly, Cao and Tay15 compared the use of a saliency analysis and genetic algorithms to prune features. Specifically, they defined the feature subsets using a bit-string where a 1 indicates that a feature is kept and a 0 means the feature is eliminated. The result of their experiment was that feature selection was “insensitive to kernel function selection.” These recent results demonstrate to us that the problem of selecting features before training an SVM deserves more investigation. 2.5.2. Tree-based Feature Extraction and SVMs As stated earlier, AFREET uses a hill climbing stochastic search technique to generate feature selectors for remote sensing imagery. It creates a random population of image processing algorithms for feature extraction. These algorithms are composed of primitive image processing operators which include convolution filtering, gaussian smoothing, and morphological operations such as dilation and erosion. The hill climbing algorithm keeps only sensible, fitness improving, and meaningful mutations to the tree. GENIE, in contrast, uses genetic programming, in place of hill climbing.
2.6. Genetic Programming In this project, the feature selection method we are primarily investigating is genetic programming. GP is a form of evolutionary algorithm, where the individuals being evolved are computer programs. In functional programming languages such as LISP, an entire program can be represented as a single expression containing nested function calls. Since expressions can be represented as trees ordered by operator precedence, most GP systems (including ours) evolve programs using a tree representation. This implies that special generation, mutation, and crossover methods are required. A few of these are discussed below in the description of our algorithm. Genetic programming was first formally introduced by Koza17 ; see also Banzhaf16 for more information on genetic programming. Applying GP to feature selection actually requires that several programs are evolved. Each program defines some feature that is extracted from the input time series. Note that this differs from GA methods that perform feature subset selection since Zeus creates the features that will be used for classification, rather than just reducing a pre-existing set to an essential subset.
3. ALGORITHM The overall structure of Zeus consists of two layers: a genetic algorithm and a support vector machine.
3.1. Evolutionary Algorithm The objective of the GP system is to produce feature extraction algorithms which derive meaningful features from sample time series. Zeus uses a fairly standard evolutionary approach. An initial population of chromosomes is generated randomly, as described below. Then the population is evolved for a number of generations. In each generation, each chromosome is used to generate a set of features, which are then evaluated as described in §3.6. The evaluation process associates a fitness score with each chromosome. Fit chromosomes are then selected from the population and recombined to produce a new population of chromosomes, of the same size as the original
A
TIME SERIES RECORD
series input
INPUT ONE TIME SERIES (3181 FEATURES) CHROMOSOME GENE
B
RUN ALGORITHMS(GENES) ON TIME SERIES
scalar output
x1
y
x2
x3
x4
x5
x6
x7
x8
C
PRODUCE FEATURE VECTOR (8-10 FEATURES)
FEATURE VECTOR SET
D
NOTE: STEPS A-C ARE REPEATED ON A SINGLE CHROMOSOME UNTIL ALL TIME SERIES HAVE BEEN PROCESSED
PRODUCE FEATURE VECTOR SET PARTITIONS
Figure 3. Zeus Chromosome
population. In addition, the best individual from the previous generation is copied over unchanged to the new population. This procedure is known as elitism. Chromosomes are selected in pairs, and are called “parents”. The first parent is picked randomly, while the second parent is chosen using a 2-tournament. In this tournament, two chromosomes are selected at random, and the fittest of those two chromosomes becomes the second parent. We ensure that the randomly chosen parent and the tournament members are all different. The process by which “offspring” are derived from parents is described in §3.7. The evolutionary algorithm continues until a pre-specified number of generations have passed.
3.2. Chromosome Representation A visual depiction of the chromosome within the Zeus system is given in Figure 3. The chromosome is a fixedlength list of genes, each of which is represented as a processing tree. The i’th tree in the chromosome describes an individual feature extraction algorithm that outputs a scalar which gets placed in the i’th component of a feature vector. These algorithms together comprise a feature extractor, a program which accepts a time series and outputs a vector of features.
3.3. Primitive Operators Zeus contains about twenty primitive operators which comprise the tree-based genes. These operators may be conceptually divided into three categories: preprocessing, statistical, and arithmetic. Preprocessing operators accept series as input as well as scalar arguments. They perform processing on the series and return the result as a series. Name Convolution
ID gs
Derivative Normalization Sub Series
drv norm chunk
Linear Combination
lcomb
Description Convolution filtering is used to reduce noise by smoothing the power density. Computes the change in power with respect to time. Normalizes the series. The time series is cropped or sub-sampled. This is useful in generating statistics on only a portion of the time series. The linear combination operator adds two time series together.
Statistical operators accept a series as input and scalar arguments and return a single scalar value. Name Mean Standard Deviation Variance Skewness
ID mean stddev
Description Computes the average value in a time series. Computes the standard deviation of the time series.
var skew
Kurtosis
kurt
Integral Sum Maximum Minimum Ratio of Means
int-t sum max min ratio-3
Computes the variance of the time series. Computes the skewness or asymmetry (specifically the third moment) of the distribution of values in the time series. Computes the kurtosis or the peakedness (fourth moment) of the values in the time series. Computes the total power of the strike between two points in time. Sum of the values in the time series. Maximum value in the time series. Minimum value in the time series. The ratio of means operator simply computes the mean of various portions of the signal and returns the ratio between them.
Arithmetic operators accept only scalars as input and return a scalar value. Name Add, Subtract, Multiply, Divide
ID +, -, *, /
Description Computes the addition, difference, multiplication, or division of two scalars.
3.4. Generating Populations Each gene of each chromosome is represented as a tree whose nodes and terminals are taken from the set of primitive operators in the above table. Each operator has its own constraints as far as values returned and arguments accepted, and in order to generate a valid tree, these constraints must be met. In our system, every feature selector returns a scalar value, so we start building a tree by selecting a random operator that returns a scalar. Then, based on the types of the arguments this function takes (either scalars or series data), we place an appropriate operator or terminal as its child (or children). A terminal is simply a leaf node on the tree that must either be the series data or a random scalar value. Whether or not we decide that the current node should be a terminal or not is determined by a predefined probability, which we set to 0.8. This process is continued until there are no more non-terminal leaf nodes.
3.5. Example of Feature Extractor Figure 4 is an example of an algorithm produced by Zeus, and is displayed using LISP syntax. The first feature takes the average of the first 266 microseconds of the VHF waveform and divides it by the average of the last 266 microseconds. The second feature involves sub-sampling the signal from 264 microseconds to 400 microseconds, smoothing that region with a Gaussian kernel of width 15, and computing the skewness of the resulting power density. (define-feature-selector ’((ratio-3 s1 ’( 0)) (skew (gs (chunk s1 ’(0.33 0.5)) ’(15))) (int-t s1 ’(0.73 0.98)) (sum s1) (kurt s1) (kurt (drv (lcomb s1 (drv s1)))) (skew s1) (max (drv (gs s1))) (/ (int-t s1) (sum (drv s1))) (ratio-3 s1 ’( 4)))) Figure 4. An example Zeus algorithm for generating ten features.
3.6. Chromosome Evaluation Figure 3 also illustrates the manner in which each Zeus chromosome is evaluated. The set of time series records are sent to the chromosome’s input (A), the feature extraction algorithm is executed (B) and a feature vector v i is produced (C). These steps are repeated on every time series record and a set S of feature vectors is formed. The set of feature vectors is then used to derive an SVM classifier which maps feature vectors onto category labels. Zeus makes use of the libsvm learning engine,18 using an RBF kernel, a C value of 5000, and otherwise the default libsvm parameters. Once we have the SVM classifier, we can use it to measure the classification rate on our training set. This classification rate is what gets used as a fitness score. Two different methods for assessing classification rate are available in Zeus: (a) in-sample classification rate, and (b) cross-validation classification rate. 3.6.1. In-Sample Classification Rate The in-sample classification rate is the simplest fitness criterion. We simply take the derived SVM classifier, and then measure its performance on the the full set of training data that was used to derive it. The in-sample fitness has the advantage of being simple and fast to compute. In-sample classification rate is probably the most common fitness criterion used in GAs for classification. Specifically, the in-sample fitness F1 is given by:
F1 =
L 1 X Mi ri M i=1
(1)
where L is the number of classes, ri is the classification rate for a particular class index i, M is the total number of samples, Mi is the number of samples in class i. 3.6.2. Cross-Validation Classification Rate The in-sample fitness is easy to compute, but has the problem that it is susceptible to overfitting. With a sufficiently flexible SVM, we can derive a classifier that produces close to 100% performance on training data, but that does not generalize well to unseen data. One way of dealing with this problem is to use a cross-validation technique. Equally sized partitions T1 , . . . , TN of S are created (D). N different SVMs are then trained with the complement Ti of each partition, and each is then tested on the corresponding unseen partition Ti . The classification rate is calculated for each of the testing partitions, and then the final cross-validation classification rate is simply the average of all these individual classification rates. The cross-validation fitness F2 is given by:
F2 =
N 1 X C(Ti , Ti ) N i=1
(2)
where C(Ti , Ti ) is the classification rate of Ti using the model derived by training on Ti . Within Zeus, this statistic is expensive to compute as a total of N support vector machines must be trained for each fitness evaluation. The cross-validation technique is used to assess the fitness of each chromosome. However, at each generation, we also take the best individual and train it on all the training data available to provide an in-sample fitness measure for comparison. This classifier is also the one returned from the final generation of Zeus.
3.7. Recombination To derive a new population from an old one at each generation, pairs of parents are selected in the manner described above. Each pair of parents gives rise to one offspring via a process called recombination. Recombination itself consists of two separate processes: crossover and mutation. 3.7.1. Crossover Zeus provides several alternative crossover operators that combine two parent chromosomes A and B together to produce a single offspring C: Uniform Crossover The genes at each position in the chromosome C are chosen with equal probability from the corresponding genes in either A or B. The genes themselves are simply copied and are not modified in any way. Tree Crossover The trees at each position in chromosome C are formed by standard GP-style subtree crossover between the trees at the corresponding locations in A and B. Single-Point Crossover A cut-point is selected at a random location along the chromosome. The genes to the left of the cut-point are copied from either A or B (with equal probability) into C, while the genes to the right of the cut-point are copied from the other parent. In the experiments reported below, only single-point crossover was used. Short experiments with different crossover schemes suggested that single-point was the best performer. 3.7.2. Mutation After crossover, the offspring is subject to mutation, with probability pm . If an offspring is mutated it undergoes either “hoist” mutation or gene randomization with equal probability. Algorithm randomization involves completely randomizing a randomly selected gene of the mutant. Hoisting involves selecting a feature extraction algorithm from the mutant chromosome, selecting a random node from the algorithm’s tree, and replacing it by one of the node’s descendents. This is less destructive than the algorithm randomization because at least part of the algorithm is preserved.
3.8. Implementation Details Zeus was written in the C++ programming language and made use of the libsvm support vector machine library. See Chang and Lin18 for more information on libsvm. Experiments were performed using Intel processor-based workstations running the Red Hat Linux Operating System.
4. RESULTS A number of experiments were performed to compare the performance of different variants of Zeus, with the performance of a raw SVM with no feature selection.
4.1. Performance Assessment Ten-fold cross-validation was used to assess the performance of the different algorithms in all the following experiments. In this scheme, the lightning training data set was divided into ten equal randomly-chosen partitions. Each algorithm was applied ten times to the ten different choices of nine partitions, and tested on the remaining unseen partition. The cross-validation score is then simply the average of the classification rates over all partitions. This “outer-layer” of cross-validation should not be confused with the “inner-layer” of cross-validation employed when cross-validation classification rate is used as a fitness measure. During performance assessment, we will withhold 10% of the training data, and pass the other 90% to the algorithm being tested. If that algorithm itself employs ten-fold cross-validation classification rate as a fitness measure, it will then partition the data it
is given into ten partitions, and train ten different SVMs on different 90% partitions of the training data it sees. Since the algorithm is only being allowed to see 90% of the total training set, then each of those inner training sets contain only 81% of the whole training set. Note, however, that when the algorithm has selected the fittest feature extractor chromosome using the inner cross-validation layer, it then trains an SVM using that feature extractor on all the training data it sees, i.e. 90% of the complete training data set.
4.2. Experiment 1: Zeus with In-Sample Classification Rate Used for Fitness Zeus was applied to the lightning problem, using a GP population size of 15, running for 50 generations, a mutation rate pm of 0.3, single-point crossover, and all other parameters as described in §3. The results are displayed below as a confusion matrix for the seven classes in the lightning classification problem. Each cell of the matrix shows the cross-validation score correct classification rate of the class corresponding to the label of the column when the row is the actual label. A perfect classifier would have 100% values along the diagonal of the matrix, and zeros everywhere else. The confusion matrix allows us to see which classes were most often confused with other classes. A weighted average of the diagonal, where the weights correspond to the fraction of training points that belong to each class, gives the total cross-validation classification rate across all classes.
CG IR SR I I2 KM O
CG 61.11 0 35.29 0 0 13.16 4.55
IR 0 64.29 0 10.52 6.67 7.89 4.55
SR 16.67 0 47.06 0 0 2.63 0
I 0 7.14 0 63.16 33.33 0 0
I2 5.55 21.43 5.89 26.32 53.33 2.64 0
KM 16.67 7.14 11.76 0 6.67 63.16 22.74
O 0 0 0 0 0 10.52 68.18
Zeus achieved a total cross-validation classification rate of 60.84%, and an in-sample classification rate of 100%.
4.3. Experiment 2: Zeus with Cross-Validation Classification Rate Used for Fitness The same GA and SVM parameters are used as in the previous experiment, except that the inner ten-fold cross validation score is used to measure fitness. The confusion matrix for this run is shown below.
CG IR SR I I2 KM O
CG 55.56 0 11.76 0 0 10.53 4.55
IR 5.56 64.29 0 10.53 0 2.63 0
SR 11.11 0 52.94 0 0 0 0
I 0 7.14 5.88 68.42 40 0 0
I2 5.55 7.14 11.76 21.05 46.67 2.63 0
KM 22.22 14.29 17.66 0 13.33 73.68 40.90
O 0 7.14 0 0 0 10.53 54.55
4.4. Experiment 3: Comparison with Raw SVM Suppose the Zeus feature selection scheme is not used. How does the support vector machine fare? To answer this question we used the OSU MATLAB toolbox on the raw time series data.∗ A polynomial kernel of degree 13 was used and 10-fold cross validation was used to assess performance as in the previous two experiments. The resulting confusion matrix from the experiment is shown below. ∗
This toolbox wraps a Matlab interface around libsvm.
CG IR SR I I2 KM O
CG 75 0 20 5 5 3.3 0
IR 0 85 0 5 0 2.5 0
SR 10 0 35 5 0 8.3 0
I 0 10 5 70 30 0 5
I2 0 0 5 10 50 0 0
KM 10 0 35 5 0 78.4 10
O 5 5 0 0 15 7.5 85
The raw SVM yielded a perfect in-sample result with a ten-fold cross validation score of 70.38%. Although it had higher classification rates for most of the classes, the Zeus algorithm had a 17.94% higher classification rate for subsequent return (SR) stroke lightning events.
4.5. Overall Results The following table summarizes the results from the three experiments and compares the out-of-sample performance (as measured by cross-validation) and in-sample performance for each algorithm. Exp. 1 2 3
Cross Validation Score 60.83 61.54 70.38
In-sample 100.00 96.09 100.00
Fitness In-Sample 10-fold CV N/A
w/Zeus Yes Yes No
# of Features 10 10 3181
5. CONCLUSIONS AND FUTURE WORK The Zeus system in this case did not outperform the direct SVM system. Some possible reasons for this include the fact that the raw SVM result of experiment 3 was obtained after careful testing and selection of the kernel parameters and error penalty C. This was not done with Zeus. The use of the cross-validation fitness measure in Zeus produced a marginally better final result compared to the in-sample fitness measure, although the difference was not large. In related work, AFREET5 is an example of an algorithm that combines a stochastic search for a good feature set, with an SVM backend. AFREET has obtained good performance on image classification problems, and we hope that in the future, some modification of Zeus will yield similarly good results for time-series classification. Apart from exploring different parameters for Zeus, we also intend to increase the number and variety of primitive operators so that Zeus may evolve more sophisticated, meaningful, and effective feature extractors. Further experiments will be performed to see whether Zeus is insensitive to the selection of a kernel as demonstrated by Cao and Tay.13, 15 A final observation is that even if Zeus cannot provide better performance than a raw SVM, it may provide some advantages in terms of feature reduction. If it can achieve similar performance with only 10 features, as opposed to 3181, then this could be useful for transmitting FORTE data over bandwidth limited channels, commonplace in satellite work. Experimental work is in progress to test Zeus on a less difficult binary classification problem to examine whether it can distinguish between the cloud-to-ground events (i.e. CG, IR, SR) and the intra-cloud events (i.e. I, I2, KM). Preliminary experiments with Zeus yielded a 10-fold cross validation score of 85.12%. We plan on performing a comparison between a raw SVM and Zeus on this two-class subproblem.
ACKNOWLEDGMENTS This work was conducted at Los Alamos National Laboratory, and supported by funding from the Real World Machine Learning (RWML) project, as part of Laboratory Directed Research and Development Directed Research (LDRD/DR) program, as well as by funding from various government agencies. Special thanks to the Intelligent Searching of Images and Signals (ISIS) project team as well as the FORTE team leader Abe Jacobson for without their support this work would not be possible.
REFERENCES 1. S. Briles, K. Moore, R. Jones, P. Blain, P. Klinger, D. Neagley, M. Caffrey, K. Henneke, and W. Spurgen, Innovative Use of DSP Technology in Space: FORTE Event Classifier, Proceedings of the International Workshop on Artificial Intelligence in Solar-Terrestrial Physics, 1993. 2. K. Moore, P.C. Blain, S.D. Briles, and R.G. Jones, Classification of RF transients in space using digital signal processing and neural network techniques, Proc. SPIE 2492, 1997. 3. S.P. Brumby, N.R. Harvey, S. Perkins, R.B. Porter, J.J. Szymanski, J. Theiler, and J.J. Bloch, A genetic algorithm for combining new and existing image processing tools for multispectral imagery, Proc. SPIE 4049, 2000. 4. N.R. Harvey, J. Theiler, S.P. Brumby, S. Perkins, J.J. Szymanski, J.J. Bloch, R.B. Porter, M. Galassi, and A.C. Young, Comparison of GENIE and Conventional Superviced Classifiers for Multispectral Image Feature Extraction, IEEE. Transactions on Geoscience and Remote Sensing, 40 (2002) 393-404. 5. S. Perkins, N.R. Harvey, S.P. Brumby and K. Lacker, Support Vector Machines for Broad Area Feature Extraction in Remotely Sensed Images, Proc. SPIE 4381, 2001. 6. J.P. Szymanski, S.P. Brumby, P. Pope, D.R. Eads, D. Esch-Mosher, M. Galassi, N.R. Harvey, H.D.W. McCulloch, S.J. Perkins, R. Porter, J. Theiler, A.C. Young, J.J. Bloch, and N. David, Feature Extraction from Multiple Data Sources using Genetic Programming, Proc. SPIE 4725, 2002. 7. J. Theiler, N.R. Harvey, S.P. Brumby, J.J. Szymanski, S. Alferink, S. Perkins, R. Porter, and J.J. Bloch, Evolving Retrieval Algorithms with a Genetic Programming Scheme, Proc. SPIE 3753, pp. 416-425, 1999. 8. Duda, Richard and Peter Hart, Pattern Classification and Scene Analysis, John Wiley and Sons, New York, NY, 1973. 9. Nello Cristianini, An Introduction to Support Vector Machines, Cambridge University Press, 2000. 10. O. Barzilay and V.L. Brailovsky, On domain knowledge and feature selection using a support vector machines, Pattern Recognition Letters, Volume 20, Number 5, pp. 475-484, May 1999. 11. C. Burgess, A Tutorial on Support Vector Machines for Pattern Recognition, Data Mining and Knowledge Discovery, Volume 2, Number 2, pp. 121-167, 1998. 12. V.N. Vapnik, The nature of statistical learning theory, Springer-Verlag, New York, 1995. 13. L.J. Cao and F.E. Tay, Feature selection for support vector machines in financial time series forecasting, Intelligent Data Engineering and Automated Learning: Data Mining, Financial Engineering, and Intelligent Agents, Second International Conference Proceedings, Springer-Verlag, December, 2000. 14. R. J. Abrahart, Linda See, and P. E. Kneale, Applying Saliency Analysis to Neural Network Rainfall Runoff Modelling, GeoComputation 99, http://www.geovista.psu.edu/sites/geocomp99/Gc99/003/gc 003.htm, 1999. 15. E.H. Tay, and L.J. Cao, A comparative study of saliency analysis and genetic algorithm for feature selection in support vector machines, Intelligent Data Analysis, 2001, Volume 5, Number 3, pp. 191-209. 16. W. Banzhaf, Genetic Programming: An introduction on the automatic evolution of computer programs and its applications, Morgan Kaufmann Publishers, San Francisco, 1998. 17. J.R. Koza, Genetic Programming: On the Programming of Computers by Means of Natural Selection, MIT Press, Cambridge, MA, 1992. 18. C.C. Chang and C.J. Lin, LIBSVM: a Library for Support Vector Machines (Version 2.33), http://www.csie.ntu.edu.tw/~cjlin/libsvm/, 2002.