Genetic Diversity and Distribution Patterns of Host Insects of Caterpillar Fungus Ophiocordyceps sinensis in the Qinghai-Tibet Plateau Qing-Mei Quan1, Ling-Ling Chen1, Xi Wang1, Shan Li1, Xiao-Ling Yang1, Yun-Guo Zhu1, Mu Wang2, Zhou Cheng1* 1 School of Life Science and Technology, Tongji University, Shanghai, China, 2 School of Plant Sciences and Technology, Agriculture and Animal Husbandry College of Tibet, Nyingchi, Tibet, China
Abstract The caterpillar fungus Ophiocordyceps sinensis is one of the most valuable medicinal fungi in the world, and it requires host insects in family Hepialidae (Lepidoptera) to complete its life cycle. However, the genetic diversity and phylogeographic structures of the host insects remain to be explored. We analyzed the genetic diversity and temporal and spatial distribution patterns of genetic variation of the host insects throughout the O. sinensis distribution. Abundant haplotype and nucleotide diversity mainly existed in the areas of Nyingchi, ShangriLa, and around the edge of the Qinghai-Tibet Plateau, where are considered as the diversity center or micro-refuges of the host insects of O. sinensis. However, there was little genetic variation among host insects from 72.1% of all populations, indicating that the host species composition might be relatively simple in large-scale O. sinensis populations. All host insects are monophyletic except for those from four O. sinensis populations around Qinghai Lake. Significant phylogeographic structure (NST.GST, P,0.05) was revealed for the monophyletic host insects, and the three major phylogenetic groups corresponded with specific geographical areas. The divergence of most host insects was estimated to have occurred at ca. 3.7 Ma, shortly before the rapid uplift of the QTP. The geographical distribution and star-like network of the haplotypes implied that most host insects were derived from the relicts of a once-widespread host that subsequently became fragmented. Neutrality tests, mismatch distribution analysis, and expansion time estimation confirmed that most host insects presented recent demographic expansions that began ca. 0.118 Ma in the late Pleistocene. Therefore, the genetic diversity and distribution of the present-day insects should be attributed to effects of the Qinghai-Tibet Plateau uplift and glacial advance/retreat cycles during the Quaternary ice age. These results provide valuable information to guide the protection and sustainable use of these host insects as well as O. sinensis. Citation: Quan Q-M, Chen L-L, Wang X, Li S, Yang X-L, et al. (2014) Genetic Diversity and Distribution Patterns of Host Insects of Caterpillar Fungus Ophiocordyceps sinensis in the Qinghai-Tibet Plateau. PLoS ONE 9(3): e92293. doi:10.1371/journal.pone.0092293 Editor: Dee A. Carter, University of Sydney, Australia Received May 2, 2013; Accepted February 20, 2014; Published March 25, 2014 Copyright: ß 2014 Quan et al. This is an open-access article distributed under the terms of the Creative Commons Attribution License, which permits unrestricted use, distribution, and reproduction in any medium, provided the original author and source are credited. Funding: This work was supported by National Natural Science Foundation of China (31270068) (http://www.nsfc.gov.cn/Portal0/default152.htm). The funders had no role in study design, data collection and analysis, decision to publish, or preparation of the manuscript. Competing Interests: The authors have declared that no competing interests exist. * E-mail:
[email protected]
specific host insects are also potentially endangered [10]. However, inducing fruiting bodies of O. sinensis by artificial inoculation of Hepialus larvae is still extremely challenging. Therefore, there exists an urgent need to establish appropriate strategies/policies to protect the endangered O. sinensis and its host insects. Understanding the genetic diversity and phylogeographic structure of the host insects will provide important information for their conservation, as well as that of O. sinensis. Previous studies have focused mainly on the morphology, ecology, and life history of this interaction and reported that the host insects of O. sinensis are diverse and complex [6,11–14]. Fifty-seven species representing seven genera (Hepialus, Thitarodes, Pharmacis, Magnificus, Gazoryctra, Endoclita, and Bipectilus) were considered to be possible hosts of O. sinensis [6]. Additionally, the most recent revision of the genus Hepialus, which has been adopted in China, divides the group into four genera (Parahepialus gen. nov., Ahamus gen. nov., Hepialus, and Thitarodes) [15]. Until now, few studies on the genetic relationships, population structure, and geographical distribution
Introduction Ophiocordyceps sinensis (Berk.) Sung, Sung, Hywel-Jones and Spatafora (Ascomycota: Ophiocordycipitaceae), a caterpillar fungus [1], has been used for centuries as a traditional Chinese medicine to treat asthma, bronchial/lung infection, and kidney disease [2–4]. The host insects of O. sinensis belong to the family Hepialidae [5]. The fungus infects their larvae and forms sclerotia within the insect’s intact exoskeleton, enabling the fungus to withstand the winter [6]. In spring and early summer, using the host insect for nutrition, the fungal fruiting body grows from the head of the dead larva and emerges from the soil surface [7]. Therefore, the host insect is essential to the life cycle of O. sinensis. Ophiocordyceps sinensis and its host insects are endemic to the Qinghai-Tibet Plateau (QTP) in western China, i.e., Qinghai, Tibet, Yunnan, Sichuan, and Gansu provinces, where they are mainly distributed in alpine meadows [8,9]. This fungus is becoming endangered through both overexploitation because of its commercial value, and habitat degeneration in recent years. Its PLOS ONE | www.plosone.org
1
March 2014 | Volume 9 | Issue 3 | e92293
Genetic Diversity & Distribution of Host Insects
of the host insects have been reported, which significantly hinders the sustainable use and conservation of O. sinensis and its host. The landscape features and climate patterns of southwest and northwest China were largely re-shaped by the uplift of the QTP [16,17]. Many reports suggested that the unique complex topography and climate changes resulting from this rapid uplift explain the genetic divergence and speciation of some plants in the region [18–20]. The alternation of glacial and interglacial periods during the Quaternary also resulted in some species ranges retreating and expanding in the QTP [21,22]. Additionally, insects are excellent indicators of endemism, as gene flow can be nearly completely interrupted by even weak habitat barriers in many species [23]. The host insects of O. sinensis show complex vertical and regional distribution patterns in the QTP [11,13]. Different host species usually occupy different mountain ranges or even different sides and/or altitudes of the same mountain [11]. Phylogenetic analyses of mitochondrial Cytb sequences from those host insects demonstrated that there exist many species with different geographical distributions [24]. Therefore, the distribution and species complexity of host insects may also have been influenced by the geological events and climatic shifts of the QTP. However, the distribution patterns and evolutionary histories of the host insects are still not clear. The objectives of this study were to (i) analyze the genetic diversity and phylogeographic structure of the host insects using mitochondrial cytochrome oxidase subunit I (COI) sequences in large-scale O. sinensis populations covering the entire QTP; (ii) explore temporal and spatial distribution patterns of genetic variation in the host insects; (iii) infer what caused the spatial distribution pattern by estimating differentiation times and analyzing historical events in the QTP; and (iv) estimate possible historical population expansions and the evolutionary history of the host insects. Understanding the center of genetic diversity and possible causes of the current distribution patterns of these insects could provide valuable information to protect and sustainably use this host insect-O. sinensis system.
analysis of COI+COII+Cytb is also more representative of the phylogenetic relationships and geographical distribution patterns of host insects from different O. sinensis populations [25]. The host insect COI sequences of all 400 samples were sequenced. PCR were performed using the primers and protocols described by Hebert et al. [26]. Purification and sequencing were conducted by Shanghai GeneCore Biotechnologies Company, Shanghai, China.
Molecular diversity COI sequences were aligned using Mega 5.2 [27]. Molecular diversity indices, including the number of haplotypes (Nh), haplotype frequencies, number of private haplotypes (NpH), haplotype diversity (Hd), and nucleotide diversity (Pi), were calculated using DnaSP version 5.1 [28] for each population.
Phylogenetic analysis and haplotype network Haplotype phylogenetic relationships were reconstructed using three optimality criteria: Bayesian inference (BI), maximum likelihood (ML) and Neighbour-Joining (NJ). MrModel test2 v.2.3 [29] in conjunction with PAUP 4.0b10 [30] was used to select the best model for the BI and ML analyses. BI and ML analyses implemented the GTR+I+G model for each data partition. BI analysis with Markov chain Monte Carlo (MCMC) method was conducted in MRBAYES 3.1.2 [31], the Markov chains were run for 10 000 000 generations with trees being sampled every 100 generations. The first 25 000 generations were discarded as burn-in, and the remaining trees were used to estimate Bayesian posterior probabilities. ML analysis was conducted using PhyML 3.0 [32]. NJ analysis was implemented using Mega 5.2 [27], the bootstrap values for the interior nodes in the NJ tree were performed with 1000 replicates. The COI sequences of four Hepialidae species, Ahamus yushuensis (HM595854, HM595849, HM595840 and HM595850), Hepialus menyuanicus (HM595858), Thitarodes renzhiensis (HM744694) and Thitarodes armoricanus (HM595856) obtained from GenBank were used to evaluate the possible species of the host insects of O. sinensis in this study. Papilio spp. (JQ606303) was selected as an outgroup taxon to root the phylogenetic trees. Genealogical relationships among the observed haplotypes in each defined group were examined using Network 4.6 [33]. These defined groups in the phylogenetic trees were detected whether they belong to monophyly using the species delimitation plugin [34] for Geneious Pro v4.8.4 [35].
Methods Ethics statement No special permits were required for locations and samplings in this study. All samples were collected by researchers with introduction letters of IBAT (Institute of Bioresources and Applied Technology), Tongji University. The collection was completed with the help of local herdsman.
Analysis of genetic differentiation and phylogeographic structure
Sampling
Phylogeographic structure was tested by calculating two measures of genetic differentiation: GST and NST [36,37]. GST considers only haplotype frequencies while NST also takes into account differences among haplotypes. A higher NST than GST usually indicates the presence of phylogeographic structure [36,37]. Therefore, the two parameters were compared using a permutation test with 1000 permutations and the U-statistic as implemented in PERMUT (available at http://www.pierroton. inra.fr/genetics/labo/Software/Permut). Analysis of molecular variance (AMOVA) was performed to distinguish variation within and among populations using Arlequin 3.11 [38], with significance tested via 1000 nonparametric permutations. These analyses were calculated for the monophyletic host insects and also for its each genetic group individually.
A total of 400 samples from 43 O. sinensis populations, including 18 from Qinghai Province, 19 from Tibet, two from Gansu, two from Sichuan, and two from Yunnan, covered almost the entire distribution range in western China (Fig. 1; Table S1). These samples were complexes of O. sinensis stroma and host cadaver. In each population, we collected 5–30 samples that were at least 100 m apart. Collected specimens were preserved in the Herbarium of IBAT (Institute of Bioresources and Applied Technology), Tongji University, Shanghai, China. The codes, locations, and sample numbers of O. sinensis populations are shown in Table S1.
DNA extraction, amplification, and sequencing Total DNA was extracted from the heads of host cadaver using the CTAB method described previously [24]. The mitochondrial COI sequence is not only more reliable than either cytochrome oxidase subunit II (COII) or cytochrome b (Cytb), but in combined PLOS ONE | www.plosone.org
2
March 2014 | Volume 9 | Issue 3 | e92293
Genetic Diversity & Distribution of Host Insects
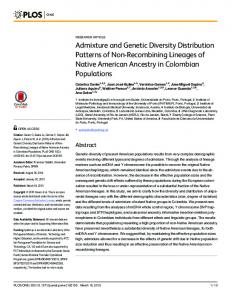
Figure 1. Geographical distribution and haplotype frequencies of host insects from 43 O. sinensis populations in the QTP. Population codes correspond to those in Table S1. Haplotype frequencies in each population are shown in the pie charts. The haplotypes existed in more than one population are color-coded, while private haplotypes are always shown by white circles. doi:10.1371/journal.pone.0092293.g001
Expansion time was estimated using the expectation t = 2ut [45], where tau (t) is the age of expansion in mutational units derived from the mismatch distribution, t is the absolute time since expansion, and u = 2mk, where m is the mutation rate and k is the length of the sequence [46]. We assumed a generation time of 3.5 years, because Hepialus generations last 3–4 years in alpine meadow environments [11].
Demographic history analyses Fu’s Fs, Fu and Li’s D* and F*, and Tajima’s D tests of neutrality were calculated to detect the range of population expansions [39–41]. These parameters provide information about demographic histories; significant negative values can be taken as evidence of demographic expansions, while positive values might result from population bottlenecks. Mismatch distribution analysis was conducted to further infer demographic processes using Dnasp5.1 [28]. A unimodal distribution indicates that populations have passed through a recent demographic expansion [42], while multimodal distributions are consistent with stability [43].
Results Haplotype diversity There were no insertions or deletions of nucleotides in the 654 bp COI sequences amplified from 400 samples from all 43 O. sinensis populations. A total of 169 nucleotide polymorphisms were detected. The total haplotype diversity (Hd) and nucleotide diversity (Pi) of COI were 0.908 and 0.041, respectively. Within populations, host Hd was in the range of 0–0.924 and Pi was in the range of 0–0.058 (Table S1). Population P36, located in the Nyingchi area of Tibet, showed the highest haplotype and nucleotide diversity (Fig. 1, Table S1). Other populations from
Divergence time estimates Because Hepialidae fossils are lacking, divergence time among haplotypes in this study were estimated assuming the substitution rate of 1.02% Myr21 for Papilio spp. for COI+COII [44]. This estimation was performed using program Mega 5.2 [27] on a Neighbor-Joining tree with a topology similar to the BI and ML trees, in order to avoid the effect of model and arithmetic of different software on divergence time. PLOS ONE | www.plosone.org
3
March 2014 | Volume 9 | Issue 3 | e92293
Genetic Diversity & Distribution of Host Insects
the Nyingchi area. H26 was the most widespread haplotype and existed in populations from mid-south Qinghai, Gansu, and Sichuan Provinces. The two haplotypes H15 and H26 with the highest distribution frequencies simultaneously appeared in the populations P7 and its closer population P23. In particular, population P7 also contained the central haplotype H24 (Fig. 1). The dominant haplotype H35 was distributed in the populations from north Qinghai and usually appeared together with H26. The distal haplotypes positioned away from the four haplotypes had complex connections (Fig. 2). They were usually found in populations P25, P37, P42 and P43, which were located on the eastern edge of the distribution area (Fig. 1).
the Nyingchi and ShangriLa areas also had high haplotype diversity. Ninety-one distinct haplotypes of COI were identified in host insects from the 43 populations (Table S2, GenBank accession No. KC994913-KC995003). Fifteen haplotypes were shared among multiple populations with obvious geographical distribution, but only five had frequencies above 5%, including H1 (6.8%), H15 (11.8%), H26 (24.0%), H35 (7.5%), and H81 (10.8%) (Fig. 1). These five haplotypes were detected in 60.9% of all samples and in 81.4% of all populations; they had a broad distribution in the QTP but were mainly distributed, respectively, to the west of the Nyingchi area, the north of the Nyingchi area, in the mid-south of Qinghai, in northern Qinghai, and in the area around Qinghai Lake (Fig. 1). Some shared haplotypes were unique to populations from specific regions, e.g., the ShangriLa or Qinghai Lake areas. The other 76 private haplotypes were detected in 29 populations (67.4% of all populations). Interestingly, only five populations (P2, P5, P25, P33, and P34) lacked shared haplotypes, and they were usually located along the edge of the distribution areas.
Genetic differentiation and phylogeographic structure AMOVA analysis revealed that 65.18% of the total genetic variation was partitioned among populations, indicating remarkable genetic differentiation in the monophyletic host insects (Table 1). Different genetic differentiation patterns appeared in different groups (Fig. 2). Group II had the highest percentage of genetic variation (96.8%) among populations, indicating that extreme differences existed between the two populations (P2 and P5) in this group. High levels of genetic variation (59.28%) existed among populations in group IV, especially in subgroup IV-3 (75.56%), which included most populations with broad distribution ranges in western China, and could reflect the fundamental genetic differentiation of these host insects. However, group III showed a peculiar genetic differentiation pattern in that only 38.51% of the genetic variation occurred among populations (Table 1), unlike in the other groups or in all populations. A permutation test showed that NST (0.7498) was significantly higher than GST (0.3990, P,0.05) for the monophyletic host insects, indicating that significant phylogeographic structure existed in the host insects of O. sinensis. The phylogeographic structure was also significant for each group.
Phylogenetic relationships and host haplotype network In the Bayesian tree of host COI sequences, four haplotype groups were distinguished, which was largely congruent with that of NJ and ML trees differing only in minor rearrangements of the leaves (Fig. 2). Monophyletic analysis revealed that all host insects were monophyletic except those in group I. Group I included only haplotype H81, the sole haplotype in four populations around Qinghai Lake, which clustered to Hepialus menyuanicus with high posterior probability or bootstrap value (PP/ML/NJ = 1.00/0.73/ 100). Group II comprised the private haplotypes H5, H6, and H11 and included the two populations P2 and P5, which were located on the edge of southern Tibet. Group III included haplotypes H17-H22 and H62-H77, which were restricted to populations of P33, P34, P35, and P36 from the Nyingchi area. The remaining 71.4% of haplotypes were clustered into group IV, which could be subdivided into eight subgroups (Fig. 2). The subgroup IV-3 with the most haplotypes was clustered with Ahamus yushuensis, and further divided into IV-3-1, IV-3-2, IV-3-3, and IV-3-4, corresponding to the four dominant haplotypes H1, H15, H26, and H35, respectively (Fig. 2). The other seven subgroups were mainly composed of haplotypes from populations P4, P25, P37, P42, and P43 with high posterior probability or bootstrap values, which were located on the edge of the host insect distribution. The subgroup of IV-4 and IV-8 clustered to the Thitarodes renzhiensis and T. armoricanus, respectively. No haplotype network was calculated for groups I and II, which had few haplotypes. The haplotype network for group III, which contained only haplotypes fixed in those populations from the Nyingchi area, showed no clear indication of demographic processes (Fig. 2). Four populations (9.3% of the total) from the Nyingchi area possessed 34.2% of all private haplotypes. The large number of haplotypes suggested that the Nyingchi area was a diversity center for the host insects of O. sinensis. The network for group IV showed that a large number of private haplotypes were connected in a star-like manner, with some dominant haplotypes such as H1, H15, H26, and H35 (Fig. 2). Haplotype H24 was considered as the central haplotype in this network. H24 had only four, one, two, and four mutations different from the four domain haplotypes of H1, H15, H26, and H35, respectively. The dominant haplotype H1 occurred mainly in populations located to the west of the Nyingchi area. H15 occurred in eight populations located to the north of the Nyingchi area and also appeared in populations P23 from southern Qinghai and P6 from PLOS ONE | www.plosone.org
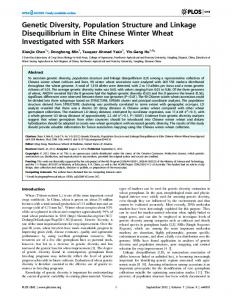
Divergence times and demographic expansion Divergence time estimation revealed that the initial divergence of host insects occurred around 4.1 Ma, in the late Miocene. Host haplotypes nested within group II diverged more recently, around 2.2 Ma, in the Pleistocene. Haplotype diversification of groups III and IV began almost simultaneously around 3.5 Ma and 3.7 Ma, respectively, in the late Pliocene. Three neutrality tests resulted in non-significant negative values for all monophyletic host insects (Table 2), and mismatch distribution analysis showed a multimodal curve (Fig. 3a). These analyses indicated that no obvious expansion had occurred in the monophyly. However, different demographic processes occurred in different groups (Fig. 3). In group III, an expansion model was rejected based on non-significant positive values of the neutrality tests and on the multimodal curve (Fig. 3c). However, significant positive values of the neutrality tests and a multimodal curve were obtained from group II (Fig. 3b), indicating maybe a recent population bottleneck in this group. Conversely, Fu’s Fs, Fu and Li’s F* and Tajima’s D were all negative and significant for group IV, demonstrating that a recent demographic expansion was the likely cause of the deviances from neutrality (Table 2). The unimodal curve of the mismatch distribution analysis agreed with the neutrality test results (Fig. 3d). The expansion time of group IV was estimated to have begun around 0.128 Ma, in the late Pleistocene. The expansion estimate of subgroup IV-3 was completely consistent with that of group IV, and its expansion time was also in the late Pleistocene, around 0.118 Ma.
4
March 2014 | Volume 9 | Issue 3 | e92293
Genetic Diversity & Distribution of Host Insects
PLOS ONE | www.plosone.org
5
March 2014 | Volume 9 | Issue 3 | e92293
Genetic Diversity & Distribution of Host Insects
Figure 2. Phylogenetic relationships and haplotypes network of host insects from 43 O. sinensis populations in the QTP. (Left) Bayesian haplotypes phylogenetic tree of host insects based on COI gene sequences. Numbers on branches are Bayesian posterior probabilities, bootstrap support values of Maximum likehood and Neighbour-Joining trees (BI/ML/NJ), and * represented posterior probabilities ,0.6 or support values ,60%. The black bars on the right indicate the corresponding group number in the nested clade phylogeographic analysis, and each group or subgroup was presented with different colors. (Right) Haplotype networks of host insects corresponding to the group III and IV. The relative sizes of circles in the network are proportional to haplotype frequencies. The small black dots indicate hypothetical missing haplotypes. The haplotype colors correspond to those in phylogenetic tree on the left. doi:10.1371/journal.pone.0092293.g002
coupled with high genetic differentiation among populations [54]. In this study, significant phylogeographic structure (NST. GST, P,0.05) did exist in the monophyletic host insects across the distribution of O. sinensis. Many factors have been suggested to influence the patterns of genetic and geographic structure in natural populations, such as life history, ecological traits, habitat, and historical events [55–58]. In this study, the significant phylogeographic structure of the host insects should be attributed to their unique life history and habitat isolation. Female Hepialus cannot fly long distances, and adults survive only 3–8 days [11]. The complex topography resulting from the uplift of the QTP [59] also limited gene flow among populations. Usually, significant phylogeographic structure demonstrates that the most closelyrelated haplotypes are more likely to co-occur in the same geographical area [50]. In this study, three haplotype groups of the monophyletic host insects corresponded with the edge of southern Tibet (group II), the Nyingchi area (group III), and the mid-south of Qinghai to mid-north of Tibet and related areas (group IV) (Fig. 2), indicating that the host insects had obvious geographical distribution patterns. Both populations (P2 and P5) in group II and some populations (P25, P37, P42, and P43) in group III, which are located on the edge of the QTP, had unique haplotypes and high genetic diversity. Group II was estimated to have split ca. 2.2 Ma, probably because of the geographical and ecological alterations following both the QTP uplift and glacial advance/retreat cycles during the Quaternary ice age [60,61]. The margin of the QTP, which had complex topography and a special ecoclimate, served as a refugium or source for many species [50,52]. In particular, the southeastern margin of the QTP, the Hengduan Mountains region, not only served as an important glacial refugium but was also a center of diversification for many plants and animals [52,62,63], because extensive ice did not develop there during the Quaternary stage [64]. Populations P42 and P43 were located in the ShangriLa area of the Hengduan Mountains region. Therefore, we hypothesized the existence of multiple periglacial microrefugia for the host insects around the edge of the QTP during glacial periods. This phenomenon is similar to results of phylogeographic analyses of other species in the QTP [50,52,65]. However, in this study, those edge refugia were not
Discussion Haplotype diversity of the host insects was very high (Hd = 0.908). Based on identified Hepialidae species and the COI haplotypes in this study, the host insects belong to three genera: Ahamus, Hepialus and Thitarode. The high haplotype diversity and apparent species composition support the idea that the host insects of O. sinensis are complex and belong to many species of different genera [6]. However, most host haplotypes were derived from dominant ones. Four dominant haplotypes with few nucleotide mutations represented 50.7% of samples and 72.1% of populations with a broad distribution in western China. The four dominant haplotypes clustered in subgroup IV-3 corresponded to Ahamus yushuensis. Our previous study using Cytb sequences demonstrated that A. yushuensis was widely distributed, although most host species have narrow distributions [24]. Therefore, in this study, the insects from most populations were closely related, indicating that the host species composition might be relatively simple in large-scale O. sinensis populations. In this study, all host insects were monophyletic except for those from four O. sinensis populations around Qinghai Lake (group I), in complete accordance with the results revealed by Cytb sequences [24]. Qinghai Lake, the largest extant closed-basin lake in China, is surrounded by the Datong, Riyue, and Amuni mountains [47,48]. The Qinghai Lake basin was fractured from the northwest to the southeast during the QTP uplift in the late Tertiary. During the middle Pleistocene, vast crustal movements caused the area to sink substantially, forming the lake [47]. The regional climate, rainfall, and plant distributions in this area were shaped by the water of the lake itself and by the topography of the basin [49]. Group I of the host insects included a sole private host haplotype (H81) whose ancestor was estimated to have occurred ca. 4.1 Ma, before the onset of the major Quaternary glaciations. Thus, the unique host insects of O. sinensis likely evolved under the special environment and topography of Qinghai Lake. AMOVA analysis indicated that most genetic variation (FST = 65.18%) in the monophyletic host insects occurred among populations. High levels of genetic differentiation have also been found for numerous other alpine species in the QTP [50–53]. Distinct phylogeographic structure is reported to be usually
Table 1. Estimates of genetic differentiation coefficient (NST, GST) and analysis of molecular variance (FST) for host insects from 43 O. sinensis populations in the QTP.
NST
GST
FST
Monophyly
0.7498
0.3990
0.6518
Group II
0.9680
0.5380
0.9680
Group III
0.4370
0.1000
0.3851
Group IV
0.6340
0.4380
0.5928
Subgroup IV-3
0.8036
0.4899
0.7556
Monophyly (Group II+Group III+Group IV) was detected using Geneious Pro v4.8.4 software. Each group and subgroup was defined according to BI analysis and corresponding to the phylogenetic tree in Figure 2. doi:10.1371/journal.pone.0092293.t001
PLOS ONE | www.plosone.org
6
March 2014 | Volume 9 | Issue 3 | e92293
Genetic Diversity & Distribution of Host Insects
Figure 3. Mismatch distribution analysis for host insects using DNASP5.1. Graphs of the mismatch distributions of (a) Monophyly; (b) group II; (c) group III; (d) group IV. The X axis shows the observed distribution of pairwise nucleotide differences, and the Y axis shows the frequencies. The dotted lines with circles represent the observed frequency of pairwise differences, and the solid lines show the expected values under the sudden population expansion model. doi:10.1371/journal.pone.0092293.g003
Most host haplotypes from populations covering almost the entire QTP were included in group IV. Differentiation in this group was estimated to have occurred ca. 3.7 Ma, shortly before the rapid QTP uplift at ca. 3.6 Ma [60,69]. The QTP uplift might play an important role in the divergence of host insects of O. sinensis. Four dominant host haplotypes (H1, H15, H26, and H35) corresponding to distinct areas distributed along a latitudinal gradient were defined based on the phylogenetic analysis and haplotype geographic distribution. This finding was congruent with the distribution pattern of O. sinensis based on morphological characteristics and ISSR analysis [71]. The four dominant haplotypes in subgroup IV-3 corresponded to only A. yushuensis. There were only a few nucleotide differences among the four main haplotypes, but few populations had two or more of these haplotypes. Additionally, each dominant host haplotype usually only occupied a single distribution area. These results implied that the rapid uplift of the QTP led to habitat isolation and nucleotide mutations in the host insects. Many studies have indicated that habitat fragmentation could have a great influence on plant divergence and speciation [18,72–74]. Therefore, we hypothesized that the haplotypes in this group were derived from relicts of a once widespread host insect species that subsequently became fragmented. A recent demographic expansion in subgroup IV-3 (A. yushuensis) was confirmed by neutrality tests and mismatch distribution analysis. The star-like haplotype network, high haplotype diversity,
a source of private haplotypes spreading to other areas during inter- or post-glacial periods. This unique aspect may be related to the short flying distance and weak dispersal ability of the host insects of O. sinensis [11]. The highest host haplotype and nucleotide diversities were detected in group III, suggesting that the Nyingchi area was a diversity center or another refugium of the host insects of O. sinensis during the glacial period. The divergence of group III was estimated to have occurred ca. 3.5 Ma, following the changed monsoon intensity [61,66], modified global climate [61,67,68] and topography changes caused by the rapid uplift of the QTP at ca. 3.6 Ma [60,69]. Geological studies demonstrated that both uplift speed and amplitude of this area of southeastern Tibet were slower than in the western Himalayas and northern Tibet during the late Pleistocene [70]. According to a report from the China Tibet Information Center, a gap that opened in the Nyingchi area allowed the warm Indian current to move upstream to meet cold air from the north, producing different coexisting bioclimatic regions in the area (http://www.tibetinfor.com.cn/english/ reports/land/nyingchi/nyingchi.htm). The haplotype network and neutrality tests demonstrated no evidence of postglacial recolonization or range expansion in this area. Additionally, the genetic differentiation within populations was relatively high compared with other areas. Therefore, the unique topography and climate of the Nyingchi area provided refuges and led to the diverse host haplotypes found today in Tibet.
PLOS ONE | www.plosone.org
7
March 2014 | Volume 9 | Issue 3 | e92293
and low nucleotide diversity also indicated that host insects in this subgroup had undergone rapid regional expansion. The expansions of host insects within this subgroup were estimated to have begun ca. 0.118 Ma, in the late Pleistocene, during the interglacial period after the penultimate glaciation (ca. 0.3–0.13 Ma) [75–78]. We inferred that an ancestral haplotype was widely distributed before the uplift occurred and, subsequently, geological changes and climatic oscillations during the QTP uplift and Quaternary glaciation led to the present-day genetic diversity and population differentiation of the host insects. After the QTP uplift and glaciation period, the four dominant haplotypes appeared in their respective latitudinal zones. Many new host haplotypes were derived from these four during these expansion phases, resulting in the star-like haplotype network that we recovered. Population P7 included two dominant haplotypes (H15, H26) as well as a central haplotype (H24) with only one nucleotide difference from H15, which may be situated at the point where several recolonizing lineages merged. Conservation of rare species focuses mainly on maximizing genetic diversity and heterozygosity [79], because high genetic diversity can yield higher fitness during environmental changes [80]. In this study, the genetic diversity and structure we identified not only provided important insights into the evolutionary history of the host insects but these are also critical for their conservation management. Our results showed that the conservation of multiple populations in both the Nyingchi and ShangriLa areas will be necessary to ensure the genetic and species diversity of these insects. Additionally, the O. sinensis populations with high host genetic diversity (e.g., population P7) from the four latitudinal regions that cover most of the QTP should be given high priority for protection and sustainable development.
PLOS ONE | www.plosone.org
Fs, Fu’s Fs test statistic; D *, Fu and Li’s D * test statistic; F*, Fu and Li’s F* test statistic; Tajima’s D: Tajima’s Test statistic. doi:10.1371/journal.pone.0092293.t002
P,0.05 P,0.05
P.0.10 0.19
21.90
P.0.10
22.37
P.0.10
P.0.05
0.56 P.0.05
P,0.01 224.78
4.80 Group III
Group IV
P,0.02
22.06
0.50
P,0.01
P.0.10 20.79 P.0.10 20.65 P.0.10 210.32
10.64 Group II
Monophyly
P.0.05
1.59
2.62
P.0.10
P,0.02
20.85
2.09
Tajima’s D P value F* P value D* P value
Fs
Table 2. Estimates of the neutral tests (Fu’s FS, Fu and Li’s D*, Fu and Li’s F*, and Tajima’s D) for population expansion of each group.
P value
Genetic Diversity & Distribution of Host Insects
Supporting Information Table S1 Codes, locations and sample numbers of O. sinensis populations and genetic diversity estimates of its host insects. P: population; N: number of specimen; Nh: number of haplotypes; S: number of segregating sites; Hd: haplotype diversity; Pi: nucleotide diversity; NpH: number of private haplotypes. (XLSX) Table S2 GenBank accession numbers and haplotype frequencies in the populations included in the study. Population codes correspond to those in Table S1 and Figure 1. (XLSX)
Acknowledgments The authors thank Guang-Pu Guo, Hai-Feng Xu and Yang Zhong for their help in the sample collection, Shi-San Bao, Rebecca Bao and XinYing Cheng (The University of Sydney, Australia) for correcting the English language, and the academic editor Dee A. Carter and the anonymous reviewer for their valuable comments and useful suggestions to the manuscript.
Author Contributions Conceived and designed the experiments: QMQ ZC. Performed the experiments: QMQ LLC XW. Analyzed the data: QMQ SL XLY. Contributed reagents/materials/analysis tools: QMQ MW YGZ. Wrote the paper: QMQ ZC.
References 1. Sung GH, Hywel-Jones NL, Sung JM, Luangsa-Ard JJ, Shrestha B, et al. (2007) Phylogenetic classification of Cordyceps and the clavicipitaceous fungi. Stud Mycol 57: 5–59.
8
March 2014 | Volume 9 | Issue 3 | e92293
Genetic Diversity & Distribution of Host Insects
34. Masters BC, Fan V, Ross HA (2011) Species delimitation—a geneious plugin for the exploration of species boundaries. Mol Ecol Resour 11:154–157. 35. Drummond AJ, Ashton B, Cheung M, Heled J, Kearse M, et al. (2010) Geneious. Version 4.8.4. Software. Available: http://www.geneious.com/. 36. Pons O, Petit RJ (1995) Estimation, variance and optimal sampling of gene diversity I. Haploid locus. Theor Appl Genet 90: 462–470. 37. Pons O, Petit RJ (1996) Measuring and testing genetic differentiation with ordered versus unordered alleles. Genetics 144: 1237–1245. 38. Excoffier L, Laval G, Schneider S (2005) Arlequin (version 3.0): an integrated software package for population genetics data analysis. Evol Bioinform 1: 47–50. 39. Tajima F (1989) Statistical method for testing the neutral mutation hypothesis by DNA polymorphism. Genetics 123:585–595. 40. Fu YX, Li WH (1993) Statistical tests of neutrality of mutations. Genetics 133: 693–709. 41. Fu YX (1997) Statistical tests of neutrality of mutations against population growth, hitchhiking and background selection. Genetics 147: 915–925. 42. Excoffier L (2004) Patterns of DNA sequence diversity and genetic structure after a range expansion: lessons from the infinite-island model. Mol Ecol 13: 853–864. 43. Slatkin M, Hudson RR (1991) Pairwise comparisons of mitochondrial DNA sequences in stable and exponentially growing populations. Genetics 129: 555– 562. 44. Zakharov EV, Caterino MS, Sperling FA (2004) Molecular phylogeny, historical biogeography, and divergence time estimates for swallowtail butterflies of the genus Papilio (Lepidoptera: Papilionidae). Syst Biol 53: 193–215. 45. Rogers AR (1995) Genetic evidence for a Pleistocene population expansion. Evolution 49: 608–615. 46. Rogers AR, Harpending H (1992) Population growth makes waves in the distribution of pairwise genetic differences. Mol Biol Evol 9: 552–569. 47. Yuan BY, Chen KZ, Bowler JM, Ye SJ (1990) The formation and evolution of the Qinghai Lake. Quaternary Science 3: 233–243. 48. Madsen DB, Ma HZ, Rhode D, Brantingham PJ, Forman SL (2008) Age constraints on the late Quaternary evolution of Qinghai Lake, Tibetan Plateau. Quaternary Res 69: 316–325. 49. Qi WL, Guo LY (2007) The analysis of the effects of climate change on ecological environment around the Qinghai Lake. Prataculture and Animal Husbandry 7: 33–43. 50. Zhang Q, Chiang TY, George M, Liu JQ, Abbott RJ (2005) Phylogeography of the Qinghai-Tibetan Plateau endemic Juniperus przewalskii (Cupressaceae) inferred from chloroplast DNA sequence variation. Mol Ecol 14: 3513–3524. 51. Chen SY, Wu GL, Zhang DJ, Gao QB, Duan YZ, et al. (2008) Potential refugium on the Qinghai–Tibet Plateau revealed by the chloroplast DNA phylogeography of the alpine species Metagentiana striata (Gentianaceae). Bot J Linn Soc 157: 125–140. 52. Yang FS, Li YF, Ding X, Wang XQ (2008) Extensive population expansion of Pedicularis longiflora (Orobanchaceae) on the Qinghai-Tibetan Plateau and its correlation with the Quaternary climate change. Mol Ecol 17: 5135–5145. 53. Zeng LY, Xu LL, Tang SQ, Tersing T, Geng YP, et al. (2010) Effect of sampling strategy on estimation of fine-scale spatial genetic structure in Androsace tapete (Primulaceae), an alpine plant endemic to Qinghai–Tibetan Plateau. J Syst Evol 48: 257–264. 54. Avise JC (2004) Molecular Markers, Natural History and Evolution, Second Edition. Cambridge: Harvard University Press. 55. Ge XJ, Chiang YC, Chou CH, Chiang TY (2002) Nested clade analysis of Dunnia sinensis (Rubiaceae), a monotypic genus from China based on organelle DNA sequences. Conserv Genet 3: 351–362. 56. Hewitt GM (2004) Genetic consequences of climatic oscillations in the Quaternary. Philos T Roy Soc B 359: 183–195. 57. Newton AC, Allnutt AR, Gillies ACM, Lowe AJ, Ennos RA (1999) Molecular phylogeography, intraspecific variation and the conservation of tree species. Trends Ecol Evol 14: 140–145. 58. Chen ST, Xing YW, Su T, Zhou ZK, L Dilcher ED, et al. (2012) Phylogeographic analysis reveals significant spatial genetic structure of Incarvillea sinensis as a product of mountain building. BMC Plant Biol 12: 1–12. 59. Wang CS, Zhao XX, Liu ZF, Lippert PC, Graham SA, et al. (2008) Constraints on the early uplift history of the Tibetan Plateau. P Natl Acad Sci USA 105: 4987–4992. 60. Li JJ, Fang XM (1998) Research on the uplift of the Qinghai-Xizang Plateau and environmental changes. Chinese Sci Bull 43: 1569–1574. 61. An ZS, Kutzbach JE, Prell WL, Porter SC (2001) Evolution of Asian monsoons and phased uplift of the Himalaya-Tibetan plateau since Late Miocene times. Nature 411: 62–66. 62. Suzuki H, Sato JJ, Tsuchiya K, Luo J, Zhang YP, et al. (2003) Molecular phylogeny of wood mice (Apodemus, Muridae) in East Asia. Biol J Linn Soc 80: 469–481. 63. Yang SJ, Dong HL, Lei FM (2009) Phylogeography of regional fauna on the Tibetan Plateau: A review. Prog Nat Sci 19: 789–799. 64. Shi YF, Li JJ, Li BY (1998) Uplift and environmental changes of Qinghai– Tibetan Plateau in the late Cenozoic. Guangzhou: Guangdong Science and Technology Press. 65. Meng LH, Yang R, Abbott RJ, Miehe G, Hu TH, et al. (2007) Mitochondrial and chloroplast phylogeography of Picea crassifolia Kom. (Pinaceae) in the Qinghai–Tibetan Plateau and adjacent highlands. Mol Ecol 16: 4128–4137.
2. Shimitsu D (1978) Green Book 51, Cordyceps. Japan: New Science Company. 3. Zhu JS, Halpern GM, Jones K (1998) The scientific rediscovery of an ancient Chinese herbal medicine: Cordyceps sinensis part I. J Altern Complem Med 4: 289–303. 4. The State Pharmacopoeia Commission of PR China (2010) Pharmacopoeia of the People’s Republic of China, vol. 1. China Medical Science Press, Beijing, pp. 224–225. 5. Chu HF, Wang LY, Han HX (2004) Fauna Sinica, volume 38, Lepidoptera: Hepialidae, Epiplemidae. Science Press, Beijing, pp. 291. 6. Wang XL, Yao YJ (2011) Host insect species of Ophiocordyceps sinensis: a review. ZooKeys 127: 43–59. 7. Buenz EJ, Bauer BA, Osmundson TW, Motley TJ (2005) The traditional Chinese medicine Cordyceps sinensis and its effects on apoptotic homeostasis. J Ethnopharmacol 96: 19–29. 8. Wang GD (1995) Cordyceps species: ecology, cultivation and application. Science and Technology Reference Press, Beijing, pp. 307. 9. Yao YJ (2004) Conservation and rational use of the natural resources of Cordyceps sinensis. Sci News 15: 28–29. 10. Zhu HY, Mou JL (2006) Removal of chongcao at the source of the three rivers: A craze out of control. In Crisis and Break through of China’s Environment, pp. 291–298. Edited by Social Sciences Academic Press, Beijing, China. 11. Yang DR, Li CD, Shu C, Yang YX (1996) Studies on the Chinese species of the genus Hepialus and their geographical distribution. Acta Entomologica Sinica 39: 413–422. 12. Li SP, Tsim KWK (2004) The biological and pharmacological properties of Cordyceps sinensis, a traditional Chinese medicine that has broad clinical applications. In: Herbal and Traditional Medicine: Molecular Aspects of Health, pp.657–686. Edited by CRC Press. 13. Liu F, Wu XL, Yin DH, Chen SJ, Zeng W (2005) Overview in biological studies of host insects of Cordyceps sinensis. Chongqing Journal Research on Chinese Drugs and Herbs 51: 45–52. 14. Li YL, Xu CT, He LJ (2007) Biological characteristics of Yushu host Hepialus larvae of Ophiocordyceps sinensis. Entomological Knowledge 44: 285–288. 15. Zou ZW, Liu X, Zhang GR (2010) Revision of taxonomic system of the genus Hepialus (Lepidoptera, Hepialidae) currently adopted in China. Journal of Hunan University of Science & Technology (Natural Science Edition) 25: 114– 120. 16. Yang P (2005) The main environmental effect of Qinghai-Tibet Plateau uplift. Qinghai Environment 3: 93–95. 17. Yuan Y (2012) Review on regional climate change induced by Qinghai-Tibet Plateau uplift. Journal of Anhui Agricultural Sciences 40: 9815–9818. 18. Yang FS, Qin AL, Li YF, Wang XQ (2012) Great genetic differentiation among populations of Meconopsis integrifolia and its implication for plant speciation in the Qinghai-Tibetan Plateau. PLOS ONE 7: e37196. 19. Zhang TC, Comes HP, Sun H (2011) Chloroplast phylogeography of Terminalia franchetii (Combretaceae) from the eastern Sino–Himalayan region and its correlation with historical river capture events. Mol Phylogenet Evol 60: 1–12. 20. Wang B, Mao JF, Gao J, Zhao W, Wang XR (2011) Colonization of the Tibetan Plateau by the homoploid hybrid pine Pinus densata. Mol Ecol 20: 3796–3811. 21. Qiu YX, Fu CX, Comes HP (2011) Plant molecular phylogeography in China and adjacent regions: Tracing the genetic imprints of Quaternary climate and environmental change in the world’s most diverse temperate flora. Mol Phylogenet Evol 59: 225–244. 22. Zhan XJ, Zheng YF, Wei FW, Bruford MW, Jia CX (2011) Molecular evidence for Pleistocene refugia at the eastern edge of the Tibetan Plateau. Mol Ecol 20: 3014–3026. 23. Thomas JA (2005) Monitoring change in the abundance and distribution of insects using butterflies as indicator groups. Philos T Roy Soc B 360: 339–357. 24. Cheng Z, Geng Y, Liang HH, Yang XL, Li S, et al. (2007) Phylogenetic relationships of host insects of Cordyceps sinensis inferred from mitochondrial cytochrome b sequences. Prog Nat Sci 17: 789–797. 25. Quan QM, Wang QX, Zhou XL, Li S, Yang XL, et al. (2014) Comparative phylogenetic relationships and genetic structure of the caterpillar fungus Ophiocordyceps sinensis and its host insects inferred from multiple gene sequences. J Microbiol 52: 99–105. 26. Hebert PDN, Ratnasingham S, deWaard JR (2003) Barcoding animal life: cytochrome c oxidase subunit 1 divergences among closely related species. P Roy Soc B-Biol Sci 270: S96–99. 27. Tamura K, Peterson D, Peterson N, Stecher G, Nei M, et al. (2011) MEGA5: Molecular evolutionary genetics analysis using maximum likelihood, evolutionary distance, and maximum parsimony methods. Mol Biol Evol 28: 2731–2739. 28. Librado P, Rozas J (2009) DnaSP v5: A software for comprehensive analysis of DNA polymorphism data. Bioinformatics 25: 1451–1452. 29. Nylander J (2008) MrModeltest2 v. 2.3. Program distributed by the author. Evolutionary Biology Centre, Uppsala, Sweden. 30. Swofford DL (2002) PAUP*: phylogenetic analysis using parsimony (* and other methods) 4.0b10. Sunderland, Massachusetts, USA: Sinauer Associates. 31. Huelsenbeck JP, Ronquist F (2001) MRBAYES: Bayesian inference of phylogenetic trees. Bioinformatics 17:754–755. 32. Guindon S, Gascuel O (2003) A simple, fast, and accurate algorithm to estimate large phylogenies by maximum likelihood. Syst Biol 52: 696–704. 33. Bandelt HJ, Forster P, Ro¨hl A (1999) Median–joining networks for inferring intraspecific phylogenies. Mol Biol Evol 16: 37–48.
PLOS ONE | www.plosone.org
9
March 2014 | Volume 9 | Issue 3 | e92293
Genetic Diversity & Distribution of Host Insects
73. Young A, Boyle T, Brown A (1996) The population genetic consequences of habitat fragmentation for plants. Trends Ecol Evol 11: 413–418. 74. Fahrig L (2003) Effects of habitat fragmentation on biodiversity. Annu Rev Ecol Evol S 34: 487–515. 75. Shi YF (2002) Characteristics of late Quaternary monsoonal glaciation on the Tibetan plateau and in East Asia. Quatern Int 97–98: 79–91. 76. Zheng BX, Xu QQ, Shen YP (2002) The relationship between climate change and Quaternary glacial cycles on the Qinghai–Tibetan plateau: review and speculation. Quatern Int 97–98: 93–101. 77. Zhuo Z, Yuan BY, Petit-Maire N (1998) Paleoenvironments in China during the Last Glacial Maximum and the Holocene optimum. Episodes 21: 152–158. 78. Zhang DF, Fengquan L, Jianmin B (2000) Eco-environmental effects of the Qinghai–Tibet plateau uplift during the Quaternary in China. Environ Geol 39: 1352–1358. 79. Falk DA, Holsinger KE (1991) Genetics and Conservation of Rare Plants. New York: Oxford University Press. 80. Huenneke LF (1991) Genetics and Conservation of Rare Plants. In: Ecological implications of genetic variation in plant populations, eds: Falk DA and Holsinger KE, New York: Oxford University Press. pp.31–44.
66. Qiang XK, Li ZX, Powell CM, Zheng HB (2001) Magnetostratigraphic record of the Late Miocene onset of the East Asian monsoon and Pliocene uplift of northern Tibet. Earth Planet Sc Lett 187: 83–93. 67. Kutzbach JE, Guetter PJ, Ruddiman WF, Prell WL (1989) The sensitivity of climate to late Cenozoic uplift in Southern Asia and the American west: Numerical experiments. J Geophys Res 94: 18393–18407. 68. Raymo ME, Ruddiman WF (1992) Tectonic forcing of late Cenozoic climate change. Nature 359: 117–122. 69. Shi YF, Li JJ, Li BY, Yao TD, Wang SM, et al. (1999) Uplift of the QinghaiXizang (Tibetan) Plateau and East Asia environmental change during late Cenozoic. Acta Geographica Sinica 54: 10–21. 70. Chen WY (1980) The nature environment of Nyingchi Prefecture in Tibet in Late Cenozoic. Vertebrata Palasiatica 1: 52–58. 71. Liang HH, Cheng Z, Yang XL, Li S, Ding ZQ, et al. (2008) Genetic diversity and structure of Cordyceps sinensis populations from extensive geographical regions in China as revealed by ISSR markers. J Microbiol 46: 549–556. 72. Templeton AR, Shaw K, Routman E, Davis SK (1990) The genetic consequences of habitat fragmentation. Ann Mo Bot Gard 77: 13–27.
PLOS ONE | www.plosone.org
10
March 2014 | Volume 9 | Issue 3 | e92293