Genetic Monogamy in Wilson's Storm-Petrel Source: The Auk, 118(1):242-248. Published By: The American Ornithologists' Union DOI: http://dx.doi.org/10.1642/0004-8038(2001)118[0242:GMIWSS]2.0.CO;2 URL: http://www.bioone.org/doi/full/10.1642/0004-8038%282001%29118%5B0242%3AGMIWSS %5D2.0.CO%3B2
BioOne (www.bioone.org) is a nonprofit, online aggregation of core research in the biological, ecological, and environmental sciences. BioOne provides a sustainable online platform for over 170 journals and books published by nonprofit societies, associations, museums, institutions, and presses. Your use of this PDF, the BioOne Web site, and all posted and associated content indicates your acceptance of BioOne’s Terms of Use, available at www.bioone.org/page/terms_of_use. Usage of BioOne content is strictly limited to personal, educational, and non-commercial use. Commercial inquiries or rights and permissions requests should be directed to the individual publisher as copyright holder.
BioOne sees sustainable scholarly publishing as an inherently collaborative enterprise connecting authors, nonprofit publishers, academic institutions, research libraries, and research funders in the common goal of maximizing access to critical research.
January 2001]
Short Communications
237
The Auk 118(1):237–242, 2001
Relationship of Songbird Nest Concealment to Nest Fate and Flushing Behavior of Adults DIRK E. BURHANS1 AND FRANK R. THOMPSON III North Central Research Station, U.S. Department of Agriculture Forest Service, 202 Natural Resources Building, University of Missouri, Columbia, Missouri 65211, USA Avoiding predation is an important consideration for any potential prey animal. Failure to escape from a predator results in loss of fitness, so there is strong selection for choices and behaviors that result in successful escape (Lima and Dill 1990). In their cost– benefit approach to flight from predators, Ydenberg and Dill (1986) stressed that flight should be optimized rather than maximized, because there is a cost (usually cessation of feeding) incurred by fleeing from predation. Field studies have largely supported their predictions (see Bonenfant and Kramer 1996). Whereas for foragers, flight from predators incurs an implicit cost in lost foraging time, birds confronted by a predator at the nest face an explicit choice between loss of current reproduction versus total reproductive loss. A bird flushing from the nest too early may escape, but reveal the nest location to the predator, resulting in loss of the current brood. However, flushing late from the nest could result in loss of both nest contents and the parent bird. Because nests are often hidden in vegetation (Martin 1992a), vegetative concealment could play a role in flight from the predator, much in the same the way in which cryptic body coloration may determine flightinitiation distance for animals such as lizards (Heatwole 1968). A perplexing outcome of research done to date on nest concealment is that improved nest concealment is not always correlated with lower nest predation in studies of real songbird nests (Howlett and Stutchbury 1996, Burhans and Thompson 1998, Braden 1999). Studies have similarly shown that frequency of brood parasitism, which typically lowers host fitness, is often not influenced by nest concealment (Burhans and Thompson 1998, Clotfelter 1998). If a view from the nest is important to adult birds, there should be a relationship between nest concealment and willingness of the adult bird to flush at the approach of a predator. We measured the relationship of flushing behavior to nest concealment for four songbird species having cryptically colored adult females. Our prediction was that nests with better concealment would result in females flushing at a closer distance from an intruder. We also examined the relationship between concealment and frequency of nest predation and avian brood parasitism. Two previous studies at our sites (Burhans
1
E-mail:
[email protected]
1996, Burhans and Thompson 1998) indicated that nest concealment was not related to nest predation, whereas one of two studies indicated that higher concealment was correlated with reduced frequency of brood parasitism (Burhans 1997). Methods. We located nests in old fields and adjoining forests from April through July 1998 at the Thomas S. Baskett Wildlife Research and Education Center near Ashland, Missouri. Those sites have been described previously in Burhans (1997) and have been the subject of songbird nesting and behavior studies since 1992 (Burhans 1997, Burhans and Thompson 1998, Dearborn 1998). We also searched for nests in a nearby agriculture field (30.8 ha). We used nests of Field Sparrows (Spizella pusilla), Indigo Buntings (Passerina cyanea), Northern Cardinals (Cardinalis cardinalis) and Yellow-breasted Chat (Icteria virens) because they are among the most abundant nesting species and females are cryptically colored when viewed on the nest. Although we have not measured nest defense responses specifically to humans of those species, they are not tame, and appear to respond to humans as they do to live or model predators. Response to humans near the nest generally includes rapid chipping or scolding and avoidance of the nest, which is similar to responses given to predators (Burhans 2000). We searched sites daily for nests and marked them with plastic flagging at least 3 m distance from the nest. Nests were monitored every two to three days until fledging approached, after which we monitored them daily to document fledging. Although many studies use presence of an empty nest on expected fledge date as confirmation of nest success, video cameras at our nests (Thompson et al. 1999) indicate that snakes often depredate nests on or immediately prior to the expected fledge date. Fledging thus was documented either by video camera or by behavioral evidence during early morning visits on the expected day of fledging. We looked for confirmation of fledging by nestling begging calls, sight of nestlings, parents carrying food, or parents chipping rapidly nearby. Nests empty prior to that were considered depredated; nests active up to the expected fledging date where we did not observe those activities were classified as unknown. We noted presence of eggs or nestlings of Brown-headed Cowbird (Molothrus ater) and categorized nests as parasitized or
238
Short Communications
unparasitized. We are reasonably confident that nest-monitoring and other activities (see below) did not increase probability of predation. Other studies done at our sites indicate that nests visited daily for video filming had significantly lower daily mortality for some species (Thompson et al. 1999). Flush experiments. We conducted flush experiments to determine relationships among concealment, the bird’s view from the nest, and adult vulnerability to predators. Those experiments involved one investigator walking directly to the nest until the adult bird flushed and left the nest. For flush experiments, we walked in a straight line to the nest from a randomly chosen direction where the view of the nest plant was not obstructed by intervening plants. Starting at least 8 m away, we walked (measured at 1 m/pace) silently toward the nest at a rate of 1 pace/s while keeping eyes directly on the nest or incubating bird. If the nest could not be seen, we looked at the known location of the nest based upon previous visits. We walked to the nest up to a distance of about 0.5 m. If the bird had not yet flushed at that distance, we stopped and without pausing extended a hand directly toward the nest. When the bird flushed, we measured ‘‘flushing distance’’ (Barash 1975) with a meter tape or stick (to the nearest 0.1 m) as the horizontal distance from the nest rim to the observer’s forward foot for distances .0.5 m or to the fingertip for distances ,0.5 m. Only females are known to incubate in all four species we tested and all species use only open-cup nests. ‘‘First flushes’’ were conducted where birds were not previously encountered at the nest by observers. To determine effects of habituation and to sample additional nests, we also conducted ‘‘second flushes.’’ Second flushes were performed at nests where first flushes were already taken or where birds were inadvertently disturbed at the nest during discovery. For nests where first flushes were performed, we conducted second flushes from the same direction as first flushes. For nests where birds were accidentally flushed previously, we randomly determined the direction of the second flush. We conducted all second flushes at least one day after first flushes or inadvertent flushes, but as much as 3 days later if birds were not present during ongoing attempts. We were careful to keep field assistants away from the vicinity of nests where either first or second flushes had not been performed to avoid disturbance that might affect flushing behaviour of birds during experiments. We attempted to initiate flushing experiments during the first few days of incubation (incubation days 1 to 3) when possible, but included several samples from late in the laying period as well as later in incubation. Mean incubation day for those nests where incubation day could be accurately determined was 1.9 6 SD of 2.1 for first flush experiments (n 5 50 nests) and 3.3 6 2.7 for second flush experiments (n 5 95 nests). For both first and second flushes, we ex-
[Auk, Vol. 118
amined correlations between flushing distance and incubation day both by species and all species combined and found no significant (P , 0.05) correlations. ‘‘Flush concealment’’ was the estimated percentage of the nest concealed (to the nearest 10%) based upon viewing the nest from our angle of approach; for example, a nest for which 20% of the nest was visible received an 80% score. To standardize measurements, we took all flush concealment samples at eyelevel standing upright at a distance of 1 m measured from the nest. Measuring flush concealment using the flushing distance could bias the sample, because birds that flushed far from the observer (sometimes .4 m) could have low concealment scores if the nest was difficult to see from a distance. All flush experiments and flush concealment measurements were performed by the first author to ensure consistency. In addition to measuring flush concealment, we measured concealment from four cardinal directions (N, E, S, W) at 1 m from the nest to determine mean concealment. We estimated mean percentage of the nest concealed (to the nearest 10%) similarly to the ‘‘flush concealment’’ measurements above except that measurements were at nest-height level (Burhans 1997, Burhans and Thompson 1998). We also measured height to the bottom of the nest cup (to the nearest 5 cm) and recorded the species of the nest plant. Data analyses. To determine if there was an effect of habituation on flushing, we conducted a repeatedmeasures ANOVA using only nests where we obtained first and second flushes at the same nest. In addition to the repeated flush effect (‘‘visit’’), that model included a variable for nesting species to account for differences in flushing behavior among species. We used the sample of first flushes (above) and regressed first flushing distance on both mean nest concealment and flush nest concealment (PROC GLM; SAS 1990). We included a variable for nest height and bird species. Although repeated-measures analysis indicated no difference between first and second flushes at the same nests (see results), we analyzed first and second flushes separately because the repeated-measures analysis used a subsample of available nests. Flushing distances were square-root transformed (Neter et al. 1990) and concealment measurements were arcsine square-root transformed (Sokal and Rohlf 1981) to improve normality, but we present nontransformed results to facilitate interpretation. We compared concealment between parasitized and unparasitized nests and depredated versus fledged nests with ANOVA models. As in a previous study (Burhans and Thompson 1998), we combined all bird species in those analyses and included a species factor to account for variability in concealment that could be falsely attributed to predation or par-
January 2001]
239
Short Communications
FIG. 1. Relationship between flush concealment and flushing distance for first flushes, all species combined. There were no among-species differences in flushing distance (n 5 22 Field Sparrow, 24 Indigo Bunting, 10 Northern Cardinal, and 6 Yellow-breasted Chat nests).
FIG. 2. Relationship between flush concealment and flushing distance for second flushes, by species (n 5 41 Field Sparrow, 36 Indigo Bunting, 14 Northern Cardinal, and 14 Yellow-breasted Chat nests). 5 0.1, df 5 1 and 55, P 5 0.80). First flushes did not differ among species (F 5 1.1, df 5 3 and 55, P 5 0.36) and no significant effect existed for nest height (F 5 1.1, df 5 1 and 55, P 5 0.31). In second flush experiments, flush concealment was similarly inversely related to the distance that birds flushed from the nest (overall F 5 5.2, df 5 6 and 98, P , 0.0001, r2 5 0.24; flush concealment F 5 18.5, df 5 1 and 98, P , 0.0001; Fig. 2). As with the previous model, mean nest concealment was not related to flushing distance (F 5 0.3, df 5 1 and 98, P 5 0.58) and there was no effect of nest height (F 5 0.4, df 5 1 and 98, P 5 0.55). However, second-flush distances differed among bird species (F 5 2.9, df 5 3 and 98, P 5 0.04; Fig. 2). The ANOVA model testing for differences in mean concealment between depredated and fledged nests was significant, but differences were due to nesting species rather than predation (Table 1; overall F 5 6.2, df 5 7 and 102, P , 0.0001, species F 5 12.1, df 5 3 and 102, P , 0.0001, predation F 5 0.03, df 5 1 and 102, P 5 0.86, species 3 predation interaction F 5 1.8, df 5 3 and 102, P 5 0.20). Mean concealment similarly differed because of nesting species rather than parasitism for nests in the cowbird parasitism analysis (overall F 5 4.8, df 5 7 and 100, P , 0.0001; parasitism F 5 0.8, df 5 1 and 100, P 5 0.40; nesting species F 5 4.4, df 5 3 and 100, P 5 0.006, species 3
asitism. When analyzing parasitism, we included only nests initiated before the termination of laying by cowbirds at our field sites (7 July 1998). We used the same sample of nests as the previous analyses. To determine whether premature flushing behavior could predispose nests to predation, we obtained residuals by regressing flushing distance on flush concealment (by species) using the transformed variables above. We then analyzed probability of predation with a logistic regression, including both indicator variables for species and the residuals as independent variables. Results. Repeated-measures analysis indicated that first and second flushing distances did not differ at nests where both first and second flushes were obtained (visit effect, ANOVA: F 5 1.9, df 5 1 and 53, P 5 0.17). Flushing distances differed among bird species (F 5 3.2, df 5 3 and 53, P 5 0.03), but did not differ among species according to visit (visit 3 species interaction, F 5 1.0, df 5 3 and 53, P 5 0.42). Flush concealment was inversely related to the distance that birds flushed from the nest in first flush experiments (overall F 5 6.0, df 5 6 and 55, P , 0.0001, r2 5 0.40; flush concealment F 5 30.9, df 5 1 and 55, P , 0.0001; Fig. 1). However, mean nest concealment had no relationship to flushing distance (F
TABLE 1. Mean nest concealment 6 SE (n) for depredated, fledged, parasitized, and unparasitized nests by species. Species Field Sparrow Indigo Bunting Northern Cardinal Yellow-breasted Chat
Depredated 91.3 74.3 83.9 74.0
6 6 6 6
1.6 3.2 3.7 3.3
(25) (21) (12) (11)
Fledged 88.6 71.5 70.0 86.3
6 6 6 6
3.7 5.2 6.8 6.3
(16) (17) (4) (4)
Parasitized 92.4 68.4 74.2 78.3
6 6 6 6
2.5 6.7 9.6 5.6
(3) (11) (3) (5)
Unparasitized 89.5 76.2 81.8 76.8
6 6 6 6
1.9 2.7 3.8 4.1
(38) (25) (13) (10)
240
Short Communications
parasitism interaction F 5 0.2, df 5 3 and 100, P 5 0.90). The logistic regression analysis of residuals indicated that birds flushing earlier were not more likely to experience depredation (parameter estimate for the residual of flushing distance and flush concealment 5 0.81 6 SE of 0.48, x2 5 2.90, P 5 0.09; overall model x2 5 7.1, P 5 0.13, r2adj 5 0.09). None of the species indicator variables were significant (P $ 0.08, all variables). Discussion. Flushing distance was inversely related to the amount of nest concealment measured from the direction in which we approached nests (Figs. 1 and 2), which suggests that those species use nest visibility at the nest in deciding when to evade a potential predator. Nest concealment did not appear to influence nest susceptibility to predators or cowbirds, as mean concealment did not differ between successful and depredated or parasitized and unparasitized nests. Birds that flushed early in relation to their flush concealment were not more likely to experience depredation. We cannot distinguish whether birds having high flush-concealment scores flushed closer from us because they could not detect our approach or because they were using nest cover to remain cryptic. Despite our silent approach during experiments, we walked over ground vegetation that inadvertently produced noise on our way to the nest; thus, our presence, if not our approach, was surely evident from some distance even to birds whose nests were 100% concealed from our angle of approach. Eye contact and direct approach by a potential predator implies a greater probability that the predator has detected the prey, but also implies a greater chance that the predator will detect it if it moves (Cooper 1997). Our attempt to walk toward and look directly at nests during our approach should have signaled to birds that we had already discovered their nest, although birds at nests with high concealment may have had more difficulty perceiving that intention. Ydenberg and Dill (1986) emphasized that potential prey may be aware of the predator long before flight actually occurs. In some cases, prey that flees too soon increases its vulnerability, because doing so attracts the attention of the predator. They predicted that well-camouflaged species would, thus, have shorter flight distances (Ydenberg and Dill 1986). Flushing from the nest complicates that scenario; if the enemy is a nest predator, the bird could lose its nest by flushing regardless of the flushing distance. Thus, birds should avoid flushing until they are certain that the nest has been discovered. Our data fit that pattern, as birds on nests with better concealment from our approach tended to remain until the last possible moment before flushing and giving away the nest location. Although flushing distance was inversely correlated with the ‘‘flush concealment’’ that we measured
[Auk, Vol. 118
when approaching the nest, it does not necessarily follow that birds chose their nest site and its concomitant concealment to allow them to flush from a certain distance; mean concealment was not related to flushing distance. Mean concealment also was not related to frequency of brood parasitism or nest predation, a finding consistent with many other songbird nesting studies (Howlett and Stutchbury 1996, Burhans and Thompson 1998, but see Burhans 1997), including other studies on the same species (Best 1978, Conner et al. 1986, Filliater et al. 1994). Relationships between nest predation and nest site features may exist, but may not be evident because the mechanisms influencing predation vary depending upon predator (Schmidt and Whelan 1999), and most nests are subject to a variety of predators (Filliater et al. 1994). Recent work with video cameras indicates that snakes are the main predators at our old field sites (Thompson et al. 1999). Concealment may not be an advantage where snakes are predators, because they may use olfaction or other cues in detecting nests (Eichholz and Koenig 1992, Schaub et al. 1992). Better concealment may similarly not help where cowbirds are concerned, because they appear to use adult host behavior in locating nests (Clotfelter 1998, Strausberger 1998). Nest concealment may be of greater importance where mammalian or avian predators (Clark and Nudds 1991) are responsible for nest predation. Presumably, the flushing responses we observed apply to visual predators; they may even be unique to ‘‘human predators.’’ Birds face a variety of predators, some of which are nonvisual or search randomly, and flushing strategies may vary with predator. For instance, Common Yellowthroat (Geothlypis triochas) females often leave the nest cryptically before human observers can visually detect them; they then may flush at a distance from the nest (D. Burhans pers. observ.; Gross 1953). Female Yellowbreasted Chats sometimes dropped below the nest while flushing, but were always directly observable to us in the act of flushing. Although the relationship of nest concealment to predation has received considerable attention, comparatively little attention has been devoted to the role of incubating birds in revealing the nest site. The finding that real nest sites have better concealment than unused sites selected at random suggests that birds choose nest sites at least in part because of concealment (Holway 1991, Kilgo et al. 1996a, b; but see Go¨tmark et al. 1995). If birds give away the nest location by flushing and can afford to flush later at well-concealed nests, then concealed nests should show lower predation frequencies. However, parent birds can also reduce predation by aggressive, cryptic, or distraction behaviors (Gochfeld 1984, Martin 1992b). Behaviors such as parental defense may compensate for poor concealment and explain in part why nest predation is not always explained by nest-
January 2001]
Short Communications
site features; studies at real nests (Ricklefs 1977, McLean et al. 1986, Murphy et al. 1997) and comparing predation at artificial versus real nests (Cresswell 1997, King et al. 1999) support that interpretation. The relationship between nest-site characteristics and nest predation remains a valuable area for study, but research thus far has often yielded conflicting or inconclusive results. Predation-related behaviors such as flushing, nest defense, and crypsis and their interactions with nest-site characteristics could provide explanations for patterns in predation that are presently lacking from nest-site vegetation studies alone. Acknowledgments. We thank Brandy Bergthold, Dan Lock, Nadine Varner, and Laura Herbeck for locating and monitoring nests. We are grateful to Brandy Bergthold for entering data. Gary Krause provided valuable help on the statistical analysis. Mark Bee and anonymous reviewers provided comments that greatly improved the manuscript. We thank Carl Freiling for kindly allowing us to work on his property. This study was funded by the U.S. Department of Agriculture Forest Service North Central Research Station. LITERATURE CITED BARASH, D. P. 1975. Evolutionary aspects of parental behavior: Distraction behavior of the Alpine Accentor. Wilson Bulletin 87:367–373. BEST, L. B. 1978. Field Sparrow reproductive success and nesting ecology. Auk 95:9–22. BONENFANT, M., AND D. L. KRAMER. 1996. The influence of distance to burrow on flight initiation distance in the woodchuck, Marmota monax. Behavioral Ecology 7:299–303. BRADEN, G. T. 1999. Does nest placement affect the fate or productivity of California Gnatcatcher nests? Auk 116:984–993. BURHANS, D. E. 1996. Anti-brood parasite defenses and nest-site selection by forest-edge songbirds in central Missouri. Ph.D. dissertation, University of Missouri, Columbia. BURHANS, D. E. 1997. Habitat and microhabitat features associated with cowbird parasitism in two forest edge cowbird hosts. Condor 99:866–872. BURHANS, D. E. 2000. Avoiding the nest: Responses of Field Sparrows to the threat of nest predation. Auk 117:803–806. BURHANS, D. E., AND F. R. THOMPSON III. 1998. Effects of time and nest-site characteristics on concealment of songbird nests. Condor 100:663– 672. CLARK, R. G., AND T. D. NUDDS. 1991. Habitat patch size and duck nesting success: The crucial experiments have not been performed. Wildlife Society Bulletin 19:534–543.
241
CLOTFELTER, E. D. 1998. What cues do Brown-headed Cowbirds use to locate Red-winged Blackbird nests? Animal Behaviour 55:1181–1189. CONNER, R. N., M. E. ANDERSON, AND J. G. DICKSON. 1986. Relationships among territory size, habitat, song, and nesting success of Northern Cardinals. Auk 103:23–31. COOPER, W. E. 1997. Threat factors affecting antipredatory behavior in the broad-headed skink (Eumeces laticeps): Repeated approach, change in predator path, and predator’s field of view. Copeia 1997:613–619. CRESSWELL , W. 1997. Nest predation: The relative effects of nest characteristics, clutch size and parental behavior. Animal Behaviour 53:93–103. DEARBORN, D. C. 1998. Begging behavior and food acquisition by Brown-headed Cowbird nestlings. Behavioral Ecology and Sociobiology 43: 259–270. EICHHOLZ, M. W., AND W. D. KOENIG. 1992. Gopher snake attraction to birds’ nests. Southwestern Naturalist 37:293–298. FILLIATER, T. S., R. BREITWISCH, AND P. M. NEALEN. 1994. Predation on Northern Cardinal nests: Does choice of nest site matter? Condor 96:761– 768. GOCHFELD, M. 1984. Antipredator behavior: Aggressive and distraction displays of shorebirds. Pages 289–377 in Shorebirds: Breeding Biology and Populations (J. Burger and B. L. Olla, Eds.). Plenum Press, New York. GO¨TMARK, F., D. BLOMQVIST, O. C. JOHANSSON, AND J. BERGKVIST. 1995. Nest site selection: A tradeoff between concealment and view of the surroundings? Journal of Avian Biology 26:305–312. GROSS, A. O. 1953. Northern and Maryland Yellowthroats. Pages 542–565 in Life Histories of North American Wood Warblers, vol. 2 (A. C. Bent, Ed.). Reprint, Dover Publications, New York 1963. HEATWOLE, H. 1968. Relationship of escape behavior and camouflage in anoline lizards. Copeia 1968: 109–113. HOLWAY, D. A. 1991. Nest-site selection and the importance of nest concealment in the Blackthroated Blue Warbler. Condor 93:575–581. HOWLETT, J. S., AND B. J. STUTCHBURY. 1996. Nest concealment and predation in Hooded Warblers: Experimental removal of nest cover. Auk 113: 1–9. KILGO, J. C., R. A. SARGENT, B. R. CHAPMAN, AND K. V. MILLER. 1996a. Nest-site selection by Hooded Warblers in bottomland hardwoods of South Carolina. Wilson Bulletin 108:53–60. KILGO, J. C., R. A. SARGENT, K. V. MILLER, AND B. R. CHAPMAN. 1996b. Nest sites of Kentucky Warblers in bottomland hardwoods of South Carolina. Journal of Field Ornithology 67:300–306.
242
Short Communications
KING, D. I., R. M. DEGRAAF, C. R. GRIFFIN, AND T. J. MAIER. 1999. Do predation rates on artificial nests accurately reflect predation rates on natural bird nests? Journal of Field Ornithology 70: 257–262. LIMA, S. L., AND L. M. DILL. 1990. Behavioral decisions made under the risk of predation: A review and prospectus. Canadian Journal of Zoology 68:619–640. MARTIN, T. E. 1992a. Breeding productivity: What are the appropriate habitat features for management? Pages 455–473 in Ecology and Conservation of Neotropical Migrant Landbirds (J. M. Hagan III and D. W. Johnston, Eds.). Smithsonian Institution Press, Washington, D.C. MARTIN, T. E. 1992b. Interaction of nest predation and food limitation in reproductive strategies. Current Ornithology 9:163–197. MCLEAN, I. G., J. N. M. SMITH, AND K. G. S TEWART. 1986. Mobbing behaviour, nest exposure, and breeding success in the American Robin. Behaviour 96:171–186. MURPHY, M. T., C. L. CUMMINGS, AND M. S. PALMER. 1997. Comparative analysis of habitat selection, nest site and nest success by Cedar Waxwings (Bombycilla cedorum) and Eastern Kingbirds (Tyrannus tyrannus). American Midland Naturalist 138:344–356.
[Auk, Vol. 118
NETER, J., W. WASSERMAN, AND M. H. KUTNER. 1990. Applied Linear Statistical Models. Richard D. Irwin, Homewood, Illinois. RICKLEFS, R. E. 1977. Reactions of some Panamanian birds to human intrusion at the nest. Condor 79: 376–379. SAS INSTITUTE INC. 1990. SAS/STAT Users’ Guide version 6, 4th ed. SAS Institute, Inc., Cary, North Carolina. SCHAUB, R., R. L. MUMME, AND G. E. WOOLFENDEN . 1992. Predation on the eggs and nestlings of Florida Scrub Jays. Auk 109:585–593. SCHMIDT, K. A., AND C. J. WHELAN. 1999. Nest placement and mortality: Is nest predation a random event in space and time? Condor 101:916–920. SOKAL, R. R., AND F. J. ROHLF. 1981. Biometry. W. H. Freeman and Co., San Francisco. STRAUSBERGER, B. M. 1998. Evident nest-searching behavior of female Brown-headed Cowbirds while attended by males. Wilson Bulletin 110: 133–136. THOMPSON, F. R. III, W. DIJAK, AND D. E. BURHANS. 1999. Video Identification of predators at songbird nests in old fields. Auk 116:259–264. YDENBERG, R. C., AND L. M. DILL. 1986. The economics of fleeing from predators. Advances in the Study of Behavior 16:229–249. Received 3 January 2000, accepted 12 September 2000. Associate Editor: B. Loiselle
The Auk 118(1):242–248, 2001
Genetic Monogamy in Wilson’s Storm-Petrel PETRA QUILLFELDT,1,4 TIM SCHMOLL ,1 HANS-ULRICH PETER,1 JO¨RG THOMAS EPPLEN,2 AND THOMAS LUBJUHN3 1 ¨ kologie, Friedrich-Schiller-Universita¨t Jena, Dornburger Str. 159, D-07743 Jena, Germany; Institut fu¨r O 2 Molekulare Humangenetik, Ruhr-Universita¨t Bochum, D-44780 Bochum, Germany; and 3 ¨ kologie, Rheinische Friedrich-Wilhelms-Universita¨t Bonn, Institut fu¨r Evolutionsbiologie und O An der Immenburg 1, D-53121 Bonn, Germany In socially monogamous birds, sperm competition can arise when females seek or accept copulations outside of the pairbond (extrapair copulations, EPCs). EPCs are widespread among socially monogamous birds (e.g. Birkhead 1998), although there is a wide range in the level of extrapair paternity (EPP) within that social mating system, ranging from no extrapair young (EPY), for example in Northern Fulmars (Fulmarus glacialis; Hunter et al. 1992) and Common Loons (Gavia immer; Piper et al. 1997), to over half of the chicks fathered via EPCs, for example 4
E-mail:
[email protected]
in Tree Swallows (Tachycineta bicolor; Kempenaers et al. 1999). The causes for the large interspecific variation in the level of EPP are still poorly understood. A number of studies have tried to explain those differences and have found a positive correlation between EPP and degree of sociality (Møller and Birkhead 1993, but see Westneat and Sherman 1997), divorce rate (Cezilly and Nager 1995), male advertisement (e.g. plumage brightness, Møller and Birkhead 1994), and testis size (Møller and Briskie 1995). However, there are many exceptions to those trends, which suggests that the explanation is more complex (e.g. Rodrigues 1998). As Petrie and Kempenaers
January 2001]
Short Communications
(1998) pointed out, females control success of copulation attempts in most species of birds; thus the level of EPP will depend mainly on costs and direct or indirect benefits associated with EPP for females. If male care is essential, females might be restricted in seeking EPCs if they risk losing the investment of their partner in the brood. A dynamic programming approach on male decisions to invest in or abandon a brood (Mauck et al. 1999) suggested that tolerance of EPP decreases as adult survival increases, such that males of long-lived species should withdraw care to a current brood if any doubt of parentage exists. Seabirds are long-lived birds and, compared with other groups, have received rather little attention in the study of EPP (Gilbert et al. 1998). Seabirds exhibit very high levels of parental investment, and male parental care is indispensable. Because that is true for all species of marine birds, exploitation of the marine environment does not seem to allow lower levels of investment. That may result not only in the general occurrence of social monogamy in seabirds (see Wittenberger and Tilson 1980), but also in a set of comparable breeding and life history parameters (e.g. colonial, long-lived, little or no sexual dimorphism). Thus, if level of paternity in a population depends on one or more of those factors, seabirds should exhibit a uniform level of EPP, and that level of EPP should be low according to the model of Mauck et al. (1999). In this paper, we report results of a DNA fingerprint study of paternity in an Antarctic seabird, Wilson’s Storm-Petrel (Oceanites oceanicus), and try to show whether the level of EPP is indeed uniformly low in seabirds. Study area and methods. Wilson’s Storm-Petrels are the smallest and one of the most abundant Antarctic seabird species. Their breeding biology was summarized by Beck and Brown (1972). They nest in colonies in scree slopes along ice-free Antarctic and sub-Antarctic coasts, where they lay a single egg in a natural cavity. They have a life history typical of a small procellariiform seabird with a long lifespan (mean life expectancy 10.4 years), late onset of breeding (at about 4 to 5 years of age), and high mate fidelity (87%; Beck and Brown 1972, P. Quillfeldt unpubl. data). Wilson’s Storm-Petrels exhibit intensive biparental care. Incubation and chick feeding are shared between sexes. Chicks remain in the nest for about 60 days and are fed during brief nightly visits. Wilson’s Storm-Petrels prey mainly on Antarctic krill (Euphausia superba) during the breeding season, although some fish and amphipods are also taken (P. Quillfeldt unpubl. data). Coloniality and a female ‘‘pre-laying exodus’’ of about 10.7 days to build up reserves for egg formation (Beck and Brown 1972) might create opportunities for sperm competition to occur (see Austin and Parkin 1996). Field work was carried out in the Tres Hermanos colony on King George Island, South Shetland Is-
243
lands (628149S, 588409W) in the maritime Antarctic, in the austral summers of 1995–1996, 1996–1997, and 1997–1998. Nests were marked at the beginning of the breeding season and monitored for eggs and hatching chicks. A total of 63 families were sampled in three consecutive breeding seasons (1995–1996: 27; 1996– 1997: 6; 1997–1998: 30). In the case of eight breeding pairs, two chicks were sampled in different seasons, whereas only one chick of all other pairs was sampled. Adults were captured and individually marked in their burrows between January and February (during incubation) as well as between February and March (during chick rearing). Adults attending burrows during either of those periods were regarded as parents. In four burrows, three adults were captured and sampled. In all of those cases, the putative parents had been captured early in the breeding season during incubation or brooding the very young chick. The third bird, which was captured later in the breeding cycle, was not regarded as a parent. Throughout the paper those birds are called ‘‘additional adults.’’ Blood samples (approximately 50 mL) were taken by puncture of the brachial vein. Samples were immediately suspended in 500 or 1,000 mL APS-buffer (Arctander 1988) or in 70% ethanol (Arctander 1988) and stored at 48C for four to twelve weeks and thereafter at 2208C until processing. DNA was extracted using standard procedures modified according to Miller et al. (1988; for details see Lubjuhn and Sauer 1999). For each sample, approximately 5 to10 mg DNA was digested with 50 U of Hinf I following instructions of the manufacturer. Digests were separated by agarose gel electrophoresis (gel size: 20 3 40 cm, 0.8% agarose, 1–2 V/cm) for 49–50 h in 1 3 TBE buffer (89 mM Tris, 89 mM Boric acid, 2 mM EDTA). After drying, gels were hybridized with 32P-labelled oligonucleotide probe (GGAT)4. Detailed procedures are given in Epplen (1992). All DNA of members of a family including additional adults were run in adjacent gel lanes. Bands were scored by eye within a range from 23.1 to 3 kb and were evaluated considering the criteria proposed in Westneat (1990). Bands in nestling DNA fingerprints that were not attributable to either putative parent were scored, and band-sharing coefficients were calculated according to the formula given in Wetton et al. (1987) as x 5 2 NAB /(NA 1 NB), where NAB is number of shared fragments between individuals A and B and NA and NB are total numbers of fragments in individuals A and B, respectively. Background band-sharing was obtained by comparing breeding birds from different burrows in adjacent lanes. The informativity of DNA fingerprint banding patterns for assigning parentage depends on their variability which, in turn, is determined by the restriction enzyme–oligonucleotide probe combination
244
Short Communications
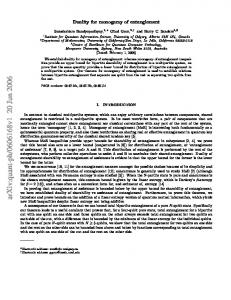
used and the proportion of bands that individuals share by chance. Hinf I digestion of DNA followed by hybridization with the oligonucleotide (GGAT)4 produced banding patterns that were sufficiently variable to be individual-specific. A mean of 38.1 6 5.6 SD (n 5 178) bands per individual was scored. An informativity index I (Krawczak and Lubjuhn 1995) was calculated to quantify the evidential power of the used enzyme–probe combination and to make this study comparable to others. The high value of I 5 48.7 approaches the upper end of a comparative list of informativity indices of 14 DNA fingerprint studies in birds (Lubjuhn and Sauer 1999). The probability P of misassigning parentage to one of the two or both putative parents was calculated following Burke et al. (1989) as P 5 2.6 3 1028 and P 5 7.7 3 10212, respectively. We concluded, therefore, that the enzyme–probe combination used produces sufficiently variable banding patterns to assign parentage in Wilson’s Storm-Petrels unambigously. The four additional adults were sexed using PCR amplification of a highly conserved W-linked gene according to Griffiths et al. (1996), modified for Biometrat-Thermocycler T Gradient. PCR conditions were adjusted and PCR products digested with Hae III overnight. Fragments were separated using agarose gel electrophoresis (gel size 7 3 10 cm, 3% agarose, 9V/cm). Results. Usually, band-sharing coefficients between mates are used to assess proportion of bands that unrelated individuals share by chance (e.g. Mauck et al. 1995, Lubjuhn et al. 1999). However, in this study, the mean band-sharing coefficient between mates differed from that of breeding birds of different nest burrows (see below). Thus, the latter was assumed to reflect the mean background bandsharing and was measured as x 5 0.30 6 0.06 SD (n 5 32). In 51 of 63 chicks investigated, all bands could be attributed to the putative parents. The remaining 12 chicks showed one novel fragment each that was unattributable to either parent. Those single novel fragments were interpreted to result from mutations for several reasons. (1) The mean band-sharing coefficient between putative parents and chicks with no novel fragments in their banding patterns (0.65 6 0.06 SD; min 5 0.48; max 5 0.80; n 5 102) did not differ from that between putative parents and chicks with one novel fragments in their banding patterns (0.65 6 0.08 SD; min 5 0.49; max 5 0.85; n 5 24; ttest: t 5 0.298; df 5 124; P 5 0.77, see also Fig. 1), but both values differed significantly from the mean band-sharing coefficient of breeding birds from different nest burrows (0.30 6 0.06 SD; min 5 0.2; max 5 0.41; n 5 32; t-test vs. putative parents and chicks without novel fragments: t 5 28.15; df 5 132; P , 0.001; t-test vs. putative parents and chicks with one novel fragments: t-test: t 5 19.61; df 5 54; P , 0.001; see also Fig. 1). Furthermore, both distributions of
[Auk, Vol. 118
FIG. 1. Distributions of band-sharing coefficients of putative parents and chicks (separated for chicks with no [102 values] or one [24 values] novel fragment), of adults from different nest burrows (32 values), and of breeding partners (55 values).
band-sharing coefficients for chicks and putative parents did not overlap with that of birds from different nest burrows (Fig. 1). (2) For the restriction enzyme–oligonucleotide probe combination used here, mean expected number of novel fragments can be estimated as 10.2 novel fragments per chick if one putative parent was not the genetic parent (for calculation see Jeffreys et al. 1985, Burke and Bruford 1987). The calculation of that value is based on the background band-sharing found for birds from different nest burrows. To test for possible effects of philopatry, we additionally calculated mean expected number of novel fragments for the case where the genetic father is a first-degree relative of the putative father, using 0.65 as average band sharing of first-degree relatives (see above for adults vs. chicks with no novel fragments). However, even in the case where the genetic father is a first-degree relative of the putative father, an average of 2.92 novel fragments would be expected. (3) All band-sharing values between chicks and putative parents lay in an interval that is typical for first-degree relatives (e.g. 0.3 to 0.9 for Common Gulls [Larus canus], Bukacinska et al. 1998; 0.3 to 0.8 for Coal Tits [Parus ater], Lubjuhn et al. 1999). The mutation rate per fragment, estimated from our data on single novel fragments as 0.005, was also found to be within the range of other DNA fingerprint studies in birds (for calculation and a range from 0.006 to 0.002 see Burke and Bruford 1987, Kempenaers et al. 1992, Decker et al. 1993). Thus, we conclude that neither EPP nor intraspecific brood parasitism occurred in the 63 families sampled for analysis. Mean band-sharing coefficient of mates was 0.36 6 0.08 SD (min 5 0.17; max 5 0.52; n 5 55) and was significantly higher than that of adults from different nest burrows (t-test: t 5 3.90; df 5 85; P , 0.001), although distributions overlapped over a wide range
January 2001]
245
Short Communications
TABLE 1. Occurrence of EPY in seabirds determined by DNA fingerprint studies: Distribution of extrapair offspring (percentage EPP chicks), extrapair copulations (EPCs as percentage of total observed copulations), and mate fidelity (percentage of breeding pairs that survive and re-pair in the following breeding season) among seabird species. Only species were considered for which data on EPC or EPP are available. Species Spheniscus humboldti Eudyptes schlegeli Diomedea exulans Calonectris diomedea Puffinus tenuirostris Fulmarus glacialis Oceanites oceanicus Oceanodroma leucorhoa Phalacrocorax carbo P. aristotelis (1987) P. aristotelis (1989) P. aristotelis (1990, 1991) Catharacta lonnbergi Larus occidentalis Larus canus Larus fuscus Rissa tridactyla Sterna caspia Alca torda Uria aalge a b c
% EPP chicks % EPCs 0 3.8%
0 9–13%a 0 0 0
Mate fidelity
Sphenisciformes 17.9% Procellariiformes 4.6% 100% 97% 83% 2.4% 96% 87% 95% Pelecaniformes 10% 14.1%b 64%
References Schwartz et al. 1999 St Clair et al. 1995 Tomkins 1983 Swatschek et al. 1994 Austin and Parkin 1996 Hunter et al. 1992 thin study Mauck et al. 1995
Gregersen in Møller and Birkhead 1993 18% Graves et al. 1992 14% Graves et al. 1993 almost 0 Graves et al. 1993 Charadriiformes (Laridae, Alcidae only) 0 Miller et al. 1994 0 2.3% Gilbert et al. 1998 b 3.6% 15.7% Bukacinska et al. 1998 0 Chardine 1986 0 Brown 1967 0c 50% Quinn pers. comm.; Cluthbert 1985 3.1% Wagner 1992 5.3% 81% Hatchwell 1988
From two colonies. This figure includes forced EPCs or invasions of the territory by the extrapair male. Pilot study of 7 families.
(Fig. 1). We conclude, therefore, that breeding mates were slightly more closely related to each other than randomly compared breeding birds in the population. It has to be noted, however, that the difference of 0.06 was very small. Four apparently non-parental adults were found in breeding burrows containing chicks (see study area and methods). The mean band-sharing coefficient of those individuals with the attending breeding mates was 0.29 6 0.08 SD (min 5 0.21; max 5 0.43; n 5 8) and did not differ from that of adults from different nest burrows (t-test: t 5 20.43; df 5 38; P 5 0.637), but did differ from that of breeding mates (t-test: t 5 2.44; df 5 61; P , 0.02) and from that of first-degree relatives (values from chicks with no or one novel fragments combined: 0.65 6 0.07 SD, n 5 126; t-test: t 5 14.74; df 5 132; P , 0.001). We conclude, therefore, that those additional adults were unrelated to the attending breeding mates. A molecular analysis of sex revealed that all four birds were males. Discussion. Our results show that in a sample of 63 nestlings of Wilson’s Storm-Petrels from three years, no EPP and no brood parasitism occurred. Thus, Wilson’s Storm-Petrels appear socially and ge-
netically monogamous. The probability that we have overlooked EPPs on the basis of our sample size can be calculated following Mauck et al. (1995). If the true level of EPPs was 5, 10, or 15%, we would have missed EPPs in our sample of n 5 55 (individuals investigated in more than one year included only once) with a probability of 0.06, 0.003, and 0.0001, respectively. Our results agree with other studies of seabirds. As shown in Table 1, EPCs are not uncommon among seabirds, but do not usually constitute a high percentage of the total copulations, and extrapair fertilizations are either low or absent. If breeding systems or life histories of seabirds influence EPP, we expected a uniform level of EPP among species, which was supported by the data (Table 1 on EPP ø 0). Strict genetic monogamy is found in only a small proportion of bird populations, and thus a discussion of the special features of life history leading to strict monogamy may help explain the evolution of EPP patterns within birds. Seabirds generally have a high probability of survival to the next breeding season, and thus offspring of a single breeding season represent a smaller proportion of the potential lifetime reproductive success than do offspring in short-lived
246
Short Communications
species. Any reduction of adult survival by investment in current offspring has a much larger influence on their lifetime reproductive success than in short-lived species. Therefore, long-lived birds such as seabirds should not invest in broods of questionable paternity, as suggested by theory (Mauck et al. 1999) and supported by our data. A further result of our study was a slightly greater genetic relatedness between breeding partners as compared to nonmates. Similar results were found for Cory’s Shearwaters (Calonectris diomedea) (Swatschek et al. 1994). Those results were interpreted as high philopatry by male Cory’s Shearwaters, which could mate with their relatives by chance. In that way, philopatry may lead to clusters of broods with greater genetic relatedness within a colony. But mating with closer relatives might not occur simply by chance. Japanese Quail (Coturnix japonica; Bateson 1980) as well as Pika (Ochotona princeps; Peacock and Smith 1997), for example, mate preferentially with closer relatives and are thought to practice ‘‘optimal outbreeding.’’ However, there are no data available on natal philopatry or on effects of inbreeding or outbreeding on fitness for Wilson’s Storm-Petrels. Additional adults visiting burrows in the chick rearing period are most probably prebreeding birds or failed breeders inspecting burrows for future breeding activities. Because they are not related to the attending breeding mates and because none of the birds has been found breeding in the visited burrows in consecutive seasons, we conclude that those birds are neither primary (e.g. as found in Florida Scrub Jays [Aphelocoma coerulescens]; Quinn et al. 1999) nor secondary (e.g. as found in Pied Kingfishers [Ceryle rudis]; Reyer 1980) helpers-at-the-nest. The visitors appear not have any functional relation to the breeding mates. That explanation is supported by the high proportion of prebreeders visiting the study colony, which can be as high as 80% of birds sampled by mistnetting (Quillfeldt et al. 2000), and by the fact that all four birds under investigation were males, the sex that is assumed to choose the breeding site in the prelaying period (Beck and Brown 1972). Acknowledgments. We wish to thank Dr. R. Dahse, Prof. Dr. K. P. Sauer, J. F. Masello, and Dr. K. Reinhardt for their contributions to this work. This study was partly supported by research grants of the German Research Foundation DFG (PE 454 and LU 572) and by a grant of the state of Thuringia (Landesgraduiertenstipendium). The manuscript benefitted from the comments of V. Bretagnolle and R. A. Mauck. LITERATURE CITED ARCTANDER, P. 1988. Comparative studies on avian DNA restriction fragment length polymorphism analysis: Convenient procedures based on blood
[Auk, Vol. 118
samples from live birds. Journal fu¨r Ornithologie 129:205–216. AUSTIN, J. J., AND D. T. PARKIN. 1996. Low frequency of extrapair paternity in two colonies of the socially monogamous Short-tailed Shearwater Puffinus tenuirostris. Molecular Ecology 5:145–150. BATESON, P. P. G. 1980. Optimal outbreeding and the development of sexual preferences in the Japanese Quail. Zeitschrift fu¨r Tierpsychologie 53: 231–244. BECK, J. R., AND D. W. BROWN. 1972. The biology of Wilsons Storm-Petrel, Oceanites oceanicus (Kuhl), at Signy Island, South Orkney Islands. British Antarctic Survey Scientific Reports 69. BIRKHEAD, T. R. 1998. Sperm competition in birds: Mechanisms and function. Pages 579–622 in Sperm Competition and Sexual Selection (T. R. Birkhead and A. P. Møller, Eds.). Academic Press, San Diego, California. BROWN, R. G. B. 1967. Courtship behaviour in the Lesser Black-backed Gull Larus fuscus. Behaviour 29:122–153. BUKACINSKA, M., D. BUKACINSKI, J. T. EPPLEN, K. P. SAUER, AND T. LUBJUHN. 1998. Low frequency of extra-pair paternity in Common Gulls (Larus canus) as revealed by DNA fingerprinting. Journal fu¨r Ornithologie 139:413–420. BURKE, T., AND M. BRUFORD. 1987. DNA fingerprinting in birds. Nature 327:149–152. BURKE, T., N. B. DAVIES, M. W. BRUFORD, AND B. J. HATCHWELL . 1989. Parental care and mating behaviour of polyandrous Dunnocks Prunella modularis related to paternity by DNA-fingerprinting. Nature 338:249–251. CEZILLY, F., AND R. G. NAGER. 1995. Comparative evidence for a positive association between divorce and extra-pair paternity in birds. Proceedings of the Royal Society of London Series B 262:7–12. CHARDINE, J. W. 1986. Interference of copulation in a colony of marked Black-legged Kittiwakes. Canadian Journal of Zoology 64:1416–1421. CUTHBERT, F. J. 1985. Mate retention in the Caspian Tern. Condor 87:74–78. DECKER, M. D., P. G. PARKER, D. J. MINCHELLA , AND K. N. RABENOLD. 1993. Monogamy in Black Vultures: Genetic evidence from DNA fingerprinting. Behavioral Ecology 4:29–35. EPPLEN, J. T. 1992. The methodology of multilocus DNA fingerprinting using radioactive or nonradioactive oligonuecleotide probes specific for simple repeat motifs. Pages 59–112 in Advances in Electrophoresis, vol. 5 (A. Chrambach, M. J. Dunn, and B. J. Radola, Eds.). VCH, Weinheim, Germany. GILBERT, L., T. BURKE, AND A. KRUPA. 1998. No evidence for extrapair paternity in the Western Gull. Molecular Ecology 7:1549–1552. GRAVES, J., R. T. HAY, M. SCALLAN, AND S. ROWE. 1992. Extrapair paternity in the Shag, Phalocro-
January 2001]
Short Communications
corax aristotelis, as determined by DNA fingerprinting. Journal of Zoology (London) 226:399– 408. GRAVES, J., J. O RTEGA-RUANO, AND P. J. B. SLATER. 1993. Extrapair copulation and paternity in Shags: Do females choose better males? Proceedings of the Royal Society of London Series B 253:3–7. GRIFFITHS, R., S. DAAN, AND C. DIJKSTRA. 1996. Sex identification in birds using two CHD genes. Proceedings of the Royal Society of London Series B 263:1251–1256. HATCHWELL , B. J. 1988. Intraspecific variation in extrapair copulation and mate defense in Common Guillemots Uria aalge. Behaviour 107:157–185. HUNTER, F. M., T. BURKE, AND S. E. WATTS. 1992. Frequent copulations as a method of paternity assurance in the Northern Fulmar. Animal Behaviour 44:149–156. JEFFREYS, A. J., V. WILSON, AND S. L. THEIN. 1985. Individual-specific ‘‘fingerprints’’ of human DNA. Nature 314:67–73. KEMPENAERS, B., B. CONGDON, P. BOAG, AND R. J. ROBERTSON . 1999. Extrapair paternity and egg hatchability in Tree Swallows: Evidence for the genetic compatibility hypothesis? Behavioral Ecology 10:304–311. KEMPENAERS, B., G. R. V ERHEYEN, M. VAN DEN BROECK, T. BURKE, C. VAN BROECKHOVEN, AND A. A. DHONDT. 1992. Extra-pair paternity results from female preference for high-quality males in the Blue Tit. Nature 357:494–496. KRAWCZAK, M., AND T. LUBJUHN. 1995. An informativity index for multilocus DNA fingerprinting. Electrophoresis 16:16–21. LUBJUHN, T., T. GERKEN, J. BRU¨N, AND J. T. EPPLEN. 1999. High frequency of extrapair paternity in the Coal Tit. Journal of Avian Biology 30:229– 233. LUBJUHN, T., AND K. P. SAUER. 1999. DNA fingerprinting and profiling in behavioural ecology. Pages 39–52 in DNA Profiling and DNA Fingerprinting (J. T. Epplen and T. Lubjuhn, Eds.). Birkha¨user Verlag, Basel, Switzerland. MAUCK, R. A., E. A. MARSHALL, AND P. G. PARKER. 1999. Adult survival and imperfect assessment of parentage: Effects on male parenting decisions. American Naturalist 154:99–109. MAUCK, R. A., T. A. WAITE, AND P. G. PARKER. 1995. Monogamy in Leach’s Storm-Petrel: DNA-fingerprinting evidence. Auk 112:473–482. MILLAR, C. D., I. ANTHONY, D. M. LAMBERT, P. M. STAPLETON , C. C. BERGMANN, A. R. BELLAMY, AND E. C. YOUNG . 1994. Patterns of reproductive success determined by DNA fingerprinting in a communally breeding oceanic bird. Biological Journal of the Linnean Society 52:31–48. MILLER, S. A., D. D. DYKES, AND H. F. POLESKY. 1988. A simple salting out procedure for extracting
247
DNA from human nucleated cells. Nucleic Acids Research 16:1215. MøLLER, A. P., AND T. R. BIRKHEAD. 1993. Cuckoldry and sociality: A comparative study of birds. American Naturalist 142:118–140. MøLLER, A. P., AND T. R. BIRKHEAD. 1994. The evolution of plumage brightness is related to extrapair paternity. Evolution 48:1089–1110. MøLLER, A. P., AND J. V. BRISKIE. 1995. Extra-pair paternity, sperm competition and the evolution of testis size in birds. Behavioral Ecology and Sociobiology 36:357–365. PEACOCK, M. M., AND A. T. SMITH. 1997. Nonrandom mating in pikas Ochotona princeps: Evidence for inbreeding between individuals of intermediate relatedness. Molecular Ecology 6:801–811. PETRIE, M., AND B. KEMPENAERS. 1998. Extrapair paternity in birds: Explaining variation between species and populations. Trends in Ecology and Evolution 13:52–58. PIPER, W. H., D. C. EVERS, M. W. MEYER, K. B. TISCHLER , J. D. K APLAN, AND R. C. F LEISCHER . 1997. Genetic monogamy in the Common Loon (Gavia immer). Behavioral Ecology and Sociobiology 41: 25–31. QUILLFELDT, P., T. SCHMOLL, AND H.-U. PETER, 2000. The use of foot web coloration for the estimation of prebreeder numbers in Wilson’s Storm-Petrels, Oceanites oceanicus. Polar Biology 23:802– 804. QUINN, J. S., G. E. WOOLFENDEN, J. W. FITZPATRICK, AND B. N. WHITE . 1999. Multilocus DNA fingerprinting supports genetic momogamy in Florida Scrub-Jays. Behavioral Ecology and Sociobiology 45:1–10. REYER, H.-U. 1980. Flexible helper structure as an ecological adaptation in the Pied Kingfisher, Ceryle rudis rudis L. Behavioral Ecology and Sociobiology 6:219–227. RODRIGUES, M. 1998. No relationship between territory size and the risk of cuckoldry in birds. Animal Behaviour 55:915–923. SCHWARTZ, M. K., D. J. BONESS , C. M. SCHAEFF, P. MAJLUF, E. A. PERRY , AND R. C. FLEISCHER. 1999. Female-solicited extrapair matings in Humboldt Penguins fail to produce extrapair fertilizations. Behavioral Ecology 10:242–250. ST CLAIR, C. C., J. R. WAAS, R. C. S T CLAIR, AND P. T. BOAG. 1995. Unfit mothers? Maternal infanticide in Royal Penguins. Animal Behaviour 50:1177– 1185. SWATSCHEK, I., D. RISTOW, AND M. WINK. 1994. Mate fidelity and parentage in Cory’s Shearwater Calonectris diomedea—Field studies and DNA fingerprinting. Molecular Ecology 3:259–262. TOMKINS, R. J. 1983. Fertilization of Wandering Albatross eggs on Macquarie Island. Notornis 30: 244–246.
248
Short Communications
WAGNER, R. H. 1992. Confidence of paternity and parental effort in Razorbills. Auk 109:556–562. WESTNEAT, D. F. 1990. Genetic parentage in the Indigo Bunting: A study using DNA fingerprinting. Behavioral Ecology and Sociobiology 27:67– 76. WESTNEAT, D. F., AND P. W. SHERMAN. 1997. Density and extrapair fertilizations in birds: A comparative analysis. Behavioral Ecology and Sociobiology 41:205–215.
[Auk, Vol. 118
WETTON, J. H., R. E. CARTER, D. T. PARKIN, AND D. WALTERS. 1987. Demographic study of a wild House Sparrow population by DNA fingerprinting. Nature 327:147–149. WITTENBERGER, J. L., AND R. L. TILSON. 1980. The evolution of monogamy: Hypotheses and evidence. Annual Reviews of Ecology and Systematics 11:197–232. Received 21 October 1999, accepted 12 September 2000. Associate Editor: F. Sheldon
The Auk 118(1):248–255, 2001
Adenylate Kinase Intron 5: A New Nuclear Locus for Avian Systematics LEO H. SHAPIRO1 AND JOHN P. DUMBACHER Molecular Genetics Lab, National Zoological Park, 3001 Connecticut Avenue NW, Washington, D.C. 20008, USA The explosion of use of the polymerase chain reaction (PCR) and direct DNA sequencing in recent years has provided a wealth of new data for avian systematists. Nearly all these sequence data, however, have come from mitochondrial genes, which are inherited as a single unit, typically exhibit strictly matrilineal inheritance, and have other unusual properties (Avise 1991). Although mitochondrial DNA (mtDNA) has well-established advantages for phylogenetic inference (Moore 1995), avian molecular systematists are eager to identify nuclear genes that could provide independent phylogenetic estimates (e.g. Prychitko and Moore 1997, Omland 1999). Most nuclear loci explored to date are slowly evolving protein coding genes and have been useful primarily for resolving deep relationships (e.g. relationships among taxa with divergence times more than 50 Ma ago; Graybeal 1994, but see Lovette and Bermingham 2000). It would clearly be helpful to have at our disposal nuclear DNA sequences that exhibit a faster rate of evolution, making them phylogenetically useful at intermediate and shallow taxonomic levels (e.g. Palumbi 1996, Prychitko and Moore 1997). Nuclear introns, for example, which have recently received attention for their potential utility in population-level studies (e.g. Friesen et al. 1997, Heslewood et al. 1998), may also be very useful for inferring phylogenetic relationships among species. Although these introns typically evolve more quickly 1 Present Address: Division of Insect Biology, ESPM, 201 Wellman Hall, 3112, University of California, Berkeley, CA 94720-3112, USA. E-mail: lshapiro@ nature.berkeley.edu
than nuclear protein coding regions, they can nevertheless evolve significantly more slowly than protein coding mtDNA, and might therefore be especially helpful in resolving nodes at depths for which the signal from mtDNA is diminished due to saturation. Despite their potential utility, nuclear genes have so far been little used in sequence-based avian systematics. This is in large part because of a lack of appropriate PCR primers that work well across a broad spectrum of avian groups and that amplify sequences evolving at rates suitable for addressing a range of phylogenetic questions. In the course of a phylogenetic investigation of the pitohuis (J. Dumbacher unpubl. data), we explored the usefulness of a nuclear gene not previously employed for phylogenetic analysis. In this note, we report primers we have designed to amplify this new nuclear marker, intron 5 of the nuclear gene cytosolic adenylate kinase (AK1), and we document both the potential phylogenetic utility of this intron and the very broad taxonomic utility of these primers. Methods. PCR primers located in the conserved exon regions flanking AK1 intron 5 (in exon 5 and exon 6) were designed by comparing complete AK1 DNA sequences published for Gallus (Suminami et al. 1988) and humans (Matsuura et al. 1989), as well as amino acid sequences for several other taxa. Primer sequences and positions are given in Table 1. The other known members of the well-studied AK gene family differ in sequence so substantially from AK1, including the regions of primer annealing, that we are confident the primers reported here will amplify only AK1 (barring a recent gene duplication within
January 2001]
249
Short Communications
TABLE 1. Primers for amplifying AK1 intron 5 from birds. AK5a1 and AK5b1 are located in exon 5 and the remaining three primers are located in exon 6. ‘‘Nucleotide position’’ refers to the position of the primer in the published Gallus AK1 sequence (Suminami et al. 1988). Primers AK5a1, AK6d2, and AK6e2 were not used to collect any of the data reported in this paper, but preliminary studies suggest that these primers work well in at least some taxa, so we have included them here. Primer name AK5a1 AK5b1 AK6c2 AK6d2 AK6e2
Primer sequence (59 to 39)
Nucleotide position 4769 4820 5454 5507 5529
ATGCTGCGGGACGCCATGTTGG ATTGACGGCTACCCTCGCGAGGTG CACCCGCCCGCTGGTCTCTCC GTTCGGTAGCCTTGTAGTACGTCTCC CCTTGTAGAAGGCGATGACGGGTTC
lineages). To investigate the taxonomic breadth for which those primers are useful, we used the primer pair AK5b1 and AK6c2 to amplify and sequence approximately 500 to 650 base pairs (bp) of AK1 from representatives of 10 avian families in 7 orders. This amplification product includes intron 5 (ranging in length from about 350 to 500 bp among the taxa we sampled) and 99 bp of flanking exon (27 bp at the 59 end and 72 bp at the 39 end, excluding primers). DNA was extracted using standard phenol–chloroform extractions (Hillis et al. 1996) or using QIAGEN DNeasy Tissue Kits. DNA amplification of AK1 intron 5 was carried out in an MJ Research PTC-200 thermal cycler using the following program: 948C (10 min)—35 cycles of 928C (45 s), ramp of 1.58C/s to 548C, 548C (1 min), ramp of 1.58C/s to 728C, 728C (1
to to to to to
4790 4843 5474 5532 5553
min)–728C (5 min). Our PCR reaction mix contained magnesium chloride (1.5 mM), primers (0.4 mM each), dNTPs (0.2 mM each) and 1 U Perkin Elmer AmpliTaq Gold DNA polymerase (for a 25 mL reaction) with the supplied buffer. PCR products were cleaned using QIAGEN QIAquick PCR Purification Kits and cycle sequenced in both directions using an ABI PRISM cycle sequencing kit. Sequenced products were cleaned using Princeton Separations CentriSep columns and run out on an ABI 373 automated sequencer. For purposes of comparison, we amplified both AK1 intron 5 (using AK5b1 and AK6c2, as well as several additional primers designed specifically to pachycephalids) and the well-studied mitochondrial gene cytochrome-b from 17 individuals representing
TABLE 2. The 7 avian orders and 10 families from which we have amplified and sequenced AK1 intron 5 from one or more species to demonstrate taxonomic breadth of primers. Orders and families follow Gill (1995); scientific and English species names follow the 7th edition of the Checklist of North American Birds (AOU 1998) for species occurring in North or Middle America, and Monroe and Sibley (1993) for all others. The 12 species used for the phylogenetic component of this study are indicated by asterisks. Order Sphenisciformes Ciconiiformes Falconiformes
Family
Gruiformes
Spheniscidae Threskiornithidae Accipitridae Falconidae Rallidae
Psittaciformes Caprimulgiformes Passeriformes
Psittacidae Aegothelidae Pachycephalidae
Paradisaeidae Emberizidae
Species (partial list) Galapagos Penguin (Spheniscus mendiculus) Glossy Ibis (Plegadis falcinellus) Rough-legged Hawk (Buteo lagopus) Aplomado Falcon (Falco femoralis) White-winged Coot (Fulica leucoptera) Common Moorhen (Gallinula chloropus) Virginia Rail (Rallus limicola) Buff-spotted Flufftail (Sarothrura elegans) Grey Parrot (Psittacus erithacus) Feline Owlet-nightjar (Aegotheles insignis) Little Shrike-thrush (Colluricincla megarhyncha)* Golden Whistler (Pachycephala pectoralis)* Regent Whistler (Pachycephala schlegelii)* Sclater’s Whistler (Pachycephala soror)* Hooded Pitohui (Pitohui dichrous)* Variable Pitohui (Pitohui kirhocephalus)* Mottled Whistler (Rhagologus leucostigma)* Magnificent Bird-of Paradise (Cicinnurus magnificus)* Greater Melampitta (Melampitta gigantea)* Raggiana Bird-of-Paradise (Paradisaea raggiana)* Bronzed Cowbird (Molothrus aeneus)* Brown-headed Cowbird (Molothrus ater)*
250
Short Communications
FIG. 1. Cytochrome-b pairwise distances versus AK1 intron 5 pairwise distances. Note saturation of cytochrome-b relative to AK1. HKY-corrected distances (Hasegawa et al. 1985) were calculated using PAUP* 4.0b4a (Swofford 1999).
7 species of Pachycephalidae, 3 species of Paradisaeidae, and (as an outgroup) 2 species of Emberizidae (Table 2). For the analyses presented here we used, wherever possible, 420–440 bp each of both AK1 intron 5 and cytochrome-b, but a few sequences are shorter than this. Sequences were easily aligned by eye (Appendix 1). We calculated genetic distances and generated maximum-parsimony trees using PAUP 4.0b4a (Swofford 1999). HKY85 distances were calculated omitting gaps (and other missing or ambiguous positions) from affected pairwise comparisons. Parsimony analyses were performed using the heuristic search option with tree bisection and reconnection (TBR) and 200 random addition sequence replicates. Node support was evaluated using nonparametric bootstrapping (1,000 replicates). Results. We amplified and sequenced AK1 intron 5 from one or more representatives of 10 families in 7 avian orders (Table 2; see Appendix 2 for GenBank accession numbers and specimen voucher numbers). Many taxa we attempted to amplify provided clean sequences with no need to redesign primers or gelpurify bands, and the remainder sequenced nicely with minor additional effort. Although double sequence is apparent at a few nucleotide positions (probably due to heterozygosity, but conceivably representing an undetected recent gene duplication), these sites are infrequent and appear not to be a problem for interspecific analyses. For pachycephalid, paradisaeid, and emberizid sequences, to which we limited our phylogenetic analysis, plotting pairwise distances for cytochrome-b versus AK1 intron 5 suggests that for relatively re-
[Auk, Vol. 118
FIG. 2. Transitions (T i) and transversions (T v) versus uncorrected pairwise p-distances (T i 1 T v, scaled) for AK1 intron 5. AK1 shows no indication of saturation even at rather deep divergences. Substitutions were tallied and distances calculated using PAUP* 4.0b4a (Swofford 1999).
cently diverged taxa, AK1 intron 5 exhibits a substitution rate several times slower than cytochrome-b, but this difference is effectively reduced for deeper divergences as cytochrome-b saturates relative to AK1 (Fig 1). This saturation indicates the potential for extensive homoplasy that can seriously degrade phylogenetic signal (Griffiths 1997). AK1 shows no indication of saturation even at rather deep divergences (Fig. 2). AK1 intron 5 had fewer variable and parsimony-informative sites than did cytochrome-b, but it also exhibited substantially less homoplasy (Table 3). Our parsimony analysis using AK1 intron 5 produces a tree topology that for more recently diverged taxa is similar to that resulting from our analysis using cytochrome-b, but there are several substantial disagreements, especially with respect to deeper nodes (Fig. 3). Both AK1 and cytochrome-b recover monophyletic species groupings wherever conspecific sequences are included in the data set. They also recover both of the genera that are represented by more than one species (i.e. Pitohui and Pachycephala, the former clade being recovered with similarly very high bootstrap support by both genes, the latter being supported more consistently by AK1). With respect to relationships among genera, both AK1 and cytochrome-b recover the groupings (Colluricincla 1 Pachycephala), (Cicinnurus 1 Paradisaea), and ((Cicinnurus 1 Paradisaea) 1 Melampitta), with AK1 exhibiting in each case substantially higher bootstrap support than does cytochrome-b. The AK1 and cytochrome-b tree topologies conflict in the
January 2001]
Short Communications
251
placement of Rhagologus and in the relationships among the three included Pachycephala species, as well as with respect to deeper relationships among the groups just discussed, but none of these nodes is strongly supported by either gene (this may be a consequence of the relatively sparse taxon sampling in the data set). Resolution of these relationships will be attempted elsewhere in a more comprehensive analysis (J. Dumbacher unpubl. data). Our purpose here is simply to demonstrate that AK1 intron 5 contains substantial phylogenetic signal and warrants further exploration by avian phylogeneticists. A striking feature of nuclear intron sequences that is rarely seen in sequence from protein coding mitochondrial genes is the presence of insertions and deletions (indels). Indels in introns can be valuable for phylogenetic inference because homoplasy in the form of reversals or convergent gains is very unlikely (however, excessive insertion or deletion activity can make alignment of sequences from distantly related taxa difficult or impossible). We have found parsimony-informative indels in several AK1 intron 5 data sets with which we have been working. In the dataset presented here, there are eight indels (Appendix 1). Five indels distinguish the two emberizids from the other taxa (two 1 bp deletions, one 1 bp insertion, and two 2 bp insertions in the two congeneric emberizids relative to the other taxa), and a sixth indel, a 2 bp deletion, is shared only by the three species of Pachycephala. The remaining two indels are unique to single taxa in our small data set, Cicinnurus (with a 5 bp insertion relative to the other taxa) and Paradisea (with a 68 bp deletion—which overlaps the Pachycephala deletion, the Cicinnurus insertion, and one of the emberizid insertions—relative to the other taxa). Because the issue of how best to use indels in phylogenetic analyses is not straightforward, in the analysis presented here we have simply treated gaps as missing data, but it seems clear that some of these indels contain useful phylogenetic information. Discussion. Avian systematists have recently begun looking toward nuclear genes for at least two reasons. First, different nuclear loci (or classes of loci) may have rates of evolution that make them well suited to addressing phylogenetic questions at different depths of divergence. For example, some slowly evolving protein coding genes may be useful for determining relationships among deeply diverged groups as a consequence of their relatively high sig-
← FIG. 3. Maximum-parsimony trees constructed for the same set of taxa using (A) AK1 intron 5 and (B) cytochrome-b (see text for details). Numbers above branches indicate bootstrap support for subtended clades (from 1,000 replicates).
252
Short Communications
[Auk, Vol. 118
TABLE 3. Proportion of sites variable and proportion of sites parsimony-informative for AK1 intron 5 and cytochrome-b sequences included in our analysis, and measures of homoplasy (calculated excluding uninformative sites) for maximum-parsimony trees.
Proportion of sites variable Proportion of sites parsimony-informative Consistency Index Retention Index Rescaled Consistency Index
nal-to-noise ratio at those depths (Graybeal 1994, Groth and Barrowclough 1999). In contrast, introns such as AK1 intron 5 may be most useful at intermediate depths—depths at which homoplasy may be a serious problem for rapidly evolving mitochondrial genes, but at which nuclear protein coding genes have accumulated few differences. A second major reason that systematists are interested in utilizing nuclear sequences is that mtDNA evolves as a single linkage group, and distinguishing individual gene trees from species trees by obtaining multiple independent estimates of phylogenetic histories can be extremely important. For example, although the mitochondrial genome is expected to be generally less prone to lineage sorting problems than are nuclear genes (Moore 1995; but see Hoelzer 1997, Moore 1997), surveying nuclear loci is nevertheless necessary to investigate the possibility of mitochondrial introgression through hybridization when there is a conflict between putative mitochondrial trees and other character sets. Nuclear loci such as AK1 intron 5 are needed to test phylogenies based on mtDNA. It is well known that selective constraints and rates of evolution across a particular sequence of DNA may be quite heterogeneous. This phenomenon has been thoroughly documented for cytochrome-b (Griffiths 1997), and it is possible that analogous heterogeneity occurs even within the noncoding AK1 intron 5 (for example, there may be regions in which indels occur more or less frequently). The analysis we present here is not intended as an exhaustive comparison of patterns of evolution in AK1 intron 5 and cytochrome-b, but rather is meant simply to demonstrate the phylogenetic utility of AK1 intron 5 and to encourage avian phylogeneticists to further explore the usefulness of this new marker. With respect to current avian taxonomy, it appears that AK1 may perform well in recovering relationships among intermediate to distantly related congeneric species and among genera (with unexplored potential for examining relationships among families within orders), and the presence of indels that are easily aligned at this level may provide a valuable source of phylogenetic information. However, for inferring relationships among taxa with quite recent divergence times, AK1 intron 5 may evolve too slowly. At higher
AK1 intron 5
Cytochrome-b
0.23 0.17 0.89 0.95 0.84
0.35 0.26 0.53 0.65 0.35
levels, this intron will probably not be useful for inferring relationships (e.g. among avian orders) because of multiple insertions and deletions, which cause difficulties with sequence alignment among some orders (L. Shapiro unpubl. data). Progress in the exploration of nuclear genetic markers for avian phylogenetics has been seriously impeded by the lack of widely applicable PCR primers. Given their demonstrated taxonomic versatility and promising phylogenetic utility, the primers described here should prove to be a valuable addition to the toolbox of the avian molecular systematist. Acknowledgments. L.H.S. was supported by an NSF postdoctoral fellowship and J.P.D. was supported by Smithsonian Institution and FONZ postdoctoral fellowships. We thank A. Bely for technical advice; E. Draper for laboratory assistance; and K. Omland, B. Slikas, R. Fleischer, A. Bely, F. Sheldon, and two anonymous reviewers for helpful comments on the manuscript. For access to tissue samples, we thank L. Christidis, R. Fleischer, P. Luscomb, A. Mack, C. McIntosh, G. Miller, D. Mindell, E. Pincus, B. Slikas, A. Smith, P. Warren, the Academy of Natural Sciences of Philadelphia, the Field Museum of Natural History (Chicago), the Honolulu Zoo, the Laboratory of Molecular Systematics (Smithsonian Institution), the Museum of Victoria (Australia), the Papua New Guinea National Museum and Art Gallery, the Peregrine Fund, the U.S. National Museum of Natural History, the Wau Ecology Institute, and the Wildlife Conservation Society. We are particularly grateful to R. Fleischer for providing laboratory space and resources for pursuing this work. The Scholarly Studies Program and the Nelson Fund of the Smithsonian Institution provided funds for laboratory supplies. LITERATURE CITED AMERICAN ORNITHOLOGISTS ’ UNION. 1998. Checklist of North American Birds, 7th ed. American Ornithologists’ Union, Washington, D.C. AVISE, J. C. 1991. Ten unorthodox perspectives on evolution prompted by comparative population genetic findings on mitochondrial DNA. Annual Review of Genetics 25:45–69.
January 2001]
Short Communications
FRIESEN, V. L., B. C. CONGDON, H. E. WALSH, AND T. P. BIRT. 1997. Intron variation in Marbled Murrelets detected using analyses of single-stranded conformational polymorphisms. Molecular Ecology 6:1047–1058. GILL, F. B. 1995. Ornithology, 2nd ed. W. H. Freeman and Company, New York. GRAYBEAL, A. 1994. Evaluating the phylogenetic utility of genes: A search for genes informative about deep divergences among vertebrates. Systematic Biology 43:174–193. GRIFFITHS, C. S. 1997. Correlation of functional domains and rates of nucleotide substitution in cytochrome b. Molecular Phylogenetics and Evolution 7:352–365. GROTH, J. G., AND G. F. BARROWCLOUGH. 1999. Basal divergences in birds and the phylogenetic utility of the nuclear RAG-1 gene. Molecular Phylogenetics and Evolution 12:115–123. HASEGAWA, M., H. KISHINO, AND T. YANO. 1985. Dating of the human-ape splitting by a molecular clock of mitochondrial DNA. Journal of Molecular Evolution 22:160–174. HESLEWOOD, M. M., M. S. ELPHINSTONE, S. C. TIDEMANN, AND P. R. B AVERSTOCK . 1998. Myoglobin intron variation in the Gouldian Finch Erythrura gouldiae assessed by temperature gradient gel electrophoresis. Electrophoresis 19:142–151. HILLIS, D. M., B. K. MABLE, A. LARSON , S. K. DAVIS, AND E. A. ZIMMER . 1996. Nucleic acids IV: Sequencing and cloning. Pages 321–381 in Molecular Systematics, 2nd ed. (D. M. Hillis, C. Moritz, and B. K. Mable, Eds.). Sinauer Associates, Sunderland, Massachusetts. HOELZER, G. A. 1997. Inferring phylogenies from mtDNA variation: Mitochondrial-gene trees versus nuclear-gene trees revisited. Evolution 51: 622–626. LOVETTE, I. J. AND E. BERMINGHAM . 2000. c-mos variation in songbirds: Molecular evolution, phylogenetic implications, and comparisons with
253
mitochondrial differentiation. Molecular Biology and Evolution 17:1569–1577. MATSUURA, S., M. I GARASHI, Y. TANIZAWA, M. YAMADA , F. K ISHI , T. K AJII , H. F UJII , S. M IWA, M. SAKURAI, AND A. NAKAZAWA. 1989. Human adenylate kinase deficiency associated with hemolytic anemia. A single base substitution affecting solubility and catalytic activity of the cytosolic adenylate kinase. Journal of Biological Chemistry 264:10148–10155. MONROE, B. L., JR., AND C. G. SIBLEY. 1993. A World Checklist of Birds. Yale University Press, New Haven, Connecticut. MOORE, W. S. 1995. Inferring phylogenies from mtDNA variation: Mitochondrial-gene trees versus nuclear-gene trees. Evolution 49:718–726. MOORE, W. S. 1997. Mitochondrial-gene trees versus nuclear-gene trees, a reply to Hoelzer. Evolution 51:627–629. OMLAND, K. 1999. Review of ‘‘Avian molecular evolution and systematics’’. Systematic Biology 48: 225–226. PALUMBI, S. R. 1996. Nucleic acids II: The polymerase chain reaction. Pages 205–247 in Molecular Systematics, 2nd ed. (D. M. Hillis, C. Moritz, and B. K. Mable, Eds.). Sinauer Associates, Sunderland, Massachusetts. PRYCHITKO, T. M., AND W. S. MOORE. 1997. The utility of DNA sequences of an intron from the B-fibrinogen gene in phylogenetic analysis of woodpeckers (Aves: Picidae). Molecular Phylogenetics and Evolution 8:193–204. SUMINAMI, Y., F. KISHI, T. TORIGOE, AND A. NAKAZAWA . 1988. Structure and complete nucleotide sequence of the gene encoding chicken adenylate kinase. Journal of Biochemistry 103:611–617. SWOFFORD, D. L. 1999. PAUP* 4.0b4a: Phylogenetic Analysis Using Parsimony. Sinauer Associates, Sunderland, Massachusetts. Received 21 September 1999, accepted 5 October 2000. Associate Editor: F. Sheldon
254
Short Communications
[Auk, Vol. 118
APPENDIX 1. Alignment of AK1 intron 5 sequences for which we calculated genetic distances and constructed parsimony trees. A period in a column indicates that the same nucleotide appears in that position as at the top of the column; a dash indicates a gap.
January 2001]
255
Short Communications
APPENDIX 1.
Continued.
APPENDIX 2.
Voucher and accession numbers for tissue samples and DNA sequences used in this study.
Species
Tissue/skin voucher or field numbera
Spheniscus mendiculus Plegadis falcinellus Buteo lagopus Falco femoralis Fulica leucoptera Gallinula chloropus Rallus limicola Sarothrura elegans Psittacus erithacus Aegotheles insignis Colluricincla megarhyncha A Colluricincla megarhyncha B Pachycephala pectoralis Pachycephala schlegelii Pachycephala soror Pitohui dichrous A Pitohui dichrous B Pitohui dichrous C Pitohui kirhocephalus A Pitohui kirhocephalus B Pitohui kirhocephalus C Rhagologus leucostigma Cicinnurus magnificus Melampitta gigantea Paradisaea raggiana Molothrus aeneus Molothrus ater
none ANSP 3835 (tissue) none none LMS B02782 (tissue), USNM 614599 (skin) FMNH 364658 (skin) ANSP 5478 (tissue), ANSP 187132 (skin) FMNH 346189 (skin) none AM 857c 042-01128d JD93016e MV1419 CEM4f CEM11f 051-87052d 051-87069d JD93021e 062-38831d 062-38833d IK01e CEM19f ZOO90g JD97001MGe ZOO65g 1142-80938h none
GenBank accession numberb AF307894 AF307896 AF307891 AF307890 AF307898 AF307899 AF307900 AF307902 AF307895 AF307897 AF308743, AF308744, AF308745, AF308746, AF308747, AF308748, AF308749, AF308750, AF308751, AF308752, AF308753, AF308754, AF308755, AF308756, AF308757, AF308758, AF308759,
AF308760 AF308761 AF308762 AF308763 AF308764 AF308765 AF308766 AF308767 AF308768 AF308769 AF308770 AF308771 AF308772 AF308773 AF308774 AF308775 AF308776
a none 5 no voucher taken (contact authors for available information); ANSP 5 Academy of Natural Sciences of Philadelphia; LMS 5 Laboratory of Molecular Systematics, Smithsonian Institution; USNM 5 U.S. National Museum of Natural History; FMNH 5 Field Museum of Natural History (Chicago); MV 5 Museum of Victoria (Australia). b First GenBank number listed is for adenylate kinase intron 5; second number, if present, is for cytochrome-b. c Field number of vouchers that will be accessioned at the Bishop Museum, Honolulu (skin) and the University of Kansas Natural History Museum (tissue). d Band numbers of birds banded under the Australian Bird and Bat Banding Scheme. e Field numbers of vouchers that will be accessioned in the Papua New Guinea National Museum and Art Gallery. f Field numbers of birds caught and released in protected areas. g Zoo band numbers of captive birds at the Wau Ecology Institute. h U.S. Bird Banding Laboratory band number.