Published December 5, 2014
Genetic parameters and predicted selection results for maternal traits related to lactation efficiency in sows R. Bergsma,*†1 E. Kanis,† M. W. A. Verstegen,‡ and E. F. Knol* *Institute for Pig Genetics (IPG), PO Box 43, 6640 AA Beuningen, the Netherlands; †Animal Breeding and Genomics Centre, Wageningen University, PO Box 338, 6700 AH Wageningen, the Netherlands; and ‡Animal Nutrition Group, Wageningen University, PO Box 338, 6700 AH Wageningen, the Netherlands
ABSTRACT: The increased productivity of sows increases the risk of a more pronounced negative energy balance during lactation. One possibility to prevent this is to increase the lactation efficiency (LE) genetically and thereby increase milk output for a given feed intake and mobilization of body tissue. The benefits of selection for LE depend on its heritability and the relationships with other traits of interest. The objectives of this study were to estimate genetic parameters for LE, its underlying traits, and to predict the consequences of current selection strategies in dam lines. Data from 4 farms were available to estimate genetic parameters. Heritabilities were estimated by using a univariate repeatability model, and genetic correlations were estimated bivariately. Selection index theory was used to predict the genetic progress by 3 alternative breeding programs: 1) a breeding program that aimed at balanced progress in the total number of piglets born, piglet mortality, and percent prolonged interval from weaning to estrus; 2) extension of this breeding goal with LE; and 3) a breeding goal that included only one selection criterion, litter weight gain, to demonstrate the effect of indirect selection for milk production. The heritability for LE was low (0.12). Body fat mass (0.52) and BW
(0.45) of sows at the beginning of lactation showed the greatest heritabilities. Protein mass at the beginning of lactation, protein loss, weight loss, and ad libitum feed intake during lactation showed moderate heritabilities (0.39, 0.21, 0.20, and 0.30, respectively). Low to moderate heritabilities were found for litter weight at birth, within-litter SD in the birth weight of piglets, litter weight gain, fat loss, and restricted feed intake during lactation (0.19, 0.09, 0.18, 0.05, and 0.14, respectively). Within-litter SD in the weaning weight of piglets showed no genetic variability. It was predicted that a breeding goal for dam lines with an emphasis on the total number of piglets born, piglet mortality, and percent prolonged interval from weaning to estrus would not dramatically change BW or body composition at the beginning of lactation, or mobilization of body tissue and feed intake during lactation. Inclusion of LE in the breeding goal will improve stayability, as defined by the first-litter survival of sows and LE itself, without negative consequences for other economically important traits. Nevertheless, it might be worthwhile to design a breeding goal in which LE increases and feed intake remains unchanged.
Key words: energy balance, genetic parameter, lactating sow, maternal trait ©2008 American Society of Animal Science. All rights reserved.
INTRODUCTION Genetic and management changes during the last decades have increased the litter size of sows. Larger litters result in greater total suckling stimulation of the mammary glands and more suckled mammary glands (Auldist and King, 1995; Kim et al., 1999). Therefore, milk production of sows has increased during the last decades (Revell et al., 1998a). Little is known about
1
Corresponding author:
[email protected] Received March 14, 2007. Accepted January 3, 2008.
J. Anim. Sci. 2008. 86:1067–1080 doi:10.2527/jas.2007-0165
genetic variation in milk production, because the trait is difficult to record in sows. In dairy cattle, genetic selection for milk yield alone results in increased feed intake, but also in a more pronounced negative energy balance and greater mobilization of body tissue during lactation. A large and long-lasting negative energy balance of cows generally results in reduced health and fertility (Veerkamp et al., 2001), and thus reduced stayability. Genetic studies in pigs, related to a negative energy balance, have focused on the interval from weaning to estrus (Whittemore and Morgan, 1990; Clowes et al., 2003). Selection against a prolonged interval is effective and often practiced (Ten Napel et al., 1995). How the energy balance and stayability in sows are affected by modern breeding programs is unknown.
1067
1068
Bergsma et al.
R. Bergsma, E. Kanis, M. W. A. Verstegen, C. M. C. van der Peet-Schwering (Animal Sciences Group, Wageningen UR, Lelystad, the Netherlands), and E. F. Knol (unpublished data) described a quantitative energetic model of lactating sows, based on on-farm observations that allows for large-scale data collection. The trait lactation efficiency was introduced and defined as the energetic efficiency of sows during lactation. Body condition score is widely used in dairy cattle to assess the body composition and energy balance status of cows (Veerkamp et al., 2001). The energetic model for lactating sows quantifies the mobilization of body tissue. The usefulness of including lactation efficiency, or its underlying traits, in a breeding program depends on its heritability and its relationships with other traits of interest. Therefore, the objectives of this study were to estimate genetic parameters for lactation efficiency and its underlying traits, and to evaluate current selection strategies in dam lines.
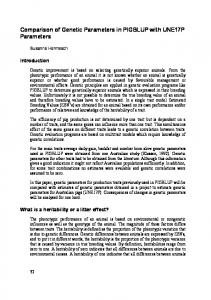
MATERIALS AND METHODS Animal Care and Use Committee approval was not obtained for this study because the data were obtained from an existing database. The experimental farm of IPG is strictly operating in line with the regulations of the Dutch law on protection of animals. Observations on lactating sows from 3 experiments on 4 farms were available. Traits included in calculating lactation efficiency are briefly described below. The full description of the quantitative energetic model is given by R. Bergsma, E. Kanis, M. W. A. Verstegen, C. M. C. van der Peet-Schwering (Animal Sciences Group, Wageningen UR, Lelystad, the Netherlands), and E. F. Knol, unpublished data. The energy metabolism of lactating sows is given schematically in Figure 1.
Traits Start weight (kg) is the BW of each sow shortly after parturition. It is estimated based on BW of the sow at transfer to the farrowing house (prepartum observation) and weight of her live and stillborn piglets at birth (postpartum observation). The assumption was made that the sow herself did not gain any BW between transfer to the farrowing house and parturition. Body composition at the beginning of lactation of each sow [fat mass at start (kg) and protein mass at start (kg)] was estimated by using her start BW and backfat thickness. Backfat thickness was recorded ultrasonically together with BW at transfer to the farrowing house. At weaning, BW and backfat thickness of each sow were measured again. Mobilization during lactation [BW loss (kg), fat loss (kg), and protein loss (kg)] was estimated by subtracting the weight of body tissue at weaning from the corresponding weight at the beginning of lactation. Each sow was on a restricted diet during the first week after parturition according to an ascending scale
(increased by a fixed amount each day). From wk 1 until weaning, sows were fed ad libitum [ad libitum feed intake (kg)] or restricted [restricted feed intake (kg)]. Both traits were defined as the total amount of feed consumed by each sow during lactation, including the first week. Energy input and output were estimated per sow per day averaged over the lactation period. All energy units were expressed in megajoules of ME. Input was calculated as Input (MJ of ME/d) = ME in total feed intake during lactation + ME in mobilization of body fat of the sow + ME in mobilization of body protein of the sow − ME needed for maintenance of the sow. Output during lactation was calculated as Output (MJ of ME/d) = ME in deposition of body fat of live piglets at weaning + ME in deposition of body protein of live piglets at weaning + ME in deposition of body fat of dead piglets + ME in deposition of body protein of dead piglets + ME needed for maintenance of weaned piglets + ME needed for maintenance of dead piglets. Lactation efficiency was defined as an energetic efficiency of the sows, where lactation efficiency (%) = (output/input) × 100. The greater the lactation efficiency, the greater the amount of available energy (input) that was used for piglet growth and piglet maintenance (output). Part of the data set contained individual BW and cross-fostering recordings of piglets. In these cases, deposition of fat and protein, and the maintenance requirement of piglets were calculated from individual BW at birth and at weaning rather than litter averages. From individual piglet BW, within-litter SD of birth weight and within-litter SD of weaning weight were calculated. Within-litter SD of birth weight was calculated from individual birth weights of live born and stillborn piglets before cross-fostering, and is of interest because litters with a greater within-litter SD were found to have a greater mortality (Roehe and Kalm, 2000). Piglet BW variation within a litter at weaning is a source of concern in modern swine management systems, because high variation delays pig movement through consecutive phases of production. Litter weight gain was calculated by subtracting the total BW of all live born piglets after cross-fostering from the total weaning weight of all weaned piglets. Litter weight at birth is the total weight of all live born and stillborn piglets before cross-fostering. As an estimate of stayability, the trait first-litter survival of sows was introduced. Stayability is defined as
Genetics of lactation efficiency in sows
1069
Figure 1. Schematic flow chart of the energy metabolism of lactating sows [R. Bergsma, E. Kanis, M. W. A. Verstegen, C. M. C. van der Peet-Schwering (Animal Sciences Group, Wageningen UR, Lelystad, the Netherlands), and E. F. Knol, unpublished data]. 1According to Everts and Dekker (1994).
the probability that an animal will stay in production until a certain age, which is an estimate of how long it will stay in production (Brigham et al., 2006). Tholen et al. (1996) studied the stayability of sows to parity 4. According to their study, the probability of a sow surviving in the herd from parity 1 to parity 2 is highly genetically correlated with the probability of the sow surviving in the herd to parity 4. The genetic correlation depends on the herd and varies from 0.75 to 0.99. Firstlitter survival of sows is defined as a binary trait. When a sow was bred after weaning her first litter, her first litter survival was 100%. Otherwise, her first litter survival was 0%. In our study, all gilts that were inseminated were included in this trait. Gilts that were inseminated but culled before birth of their first litter were assigned 0%.
In addition to the above-mentioned traits, 3 “traditional” traits were included in the analyses. Total number born was defined as number of live born piglets + number of stillborn piglets + number of mummified piglets. Litter mortality is the number of piglets that died during lactation as a percentage of litter size immediately after cross-fostering. Prolonged interval is 100% if a sow was inseminated at 7 d or later after weaning and 0% if a sow was inseminated at 6 d or less after weaning. In total, 19 traits were included in the analyses.
Data Sets For all 3 experiments, all information on individual sows and their piglets was available to calculate lacta-
1070
Bergsma et al.
Table 1. Number of observations, mean, phenotypic SD (σ), heritability (h2), and repeatability (r2) by trait (SE in parentheses) Item Total number born, n Litter mortality, % Percent prolonged interval First-litter survival of sows, % Start BW, kg Fat mass at start, kg Protein mass at start, kg Litter weight at birth, kg SD birth weight, g Ad libitum feed intake,2 kg Restricted feed intake,2 kg BW losses, kg Fat losses, kg Protein losses, kg Litter weight gain, kg SD weaning weight, g Input, MJ/d Output, MJ/d Lactation efficiency, %
Observations, n
Mean
σphenotypic1
19,759 18,718 15,844 4,261 2,063 2,044 2,044 2,629 1,465 1,101 2,113 1,973 1,952 1,952 2,560 1,482 1,883 2,562 1,857
12.56 11.7 13.0 85.1 203 43.3 31.2 17.2 286 116.8 142.3 18.7 8.8 2.1 62.3 1,356 58.4 38.8 66
3.13 12.4 31.3 33.6 15.7 6.9 2.4 3.8 88 19.0 17.7 13.0 4.5 2.0 10.3 471 10.0 6.1 10.6
1
Phenotypic SD were adapted from ASReml analyses: Total feed intake during lactation.
2
tion efficiency. In addition, the pedigree of each sow was known and the 3 experiments partly overlapped in pedigree. The first experiment was described by Eissen et al. (2003) and was carried out from October 1996 until October 1998 to simulate how future high levels of litter size affect current (1997) lactating primiparous sows. This study determined whether nursing a large litter had negative effects on sow performance during lactation and postweaning. Ad libitum feed intake during lactation of each sow was recorded to evaluate whether a greater feed intake could prevent possible negative effects of large litters on sow performance, and whether selection for lactation feed intake should be recommended. This experiment was carried out on 3 farms, 1 of which was the experimental farm of IPG. In the second data set, from the experimental farm of IPG, commercial TOPIGS crossbred sows (Vught, the Netherlands) and their offspring by different commercial sire lines were compared [R. Bergsma, E. Kanis, M. W. A. Verstegen, C. M. C. van der Peet-Schwering (Animal Sciences Group, Wageningen UR, Lelystad, the Netherlands), and E. F. Knol, unpublished data]. Since autumn 2003, BW and backfat measurement at entering and leaving the farrowing house have been implemented as a farm routine. Restricted feed intake during the stay in the farrowing house has been recorded since January 1, 2000. Individual piglet BW at birth and weaning have been recorded since September 2001, as has the recording of cross-fostering of individual piglets. Culling decisions on the experimental farm were similar to those made on commercial farms. This second data set included subsequent litters of the primiparous sows of the first data set.
h2 0.13 0.04 0.08 0.05 0.45 0.52 0.39 0.19 0.09 0.30 0.14 0.20 0.05 0.21 0.18 0.00 0.15 0.17 0.12
(0.02) (0.01) (0.01) (0.02) (0.08) (0.08) (0.08) (0.05) (0.05) (0.08) (0.05) (0.06) (0.04) (0.06) (0.05) (0.03) (0.06) (0.05) (0.03)
r2 0.22 (0.01) 0.09 (0.01) 0.11 (0.01) — 0.54 (0.03) 0.57 (0.03) 0.59 (0.03) 0.29 (0.03) 0.10 (0.03) 0.34 (0.07) 0.23 (0.03) 0.23 (0.03) 0.14 (0.03) 0.21 (0.03) 0.27 (0.03) 0.11 (0.03) 0.26 (0.03) 0.25 (0.03) 0.12 (0.03)
2 2 2 + σanimal + σpermanentenvironment . √σerror
The third data set was from the Sterksel experimental farm of the Animal Sciences Group of Wageningen UR. At the Sterksel farm, the effects of a low-protein and low-phosphorus gestation diet (by phase feeding) on reproductive performance, stayability, and mineral excretion were studied for 4 successive parities (van der Peet-Schwering et al., 2005). The experiments were executed from October 2000 until February 2004. During lactation, sows were fed according to an ascending scale from parturition until d 6 after parturition, and were given free access to the lactation diets from d 6 after parturition onward. In a previous study [R. Bergsma, E. Kanis, M. W. A. Verstegen, C. M. C. van der Peet-Schwering (Animal Sciences Group, Wageningen UR, Lelystad, the Netherlands), and E. F. Knol, unpublished data], phenotypic correlations between lactation efficiency and its underlying traits, and phenotypic correlations between lactation efficiency and traditional reproductive traits were remarkably similar (results not shown) for 2 farms, even though 1 farm fed sows ad libitum during lactation and the other fed a restricted diet. Therefore, observations in the above-mentioned 3 experiments were treated as 1 data set. Creep feed was offered (but feed intake was not recorded) to piglets before weaning during the second and third experiment and was not offered to piglets throughout the lactation during the first experiment. Lactation efficiency therefore did not include feed intake by piglets. When creep feed was provided to the piglets, intake was estimated at 200 to 300 g per piglet during a 4-wk lactation. On all 4 farms, a commercial lactation diet was fed to sows during lactation. To complete the data set, information on all 4 farms regarding reproductive traits, from September 1, 1996,
Genetics of lactation efficiency in sows
1071
Table 2. Fixed effects included in the vector b for different traits Trait fixed effects1
Model [a]
Fat mass at start; protein mass at start; BW at start + PARITYj + HYSk + LINE 乆l
[b]
Fat loss, protein loss; BW loss; ad libitum feed intake; restricted feed intake; lactation efficiency; litter weight gain; input; output + PARITYj + HYSk + LINE 乆l + b1 × LLE
[c]
Litter weight at birth; within-litter SD in birth weight; within-litter SD in weaning weight + PARITYj + HYSk + LINE 乆l + LINE 么m + LINE 乆l × LINE 么m
[d]
Litter mortality + PARITYj + HYSk + LINE 乆l + LINE 么m + LINE 乆l × LINE 么m + b1 × LLE
[e]
Total number born + PARITYj + HYSk + LINE 乆l + LINE 么m + LINE 乆l × LINE 么m + DIn + REMATo
[f]
Percent prolonged interval + PARITYj + HYSk + LINE 乆l + b1 × LLE + b2 × LLE2 + b3 × NOWND
[g]
First-litter survival of sows + HYS2j + LINE 乆k + b1 × AFI
1 Where = population mean; PARITY = the parity of the sow (parity 6 and greater were combined); HYS = herd-year-season = farm × month of farrowing, where HYS accounts for differences between experiments; LINE 乆 = the line code of the sow; LINE 么 = the line code of the father of the litter; DI = double insemination, whether (1) or not (0) the sow was bred more than once within the same cycle; REMAT = remating, whether (0) or not (1) the present litter originated from the first insemination after weaning (multiparous sows) or rearing (primiparous sows; apart from double insemination); LLE = length of lactation (d); NOWND = number of piglets weaned (n); HYS2 = farm × quarter of insemination (herd-year-season); AFI = age at first breeding (d).
onward, was added. The number of observations per trait varied considerably (Table 1).
Estimation of Genetic Parameters Genetic parameters were estimated by using REML analyses based on an animal model. A repeatability model was used for all traits except for the first-litter survival of sows. The mixed model can be written as y = Xb + Za + Wc + e, where y is the vector of observations; X, Z, and W are known incidence matrices; b is the solution vector of fixed effects; a is the vector of random additive genetic effects ∼ (0, Aσa2); c is the vector of random permanent nongenetic effects of each sow ∼ (0, Ipσp2); and e is the vector of the residuals ∼ (0, Ieσe2). Ip and Ie are identity matrices, and A is the additive genetic relationship matrix. The term Wc was included only in the repeatability models. Analyses were performed with ASREML software (Gilmour et al., 2002). The pedigree matrix contained 3 generations of parents. In total, 8,469 animals were included in the pedigree matrix. The 4,687 sows with performance records for total number born were descended from 492 sires and 1,222 dams. The 1,088 sows with performance records for lactation efficiency descended from 172 sires and 480 dams. Genetic parameters were estimated in 2 ways. Univariate analyses were performed to estimate the heritability and repeatability of lactation efficiency, its under-
lying components, and some reproductive traits. Bivariate analyses were performed to estimate the genetic and phenotypic covariances between traits. To obtain the maximum accuracy of estimates, different statistical models were used for different traits. The fixed effects included in the vector b are given in models [a] through [g] (Table 2). Only significant effects were included in the models. Effects for which heritabilities were estimated were excluded from the models in both univariate and bivariate analyses.
SelAction To predict the consequences of a modern breeding program on lactation efficiency, its underlying components, and some reproductive traits, the simulation program SelAction was used (Rutten et al., 2002). SelAction predicts the genetic progress in a breeding program, and thereby gives a better understanding of the biological mechanism of energy metabolism of lactating sows. SelAction predicts genetic gain by using an accurate approximation of a stochastic simulation, with selection on BLUP EBV from an animal model. A population with discrete generations and a fixed number of sires and dams was simulated. In SelAction, animals are assumed to be selected on an index (I) that equals their expected value for the aggregate genotype. This corresponds to an index as used in practice:
1072
Bergsma et al.
Table 3. Relative economic values, phenotypic variance (σ2phenotypic), and heritability (h2) for traits included in the selection index of the 3 alternative breeding programs (models [1] to [3]) Relative economic value
Trait Total number born Litter mortality, % Prolonged interval percent Lactation efficiency, % Litter weight gain, kg
2 σphenotypic
h2
[1] Balanced
9.82 153.9 981.2 112.7 14.54
0.13 0.04 0.08 0.12 0.19
1.0000 −0.4665 −0.0683 — —
I = EWtrait1 × EBVtrait1 + EWtrait2 × EBVtrait2 + ... + EWtraitn × EBVtraitn, where EW is the economic weight. Genetic gain was simulated for 3 dam-line breeding goals: 1. A breeding goal with 3 traits: total number born, litter mortality, and percent prolonged interval from weaning to estrus. Economic values (Table 3) were chosen in such a way that, according to SelAction, 50% of the selection response was due to improvement of the total number born, 25% to litter mortality, and 25% to a prolonged interval from weaning to estrus. 2. A breeding goal with lactation efficiency, together with the traits from simulation 1, total number born, litter mortality, and percent prolonged interval from weaning to estrus. The economic values for lactation efficiency and total number born were assumed to be equal. 3. A breeding goal with litter weight gain. The latter simulation was used to demonstrate the effect of indirect selection for milk production. To model the breeding program, the following assumptions were made: • There was an active population of 5,000 sows, with an annual replacement of 40%; • 40 sires were used every year; • 10% of the litters produced were purebred litters for which only second-parity sows were used; • Each sow produced 2.35 litters per year; • Per purebred litter, 3.5 female piglets and 2.1 male piglets were reared; • A 2-stage-selection was simulated: 䡩 At the end of the rearing period (at approximately puberty) BLUP-EBV selection for young boars and sows was performed; and 䡩 After the first litter, sows were selected to produce a purebred litter based on BLUP-EBV, including their own performance, plus the per-
• •
• •
[2] Balanced including lactation efficiency
[3] Litter weight gain
1.0000 −0.4665 −0.0683 1.0000 —
— — — — 1.0000
formance of full sibs, plus the performance of half sibs. No second selection step was included for boars; Piglets that were not reared were excluded for reasons other than the breeding goal; After the rearing period, 40% of the males and 85% of the females were available for selection; the remaining 60% of the males and 15% of the females were excluded from breeding for reasons other than the breeding goal; 85% of the first-litter sows produced a second litter. The remaining 15% were excluded for reasons other than the breeding goal; and The maximum number of offspring selected per dam was 1 male and 3.5 females.
These assumptions resulted in a “proportion of selected male parents” of 0.041 and a “proportion of selected female parents” of 0.395. The length of the generation interval was 15 mo. The second stage of selection in sows was based on BLUP-EBV, including their own performance and the performance of full and half sibs. Simulation 1 implied observations on the total number born, litter mortality, and percent prolonged interval from weaning to estrus. Additionally, simulation 3 included observations on litter weight gain. Simulation 2 included observations on all traits. For SelAction, the underlying traits of lactation efficiency are not necessary. Because they are needed to estimate lactation efficiency and are thus available, they were assumed to be used in the simulation as well. An accurate estimation of lactation efficiency requires individual BW of piglets. Observations on traits other than underlying traits of lactation efficiency that could be calculated from the individual piglets’ BW, such as within-litter SD for birth weight and litter weight at start, were assumed to be available as well. Phenotypic variances and heritabilities needed in SelAction were obtained from the univariate analyses. Phenotypic and genetic correlations were obtained from bivariate analyses.
Genetics of lactation efficiency in sows
RESULTS Unadjusted means and numbers of observations for all traits are presented in Table 1. Ad libitum feed intake showed a lower average than restricted feed intake. The group of sows fed ad libitum during lactation contained a relatively large number of primiparous sows. Observations on restricted feed intake came from the experimental farm of IPG (data set 2). The realized feed intake on that farm was relatively high compared with other farms [R. Bergsma, E. Kanis, M. W. A. Verstegen, C. M. C. van der Peet-Schwering (Animal Sciences Group, Wageningen UR, Lelystad, the Netherlands), and E. F. Knol, unpublished data].
Heritabilities Estimates of heritabilities and repeatabilities are also given in Table 1. Body weight and body composition traits at the beginning of lactation showed the greatest heritabilities. Apart from the direct genetic effect, there was a nongenetic permanent environmental effect for these traits, with repeatabilities from 0.54 to 0.59. Of these 3 traits, fat mass at the beginning of lactation showed the greatest heritability. Of the body tissue losses, fat loss showed a relatively low heritability of 0.05, whereas weight and protein losses showed a heritability of 0.20 and 0.21, respectively. Heritability for ad libitum feed intake was 0.30 and for restricted feed intake was 0.14. Repeatabilities for these intake traits were more similar, 0.34 and 0.23, respectively. The SE of the estimate for the heritability of ad libitum feed intake was relatively high (0.08) because of the low number of observations. Lactation efficiency showed a heritability of 0.12. No nongenetic permanent environmental effect was found for lactation efficiency, because heritability and repeatability both yielded 0.12. The heritability for first-litter survival of sows was 0.05. This is in line with findings by Tholen et al. (1996). For 2 different herds, they found a heritability of 0.05 and 0.02, respectively, with a corresponding genetic variance of 60 and 34%, respectively. The genetic variance in our study was 60.5%, although definitions differed slightly. The heritabilities for litter weight at birth, litter weight gain, input, and output varied from 0.15 to 0.19, and the repeatabilities varied from 0.25 to 0.29. The within-litter SD of birth weight showed a heritability of 0.09 and a repeatability of 0.10. The repeatability for within-litter SD in weaning weight was similar: 0.11. However, no genetic variance was found for this trait. Heritabilities for the more traditional traits such as total number born, litter mortality, and percent prolonged interval were in line with the literature (Rothschild and Bidanel, 1998).
Genetic Correlations Results of the bivariate analyses are shown in Table 4. Within-litter SD in weaning weight showed no addi-
1073
tive genetic variance and were therefore excluded from the bivariate analyses. The genetic correlation between total number of born piglets and litter mortality was +0.39 (Table 4). A positive genetic correlation between total number born and litter mortality has been reported frequently (Rothschild and Bidanel, 1998). Most other genetic correlations with the total number born are rather small. Litter weight at birth, litter weight gain, and thus output increase genetically with greater litter sizes. The genetic correlation of litter weight gain and litter mortality was negative (−0.43) and thus favorable. Withinlitter SD in birth weight increased with increasing litter size, although not significantly. Our study, as well as the one by Knol (2001), showed no significant genetic correlation of within-litter SD in birth weight with total number born. Sows with a high genetic merit for ad libitum feed intake showed (genetically) lower weight, fat, and protein losses during lactation. The input was still greater compared with sows with a low genetic merit for ad libitum feed intake. A high genetic merit for ad libitum feed intake yielded (genetically) a greater litter weight gain and thus a greater output. There were some unexpected differences between ad libitum feed intake and restricted feed intake. In general, the genetic correlations were stronger with ad libitum feed intake than with restricted feed intake. The genetic correlations of feed intake with litter mortality and lactation efficiency were the exceptions. Some of the correlations were of different signs; however, in these cases such correlations were not significantly different from zero. The genetic correlation between ad libitum feed intake and restricted feed intake was high but not significantly different from zero. The high SE of this genetic correlation is the result of lacking common observations. Genetic correlations were mainly based on family information, only a few sows were fed ad libitum during their first lactation and fed restricted during subsequent lactations. Ad libitum feed intake and within-litter SD in birth weight also lacked common observations. Therefore, the estimated genetic correlation of +0.97 did not differ significantly from zero. High ad libitum feed intake was unfavorable for stayability, as defined by the first-litter survival of sows (rg = −0.60), as was a high restricted feed intake (rg = −0.92). A high genetic merit for stayability seemed to be associated with a high genetic merit for gain (fat, protein, or both) because of the rather high genetic correlation of first-litter survival of sows with weight, fat mass, and protein mass at the beginning of lactation. The phenotypic correlations between these traits were rather small. A genetically greater protein mass and, as a result, a greater weight at the beginning of the lactation were genetically associated with a lower within-litter SD in birth weight. The (strong) negative genetic correlation between first-litter survival of sows and within-litter SD in birth weight probably goes along the pathway of development, because start weight was
—
0.23 (0.01) 0.00 (0.01) 0.04 (0.02) −0.11 (0.02) 0.11 (0.02) −0.08 (0.02) 0.80 (0.01) 0.11 (0.03) 0.07 (0.03) 0.04 (0.02) −0.11 (0.03) −0.05 (0.03) −0.12 (0.03) 0.05 (0.02) −0.01 (0.03) 0.00 (0.02) 0.05 (0.03)
TNB
LMO
0.00 (0.01) −0.04 (0.02) −0.01 (0.02) −0.05 (0.02) 0.01 (0.02) 0.06 (0.02) 0.04 (0.03) −0.04 (0.03) −0.11 (0.02) −0.27 (0.02) −0.29 (0.02) −0.23 (0.02) −0.36 (0.02) −0.29 (0.02) −0.42 (0.02) −0.09 (0.02)
0.39 (0.10) —
LMO
0.07 (0.04) 0.11 (0.04) 0.03 (0.04) 0.03 (0.04) 0.06 (0.07) 0.15 (0.04) −0.10 (0.06) −0.18 (0.04) −0.12 (0.04) −0.12 (0.04) 0.02 (0.04) 0.03 (0.04) −0.01 (0.04) 0.00 (0.04)
0.12 (0.15) −0.20 (0.18) −0.14 (0.18) —
−0.06 (0.10) 0.09 (0.13) —
0.01 (0.02) −0.00 (0.02) −0.02 (0.02) 0.01 (0.02) 0.03 (0.02) −0.03 (0.03) −0.02 (0.03) −0.08 (0.03) 0.03 (0.02) 0.02 (0.02) 0.02 (0.02) −0.02 (0.02) −0.01 (0.02) −0.01 (0.02) 0.00 (0.02)
1LS
PINT
0.63 (0.02) 0.93 (0.00) −0.09 (0.03) 0.02 (0.04) −0.04 (0.04) −0.11 (0.04) 0.24 (0.03) 0.10 (0.03) 0.25 (0.03) 0.02 (0.03) −0.04 (0.03) 0.02 (0.03) 0.07 (0.03)
−0.15 (0.13) −0.07 (0.16) 0.24 (0.15) 0.50 (0.18) —
WTS
0.32 (0.03) −0.09 (0.03) 0.02 (0.04) −0.15 (0.04) −0.13 (0.04) 0.16 (0.03) 0.36 (0.02) 0.06 (0.03) 0.00 (0.03) 0.10 (0.03) 0.00 (0.03) −0.10 (0.03)
−0.27 (0.12) −0.13 (0.15) 0.20 (0.14) 0.39 (0.19) 0.71 (0.07) —
FMS
−0.06 (0.03) 0.00 (0.04) 0.01 (0.04) −0.08 (0.04) 0.22 (0.03) −0.04 (0.03) 0.28 (0.03) 0.03 (0.03) −0.09 (0.03) 0.02 (0.03) 0.13 (0.03)
−0.05 (0.14) −0.02 (0.17) 0.23 (0.16) 0.44 (0.20) 0.93 (0.01) 0.39 (0.12) —
PMS
0.12 (0.03) 0.08 (0.04) 0.02 (0.03) 0.03 (0.03) 0.11 (0.03) −0.01 (0.03) 0.14 (0.02) 0.13 (0.03) 0.13 (0.02) 0.03 (0.03)
0.78 (0.06) −0.23 (0.20) 0.14 (0.19) 0.32 (0.26) −0.17 (0.17) −0.36 (0.16) −0.03 (0.18) —
LWTB
0.76 (0.11) 0.03 (0.03) 0.05 (0.04) 0.02 (0.04) 0.06 (0.04) −0.01 (0.03) 0.05 (0.04) −0.00 (0.03) −0.07 (0.04)
0.45 (0.29) −0.35 (0.43) 0.88 (0.26) −0.92 (0.40) −0.68 (0.21) −0.20 (0.28) −0.73 (0.23) 0.32 (0.30) —
SDBW
−0.03 (0.10) −0.40 (0.03) −0.37 (0.03) −0.38 (0.03) 0.37 (0.03) 0.69 (0.02) 0.37 (0.0) −0.44 (0.03)
0.01 (0.17) −0.05 (0.20) 0.18 (0.20) −0.60 (0.26) 0.18 (0.18) 0.03 (0.19) 0.20 (0.19) −0.04 (0.25) 0.97 (0.82) —
ALFI
−0.27 (0.04) −0.18 (0.04) −0.26 (0.04) 0.35 (0.03) 0.59 (0.02) 0.33 (0.03) −0.36 (0.03)
0.04 (0.25) −0.59 (0.27) −0.19 (0.28) −0.92 (0.33) −0.43 (0.24) −0.08 (0.23) −0.48 (0.26) −0.09 (0.26) −0.14 (0.39) 0.83 (0.44) —
RFI
0.67 (0.01) 0.96 (0.00) 0.35 (0.02) 0.36 (0.02) 0.39 (0.02) −0.03 (0.03)
0.00 (0.17) −0.10 (0.20) 0.02 (0.19) 0.29 (0.27) −0.27 (0.17) −0.21 (0.17) −0.19 (0.18) 0.56 (0.19) 0.19 (0.41) −0.62 (0.16) −0.20 (0.31) —
WTL
0.44 (0.02) 0.31 (0.02) 0.54 (0.02) 0.35 (0.02) −0.26 (0.02)
0.11 (0.28) −0.34 (0.31) 0.22 (0.30) 0.43 (0.42) −0.25 (0.29) 0.10 (0.26) −0.35 (0.30) 0.56 (0.30) 0.96 (0.46) −0.85 (0.26) 0.25 (0.51) 0.86 (0.12) —
FL
0.31 (0.02) 0.24 (0.03) 0.35 (0.02) 0.06 (0.03)
−0.01 (0.17) −0.09 (0.20) −0.04 (0.19) −0.04 (0.25) −0.29 (0.17) −0.25 (0.17) −0.19 (0.18) 0.52 (0.19) 0.05 (0.40) −0.66 (0.15) −0.32 (0.30) 0.99 (0.01) 0.80 (0.16) —
PL
0.60 (0.02) 0.98 (0.00) 0.31 (0.02)
0.45 (0.16) −0.43 (0.18) 0.15 (0.20) −0.23 (0.27) −0.08 (0.18) −0.13 (0.17) −0.04 (0.19) 0.29 (0.21) −0.09 (0.37) 0.48 (0.20) 0.32 (0.26) 0.28 (0.20) 0.04 (0.37) 0.33 (0.20) —
LWG
0.61 (0.02) −0.55 (0.02)
0.26 (0.20) −0.27 (0.22) 0.05 (0.23) −0.34 (0.33) −0.27 (0.20) −0.12 (0.20) −0.25 (0.20) 0.30 (0.23) 0.50 (0.35) 0.83 (0.11) 0.99 (0.12) −0.01 (0.26) −0.18 (0.40) 0.02 (0.25) 0.68 (0.14) —
IN
0.31 (0.02)
0.46 (0.17) −0.48 (0.18) 0.15 (0.20) −0.20 (0.27) −0.13 (0.19) −0.14 (0.18) −0.10 (0.19) 0.39 (0.21) 0.14 (0.35) 0.42 (0.21) 0.41 (0.26) 0.31 (0.20) 0.09 (0.36) 0.37 (0.19) 0.99 (0.00) 0.69 (0.14) —
OUT
0.09 (0.14) −0.24 (0.19) 0.10 (0.17) 0.30 (0.34) 0.25 (0.12) −0.09 (0.11) 0.36 (0.12) −0.03 (0.15) −0.51 (0.36) −0.38 (0.20) −0.74 (0.19) 0.08 (0.16) −0.18 (0.23) 0.14 (0.16) 0.23 (0.15) −0.67 (0.13) 0.20 (0.15) —
LE
1 TNB = total number born (n); LMO = litter mortality (%); PINT = percent prolonged interval; 1LS = 1st litter survival of sows (%); WTS = start weight (kg); FMS = fat mass at start (kg); PMS = protein mass at start (kg); LWTB = litter weight at birth (kg); SDBW = SD of birth weight (g); ALFI = ad libitum feed intake (kg); RFI = restricted feed intake (kg); WTL = weight loss (kg); FL = fat loss (kg); PL = protein loss (kg); LWG = litter weight gain (kg); IN = input (MJ/d); OUT = output (MJ/d); LE = lactation efficiency (%).
LE
OUT
IN
LWG
PL
FL
WTL
RFI
ALFI
SDBW
LWTB
PMS
FMS
WTS
1LS
PINT
TNB
Item
Table 4. Genetic correlations above the diagonal, phenotypic correlations below the diagonal (SE in parentheses); bold printed correlations differ from zero (P < 0.05)1
1074 Bergsma et al.
1075
Genetics of lactation efficiency in sows
genetically positively correlated with first-litter survival and strongly negatively correlated with withinlitter SD in birth weight. Surprisingly, the phenotypic correlation between first-litter survival of sows and within-litter SD in birth weight did not differ from zero. Within-litter SD in birth weight also showed strong positive genetic correlations with prolonged interval and fat loss during lactation. This suggests that a low within-litter SD in birth weight is a preferable characteristic, although we found no (phenotypic or genetic) correlation between within-litter SD in birth weight and litter mortality. A (genetically) high fat mass at the beginning of lactation was associated with a reduced litter size and a lower litter weight at birth. When sows are fed according to a scheme during gestation and the number of fetuses is low, more energy will be available for deposition of fat at the end of gestation. This is a phenotypic relation, but this phenomenon may have affected the estimates of the genetic correlation. Losses during lactation (weight, fat, or protein) are genetically strongly associated, as are the different components of weight at the beginning of lactation. (Genetically) high weight and protein mass at the beginning of lactation and low input as a result of low restricted feed intake are favorably associated with lactation efficiency. There are, in general, no significant phenotypic correlations between percent prolonged interval and any other trait. This was unexpected because positive correlations between fat loss and, in particular, protein loss and a prolonged interval have been reported frequently (Whittemore and Morgan, 1990; Clowes et al., 2003).
Simulations Predicted responses for the 3 breeding goals are given per generation in Table 5. The length of the generation interval was 15 mo in each simulated breeding program. The first breeding goal yielded balanced genetic progress: improvement of all 3 traits involved. Selection for the total number born, litter mortality, and percent prolonged interval yielded an increased first-litter survival of sows of 0.6% per generation as a correlated response. Litter weight gain (and thus output) increased, as did litter weight at birth and restricted feed intake. Ad libitum feed intake did not. Changes in body tissue losses during lactation were rather small (less than 3% of the genetic SD). Small changes in the underlying components caused input to increase. Output and input both increased by 0.4 MJ/d of lactation per generation, which means sows became (genetically) more efficient. Output and input increased with the same magnitude, and because the level of input was greater than the level of output, lactation efficiency also improved genetically. Body weight and fat mass at the beginning of lactation seemed to decrease slightly (5% of the genetic SD for start weight and 6% for fat mass at the beginning of lactation). Uniformity at birth hardly
changed. The within-litter SD in birth weight increased by 1 g per generation, which was less than 4% of the genetic SD. Inclusion of lactation efficiency in the breeding goal barely affected absolute improvement of the total number born, litter mortality, and percent prolonged interval. Additionally, lactation efficiency increased by 1% per generation instead of 0.2% when applying the balanced breeding goal. Efficiency increased because input decreased and output increased. Feed intake (restricted and ad libitum) decreased but mobilization of body tissue increased. Litter weight gain increased by 0.8 kg per generation. Sows became leaner at the beginning of lactation because weight increased and fat mass decreased. Changes in first-litter survival of sows, within SD in birth weight and litter weight at birth, were rather large (52, 23, and 42% of their genetic SD, respectively). Selection for lactation efficiency implied data collection for all traits. As a consequence of extra observations, the accuracy of the selection index increased. For the balanced breeding goal with observations on the total number born, litter mortality, and percent prolonged interval, the accuracy of the index was 0.418 for females and 0.119 for males according to SelAction. When we included observations on all (18) traits, the accuracy increased to 0.602 for females and 0.181 for males (results not shown). Selection for litter weight gain only yielded an increased percent prolonged interval from weaning to estrus, increased ad libitum feed intake, increased restricted feed intake, and decreased stayability. The reductions in start weight and fat mass were less severe compared with the genetic progress simulated with the balanced breeding goal. On the other hand, weight loss during lactation, but not fat loss, increased absolutely and relatively to the balanced breeding goal. Obviously, litter weight gain as well as output showed greater genetic progress while simulating a breeding goal with litter weight gain only. As a consequence of increased feed intake and mobilization of body tissue, input also increased. The breeding goal with litter weight gain only yielded greater genetic progress for the total number born and litter mortality than did the balanced breeding goal. Selection for litter weight gain implied data collection for that trait. The genetic correlations between litter weight gain, on one hand, and total number born and litter mortality, on the other hand, were moderate (0.45 and 0.43, respectively). As a consequence of extra observations for genetically correlated traits, the accuracy of the BLUB-EBV for the total number born and litter mortality increased, compared with the breeding goal without observations on litter weight gain.
DISCUSSION Heritabilities Body weight and body composition, especially fat mass at the beginning of lactation, showed high herita-
1076
Bergsma et al.
Table 5. Selection responses and correlated responses of simulations with SelAction1 Model [1] Balanced
[2] Balanced including lactation efficiency
[3] Litter weight gain
Trait
Trait units
Percentage of total response
Trait units
Percentage of total response
Trait units
Total number born, n Litter mortality, % Prolonged interval percent
0.19 −0.2 −1.4
50 25 25
0.21 −0.3 −1.2
31 22 11
0.20 −0.3 0.5
First-litter survival of sows, % Start BW, kg Fat mass at start, kg Protein mass at start, kg Litter weight at birth, kg SD birth weight, g Ad libitum feed intake, kg Restricted feed intake, kg BW loss, kg Fat loss, kg Protein loss, kg Litter weight gain, kg Input, MJ/d Output, MJ/d Lactation efficiency, %
0.6 −0.6 −0.3 −0.1 0.3 1 −0.1 0.8 0.1 0.0 0.0 0.6 0.4 0.4 0.2
36
−0.5 −0.3 −0.2 0.0 0.2 0 1.6 0.6 0.5 0.0 0.1 1.4 0.9 0.8 0.3
3.9 0.1 −0.4 0.1 0.7 −6 −0.4 −0.4 0.4 0.1 0.2 0.8 −0.4 0.3 1.0
Percentage of total response
100
1
Rutten et al. (2002).
bilities (0.4 to 0.5). Mobilization of body tissue during lactation was not as heritable as body composition at the beginning of the lactation. Fat loss during lactation showed a low heritability of 0.05. Grandinson et al. (2005) estimated a heritability for sow BW within 1 d of parturition of 0.19, and 0.47 for the corresponding ultrasonic backfat thickness. For BW loss and backfat loss during lactation, they found heritabilities of 0.20 and 0.10, respectively. Estimates of heritability for backfat thickness, backfat loss, and BW loss in the current study and in the study by Grandinson et al. (2005) were very similar. Estimated heritability of BW at the beginning of lactation was greater in our study (0.45) than in the study by Grandinson et al. (2005; 0.19). Fat mass in our study was based on BW and ultrasonic backfat thickness, and therefore fat mass and ultrasonic backfat thickness are different, but related, expressions of fat deposition. Thus, an equal heritability might be expected. The high heritabilities of BW and fat mass at the beginning of lactation are unexpected because farm management aims to prevent variation in BW and body condition scores between sows at parturition. Nevertheless, sows apparently managed to express their own genetic potential. Preventing variation means that farmers expect a phenotypic optimum for BW and backfat thickness at the beginning of lactation. This is not unreasonable because, for example, body fat at the beginning of lactation and feed intake during lactation are negatively correlated (Revell et al., 1998). Therefore, breeding values for BW and fat mass at the beginning of lactation could be a useful tool to determine the opti-
mum feeding scheme during gestation for individual sows. The heritability of litter weight at birth was high in our experiments (0.19) compared with that of Roehe (1999), who reported a heritability of 0.08 (±0.03) without adjustment for litter size at birth. However, in another model in which birth weight was regarded as a trait of an individual (live born) pig, which was influenced by a direct genetic effect and a maternal genetic effect, the maternal component was 0.26 (±0.04). The maternal heritability of individual birth weight may be expected to be equal to the heritability of litter weight at birth (Roehe, 1999). Rothschild and Bidanel (1998) reported a mean heritability from the literature of 0.29 for litter weight at birth. In their review, they reported a heritability of 0.17 for litter weight at 21 d of age. Damgaard et al. (2003) found a heritability of 0.19 for mean BW at 3 wk of age. The trait litter weight at 21 d or mean BW at 3 wk of age was influenced by birth weight of the piglets. No literature was found for heritability of litter weight gain to compare with our estimate (0.18). If litter weight gain is a reflection of milk yield (Revell et al., 1998a), its heritability can be compared with heritability estimates for milk yield in dairy cattle. Veerkamp (1998) reviewed research in this area. The average estimate was 0.32, and estimates varied from 0.16 to 0.50. Litter weight gain and output were genetically the same traits (rg = +0.99). This was expected because both traits were derived from BW of piglets at birth and at weaning within a litter. Knol (2001) reported a heritability of 0.07 ± 0.01 for the within-litter SD in birth weight. Heritability in our
Genetics of lactation efficiency in sows
experiment was somewhat greater. The within-litter SD of weaning weight showed no additive genetic variance in our study. Damgaard et al. (2003) reported a heritability of 0.06 ± 0.03 for the within-litter SD of BW at 3 wk of age. They reported a heritability of 0.08 ± 0.03 for the within-litter SD in birth weight of live born piglets, and a genetic correlation of 0.71 ± 0.21 between within-litter SD at birth and at weaning. Contrary to our experiments, cross-fostering was not practiced by Damgaard et al. (2003). One of the reasons for cross-fostering is to reduce the within-litter SD in BW. From the results of our study and those of Damgaard et al. (2003), we can conclude that the within-litter SD in weaning weight showed no additive genetic variance. In situations in which no cross-fostering was practiced, within-litter SD in weaning weight was an expression of within-litter SD in birth weight. The latter trait showed a heritability of 0.09. No literature was found to compare with our estimate of heritability for lactation efficiency. The trait in finishing pigs that comes nearest to the lactation efficiency of sows is residual feed intake. The reported heritabilities have varied from 0.10 to 0.45 (de Haer, 1992; Johnson et al., 1999; Nguyen et al., 2005). Heritability of lactation efficiency (0.12) was at the lower bound of these estimates. Lactation efficiency was considered as a trait of the sow but is also influenced by the feed conversion capacity of the individual piglets, which might have resulted in a lower estimate of the heritability. The heritability was low but significantly larger than zero, suggesting that genetic improvement of lactation efficiency by selection can be successful.
Genetic Correlations Genetic correlations among the total number born, litter mortality, and litter weight at birth from our study were in line with those reported by Rothschild and Bidanel (1998). Our data set appeared to be a representative sample, which was also supported by our findings on heritabilities. Eissen et al. (2003) suggested increasing the feed intake capacity of sows to facilitate sows to wean larger litters. For most characteristics, a greater genetic merit for feed intake is favorable. Increased feed intake during lactation is associated with decreased BW, fat, and protein losses during lactation and with increased litter weight gain. Feed intake (ad libitum and restricted), in contrast, seems not to affect the percent prolonged interval from weaning to estrus, which was unexpected. There was only a small (but significant) negative phenotypic correlation between restricted feed intake and percent prolonged interval. High ad libitum feed intake was unfavorable for first-litter survival (rg = −0.60), and so was high restricted feed intake (rg = −0.92). Our genetic correlations had a rather large SE (0.26 and 0.33, respectively); however, the statistical chances that they were at least moderately negative were large. Unfortunately, we lack a biological interpretation of this
1077
negative correlation. A possible explanation for this phenomenon found in the literature was provided by Tolkamp and Ketelaars (1992): increased feed intake will lead to increased oxygen intake. Consumption of oxygen has damaging effects on living organisms, because it accumulates in the course of life and results in a loss of vitality, aging, and finally death. Our phenotypic correlation between feed intake and first-litter survival, on the other hand, was positive (ad libitum feed intake), which was supported by negative phenotypic correlations between BW loss, fat loss, and protein loss during lactation and first-litter survival. Our phenotypic relations are in line with Serenius et al. (2006), who stated that sows with lower feed intake and greater backfat loss during lactation had a shorter productive lifetime. Tholen et al. (1996) and Lo´pez-Serrano et al. (2000) studied the genetic correlation between stayability of sows from the first to the second parity and finishing traits (daily gain and backfat thickness). These studies showed an average genetic correlation between daily gain and stayability of −0.2, and a genetic correlation of +0.2 between backfat thickness and stayability. Cassady et al. (2004) found that offspring of a maternal line superior in sow longevity grew slower and had poorer carcass composition than offspring from 5 other maternal lines studied. Clutter and Brascamp (1998) showed that the genetic correlation between daily gain and feed intake was stronger (rg = 0.65) than that between backfat thickness and feed intake (rg = 0.37), which makes it plausible that there is a small negative genetic correlation between stayability of sows and feed intake of finishers. In summary, the association between feed intake and backfat loss during lactation with sow stayability needs further research. From the genetic correlations, one could arrive at the conclusion that the genetically heavier sows are the most promising. (Genetically) high ad libitum feed intake will yield easy-to-manage sows (less mobilization of body tissue, greater litter weight gain) but has some major disadvantages in lower stayability and lower lactation efficiency. Our study suggests that it is not necessary to increase the feed intake capacity of sows in the short term, because ad libitum feed intake is genetically uncorrelated with traits in a modern breeding goal for dam lines. Lactation efficiency will benefit from a decreased feed intake (capacity).
Simulations Simulations were performed 1) to evaluate current selection strategies in dam lines, 2) to evaluate the usefulness of lactation efficiency in a breeding goal, and 3) to test the robustness of our results. Performing these simulations gives a better understanding of the biological mechanism of energy metabolism of lactating sows. Modern Breeding Goal. We simulated a breeding program that yields a balanced genetic progress: improvement of 3 economically important traits. As a consequence, the number of piglets weaned per sow per
1078
Bergsma et al.
year will increase. Selection on an index with the total number born, litter mortality, and percent prolonged interval yielded increased stayability as measured by a first-litter survival of sows of 0.6% per generation as a correlated response. Whether this is a biological or managerial phenomenon is unclear. Perhaps sows with a high index, and thus high productivity, were less likely to be culled, which might explain the genetic correlation estimates. A breeding goal for dam lines with emphasis on the total number born, litter mortality, and percent prolonged interval from weaning to estrus will not dramatically change BW and composition at the beginning of lactation, mobilization of body tissue, and feed intake during lactation. On the other hand, it demonstrates the risks of a modern breeding goal: increased mobilization of body tissue, because feed intake capacity does not keep pace with the increased litter weight gain. Genetic improvement of the total number born, litter mortality, and percent prolonged interval from weaning to estrus is not a risk for stayability of sows, because the correlated response on stayability was positive. Given the phenotypic results from Table 1, litter mortality decreased from 11.7 to 11.5% after one generation of selection when applying the balanced breeding goal. The total number born increased from 12.56 to 12.75. With an (assumed) farrowing survival of 93%, the number of live born piglets increased from 11.68 to 11.86 piglets per litter. Live born piglets minus mortality yielded 10.31 piglets weaned before and 10.45 piglets weaned after one generation of selection. Lower litter mortality could not prevent the fact that more piglets died during lactation (11.68 − 10.31 = 1.37 vs. 11.86 − 10.45 = 1.41). Litter weight at birth increased in such a way that average birth weight also tended to increase. The average birth weight of the base population was 1.369 kg (17.2 kg/12.56 piglets). After one generation of selection, the average individual birth weight became 1.373 kg (17.5/12.75). These are rather small increases; nevertheless, most of the research done in this area has indicated that the average birth weight decreases as a consequence of selection for the total number of piglets born (Kerr and Cameron, 1996; Knol, 2001). Litter weight gain increased, and number of weaned piglets increased as well. However, as a result of selection the average weaning weight decreased by 20 g/weaned piglet per generation [(62.3 + 17.2)/10.31 = 7.71 kg vs. (62.9 + 17.5)/10.45 = 7.69 kg). A decrease of 20 g per generation is rather small (less than 0.3% of the mean). As a consequence of selection for reproductive traits (the balanced breeding goal), the fat mass as well as the protein mass of sows decreased, which is favorable for the available energy for production (input) because less energy is needed for maintenance. The correlated response for input is indeed positive. Litter weight gain (and thus output) increased, as did litter weight at birth. When output increases and feed intake does not, the mobilization of body tissue during lactation should increase. Output increased by 0.4 MJ/d per generation.
There was a difference in genetic progress between ad libitum feed intake (−0.1 kg/lactation per generation) and restricted feed intake (+0.8 kg/lactation per generation). Nevertheless, mobilization of body tissue increased slightly. Perhaps the emphasis on the interval from weaning to estrus in the breeding goal captured the possible negative consequences of increased mobilization of body tissue, associated with the interval from weaning to estrus. Ad libitum feed intake was genetically uncorrelated with traits in a modern breeding goal for dam lines.
Breeding Goal with Lactation Efficiency Included. Inclusion of lactation efficiency as a selection criterion in a breeding program, with our arbitrary economic weight, was particularly beneficial for the stayability of sows and (of course) for lactation efficiency itself. Both traits are economically relevant. On the other hand, the negative energy balance during lactation became more severe because mobilization of body tissue increased as a consequence of decreased feed intake (ad libitum and restricted). Reduced appetite as a consequence of selection on feed efficiency has frequently been reported in finishing pigs (Kanis, 1990; Kerr and Cameron, 1996). Nguyen et al. (2005), on the other hand, reported a negative genetic correlation between residual feed intake and feed intake during a performance test in 2 selection lines; 1 line was selected for high growth rate and 1 was selected for low growth rate. Two studies that have selected directly on feed efficiency in finishing pigs (Jungst et al., 1981; Webb and King, 1983) have reported insignificant responses to several generations of selection on feed intake. Nevertheless, feed intake tended to decrease. Based on these studies, a decreased feed intake might be expected as a consequence of selection for feed efficiency in lactating sows as well. Despite these factors, inclusion of lactation efficiency as a selection criterion in a breeding program looks quite promising, with no negative consequences for the traditional traits, reduced costs of feed during lactation, and improved stayability of sows. The costs of the breeding program itself would increase, however, because a very intensive registration protocol is needed. Breeding Goal with Litter Weight Gain. Genetic selection for milk yield in dairy cattle increased feed intake but also resulted in a larger negative energy balance and more mobilization of body tissue during lactation. The magnitude and duration of the negative energy balance are generally related to reduced health and fertility (Veerkamp et al., 2001), and thus probably also to reduced stayability. The simulated selection for litter weight gain only demonstrated the same phenomena in sows. Thus, selection for litter weight gain only yielded increased mobilization of body tissue with decreased stayability. Both other simulations (balanced and balanced with lactation efficiency included) yielded increased mobilization of body tissue with increased stayability. This seems contradictory. Apparently, feed intake plays a key role. In the latter simulations, espe-
Genetics of lactation efficiency in sows
cially the simulation with lactation efficiency included, feed intake decreased. Genetic selection for litter weight gain only yielded an increased feed intake (ad libitum and restricted). Future Breeding Goal. All 3 simulations gave the impression of a coherent set of genetic parameters that can be used as a starting point in the development of a breeding program. The simulation of a balanced breeding goal with or without lactation efficiency demonstrated no risk for the sow in terms of reduced health and fertility. Genetic parameters (and genetic correlations among them) within lines under selection are not constant, but can change in time (Falconer and Mackay, 1996). Conclusions now are not necessarily valid after a number of generations of selection. Although not confirmed in our study, it is expected that increased mobilization of body tissue will eventually cause fertility problems in sows. A lower feed intake capacity will yield increased mobilization of body tissue. A greater feed intake capacity, on the other hand, is a risk for the stayability of the sow. These conclusions plead for keeping the feed intake capacity during lactation more or less constant. An alternative strategy for genetic improvement of lactation efficiency is to increase the numerator of lactation efficiency (output), rather than reduce the denominator (input). If we succeeded in improving lactation efficiency at an unchanged level of feed intake, it would prevent excessive mobilization of body tissue and would increase the milk production of sows. Increased milk production facilitates sows weaning larger litters. Selection for feed intake in dam lines can serve as an insurance policy for future improvement of sow productivity.
Implications The current study yielded a coherent set of genetic parameters that can be used as a starting point for development of a breeding program. A breeding goal for dam lines with emphasis on the total number born, litter mortality, and percent prolonged interval from weaning to estrus will not dramatically change BW and body composition at the beginning of lactation, or mobilization of body tissue and feed intake during lactation. The present levels of performance, expressed as the number of piglets weaned per sow per year, are not a risk for the stayability of sows. Despite the low heritability, inclusion of lactation efficiency looks quite promising, especially when combined with selection for unchanged feed intake. Such a breeding goal would facilitate future improvement of sow productivity without negative consequences for the sow.
LITERATURE CITED Auldist, D. E., and R. H. King. 1995. Piglets’ role in determining milk production in the sow. Pages 114–118 in Manipulating Pig
1079
Production V. D. P. Hennessy, and P. D. Cranwell, ed. Aust. Pig Sci. Assoc., Werribee, Victoria, Australia. Brigham, B. W., S. E. Speidel, and R. M. Enns. 2006. Alternative Definitions of Stayability. Available at: http://www.bifconfer ence.com/bif2006/pdfs/Brigham.pdf Accessed Oct. 26, 2006. Cassady, J. P., O. W. Robison, R. K. Johnson, J. W. Mabry, L. L. Christian, M. D. Tokach, R. K. Miller, and R. N. Goodwin. 2004. National Pork Producers Council Maternal Line National Genetic Evaluation: A comparison of growth and carcass traits in terminal progeny. J. Anim. Sci. 82:3482–3485. Clowes, E. J., F. X. Aherne, G. R. Foxcroft, and V. E. Baracos. 2003. Selective protein loss in lactating sows is associated with reduced litter growth and ovarian function. J. Anim. Sci. 81:753–764. Clutter, A. C., and E. W. Brascamp. 1998. Genetics of performance traits. Pages 427–461 in The Genetics of the Pig. M. F. Rothschild, and A. Ruvinsky, ed. CAB Int., Wallingford, Oxfordshire, UK. Damgaard, L. H., L. Rydhmer, P. Løvendahl, and K. Grandinson. 2003. Genetic parameters for within-litter variation in piglet birth weight and change in within-litter variation during suckling. J. Anim. Sci. 81:604–610. Eissen, J. J., E. J. Apeldoorn, E. Kanis, M. W. A. Verstegen, and K. H. de Greef. 2003. The importance of a high feed intake during lactation of primiparous sows nursing large litters. J. Anim. Sci. 81:594–603. Everts, H., and R. A. Dekker. 1994. Balance trials and comparative slaughtering in breeding sows: Description of techniques and observed accuracy. Livest. Prod. Sci. 37:339–352. Falconer, D. S., and T. F. C. Mackay. 1996. Introduction to Quantitative Genetics. 4th ed. Pearson Education Limited, Harlow, Essex, UK. Gilmour, A. R., B. R. Cullis, S. J. Welham, and R. Thompson. 2002. ASReml Reference Manual. 2nd ed. Release 1.0 NSW Agric. Biometrical Bull. 3. NSW Agric., Orange, New South Wales, Australia. Grandinson, K., L. Rydhmer, E. Strandberg, and X. F. Solanes. 2005. Genetic analysis of body condition in the sow during lactation, and its relation to piglet survival and growth. Anim. Sci. 80:33–40. de Haer, L. C. M. 1992. Relevance of eating pattern for selection of growing pigs. PhD Thesis. Wageningen University, Wageningen, the Netherlands. Johnson, Z. B., J. J. Chewning, and R. A. Nugent. 1999. Genetic parameters for production traits and measures of residual feed intake in Large White swine. J. Anim. Sci. 77:1679–1685. Jungst, S. B., L. L. Christian, and D. L. Kuhlers. 1981. Response to selection for feed efficiency in individually fed Yorkshire boars. J. Anim. Sci. 53:323–331. Kanis, E. 1990. Effect of food intake capacity on production traits in growing pigs with restricted feeding. Anim. Prod. 50:333–341. Kerr, J. C., and N. D. Cameron. 1996. Responses in gilt post-farrowing traits and pre-weaning piglet growth to divergent selection for components of efficient lean growth rate. Anim. Sci. 63:523–531. Kim, S. W., I. Osaka, W. L. Hurley, and R. A. Easter. 1999. Mammary gland growth as influenced by litter size in lactating sows: Impact on lysine requirement. J. Anim. Sci. 77:3316–3321. Knol, E. F. 2001. Genetic aspects of piglet survival. PhD Thesis. Wageningen University, Wageningen, the Netherlands. Lo´pez-Serrano, M., N. Reinsch, H. Looft, and E. Kalm. 2000. Genetic correlations of growth, backfat thickness and exterior with stayability in Large White and Landrace sows. Livest. Prod. Sci. 64:121–131. Nguyen, N. H., C. P. McPhee, and C. M. Wade. 2005. Responses in residual feed intake in lines of Large White pigs selected for growth rate on restricted feeding (measured on ad libitum individual feeding). J. Anim. Breed. Genet. 122:264–270. Revell, D. K., I. H. Williams, B. P. Mullan, J. L. Ranford, and R. J. Smits. 1998. Body composition at farrowing and nutrition during lactation affect the performance of primiparous sows: I. Voluntary feed intake, weight loss, and plasma metabolites. J. Anim. Sci. 76:1729–1737.
1080
Bergsma et al.
Revell, D. K., I. H. Williams, B. P. Mullan, J. L. Ranford, and R. J. Smits. 1998a. Body composition at farrowing and nutrition during lactation affects performance of first-litter sows. II. Milk composition, milk yield and piglet growth. J. Anim. Sci. 76:1738–1744. Roehe, R. 1999. Genetic determination of individual birth weight and its association with sow productivity traits using Bayesian analyses. J. Anim. Sci. 77:330–343. Roehe, R., and E. Kalm. 2000. Estimation of genetic and environmental risk factors associated with pre-weaning mortality in piglets using generalised linear mixed models. Anim. Sci. 70:227–240. Rothschild, M. F., and J. P. Bidanel. 1998. Biology and genetics of reproduction. Pages 313–343 in The Genetics of the Pig. M. F. Rothschild and A. Ruvinsky, ed. CAB Int., Wallingford, Oxfordshire, UK. Rutten, M., P. Bijma, J. A. Woolliams, and J. A. M. Van Arendonk. 2002. SelAction: Software to predict selection response and rate of inbreeding in livestock breeding programs. J. Hered. 93:456–458. Serenius, T., K. J. Stalder, T. J. Baas, J. W. Mabry, R. N. Goodwin, R. K. Johnson, O. W. Robison, M. Tokach, and R. K. Miller. 2006. National Pork Producers Council Maternal Line National Genetic Evaluation Program: A comparison of sow longevity and trait associations with sow longevity. J. Anim. Sci. 84:2590– 2595. Ten Napel, J., A. G. de Vries, G. A. J. Buiting, P. Luiting, J. W. M. Merks, and E. W. Brascamp. 1995. Genetics of the interval from weaning to estrus in first-litter sows: Distribution of data, direct
response of selection, and heritability. J. Anim. Sci. 73:2193– 2203. Tholen, E., K. L. Bunter, S. Hermesch, and H.-U. Graser. 1996. The genetic foundation of fitness and reproduction traits in Australian pig populations 2. Relationships between weaning to conception interval, farrowing interval, stayability, and other common reproduction and production traits. Aust. J. Agric. Res. 47:1275–1290. Tolkamp, B. J., and J. J. M. H. Ketelaars. 1992. Toward a new theory of feed intake regulation in ruminants. 2. Costs and benefits of feed consumption: An optimization approach. Livest. Prod. Sci. 30:297–317. van der Peet-Schwering, C. M. C., M. A. H. H. Smolders, and G. P. Binnendijk. 2005. Phase feeding for gestating sows: Effects on performance and mineral excretion. PraktijkRapport Varkens. Animal Sciences Group/Praktykonderzoek, Lelystad, the Netherlands. Veerkamp, R. F. 1998. Selection for economic efficiency of dairy cattle using information on live weight and feed intake: A review. J. Dairy Sci. 81:1109–1119. Veerkamp, R. F., E. P. C. Koenen, and G. de Jong. 2001. Genetic correlations among body condition score, yield, and fertility in first-parity cows estimated by random regression models. J. Dairy Sci. 84:2327–2335. Webb, A. J., and J. W. B. King. 1983. Selection for improved food conversion ratio on ad libitum group feeding in pigs. Anim. Prod. 37:375–385. Whittemore, C. T., and C. A. Morgan. 1990. Model components for the determination of energy and protein requirements for breeding sows: A review. Livest. Prod. Sci. 26:1–37.