The Journal of Immunology
Genome-Wide Identification of Long Noncoding RNAs in CD8ⴙ T Cells1 Ken C. Pang,2*† Marcel E. Dinger,* Tim R. Mercer,* Lorenzo Malquori,* Sean M. Grimmond,*‡ Weisan Chen,† and John S. Mattick3* Previous research into the molecular mechanisms that underlie Ag-specific CD8ⴙ T cell differentiation and function has largely focused on the role of proteins. However, it is now apparent that the mammalian genome expresses large numbers of long (>200 nt) nonprotein-coding RNAs (ncRNAs), and there is increasing evidence that these RNAs have important regulatory functions, particularly in the regulation of epigenetic processes underpinning cell differentiation. In this study, we show that CD8ⴙ T cells express hundreds of long ncRNAs, many of which are lymphoid-specific and/or change dynamically with lymphocyte differentiation or activation. Numerous ncRNAs surround or overlap immunologically important protein-coding genes and can be predicted to function via a range of regulatory mechanisms. The overlap of many long ncRNAs expressed in CD8ⴙ T cells with microRNAs and small interfering RNAs further suggests that long ncRNAs may be processed into and exert their effects via smaller functional species. Finally, we show that the majority of long ncRNAs expressed in CD8ⴙ T cells harbor signatures of evolutionary conservation, secondary structures, and/or regulated promoters, further supporting their functionality. Taken together, our findings represent the first systematic discovery of long ncRNAs expressed in CD8ⴙ T cells and suggest that many of these transcripts are likely to play a role in adaptive immunity. The Journal of Immunology, 2009, 182: 7738 –7748. ytotoxic CD8⫹ T cells represent a critical arm of the adaptive immune system. They originate from common lymphoid precursors in the bone marrow and undergo subsequent selection in the thymus. Following viral infection, naive CD8⫹ T cells develop into effector cells that, upon activation, kill infected host cells and limit viral spread. Once an infection is cleared, most CD8⫹ T cells undergo programmed cell death, leaving behind a minority of self-renewable memory CD8⫹ T cells that are able to rapidly mount a protective response upon subsequent viral challenge. Intensive study over the past few decades has considerably advanced our knowledge of the functional and phenotypic changes that occur throughout the CD8⫹ T cell life cycle. Nevertheless, our knowledge of the underlying regulatory basis for CD8⫹ T cell differentiation and function remains incomplete. In the past decade, it has become increasingly evident that nonprotein-coding RNAs (ncRNAs)4 fulfill critical regulatory roles in mammalian biology. Most attention has focused on short RNAs,
C
*Australian Research Council Special Research Centre for Functional and Applied Genomics, Institute for Molecular Bioscience, University of Queensland, Brisbane, Australia; †T Cell Laboratory, Ludwig Institute for Cancer Research, Melbourne Centre for Clinical Sciences, Austin Health, Heidelberg, Victoria, Australia; and ‡Australian Stem Cell Centre, Melbourne, Australia Received for publication March 3, 2009. Accepted for publication March 20, 2009. The costs of publication of this article were defrayed in part by the payment of page charges. This article must therefore be hereby marked advertisement in accordance with 18 U.S.C. Section 1734 solely to indicate this fact. 1
This study was supported by funding from the National Health and Medical Research Council (to K.C.P.), the Wellcome Trust (to W.C.), the Foundation for Research, Science and Technology of New Zealand (to M.E.D.), Australian Postgraduate Award (to T.R.M.), the Australian Research Council, University of Queensland, and the Queensland State Government. (to J.S.M.).
2
Current address: Department of Molecular and Cellular Biology, Harvard University, 16 Divinity Avenue, Cambridge MA 02138.
including small interfering RNAs (siRNAs), microRNAs (miRNAs), and PIWI-interacting RNAs, which regulate gene expression at the transcriptional and/or posttranscriptional levels (reviewed in Refs. 1 and 2). Although less prominent, long ncRNAs (⬎200nt) have also been recognized as serving important biological functions (reviewed in Ref. 3). Air and HOTAIR, for instance, coordinate and regulate gene expression within the Igf2r and HOX loci, respectively, whereas Xist does so across an entire chromosome (4 – 6). In many cases these ncRNAs are involved in the regulation of epigenetic processes, which are central to the control of differentiation and development (7, 8). Moreover, recent genomewide studies of embryonic stem cells, adult brain, and several other tissues indicate that hundreds if not thousands of other long ncRNAs are also likely to be functional (9 –11). We were therefore interested in studying long ncRNAs in CD8⫹ T cells in the hope of gaining new insights into T cell biology and its regulation. At present, our knowledge of long ncRNAs expressed in CD8⫹ T cells is limited. A ncRNA, Tmevpg1, identified in human and mouse CD8⫹ T cells, has been shown to be located within a cluster of cytokine genes in the genome and was initially suggested to control viral load during persistent infection of the CNS (12). However, its precise role remains unknown. More recently, it was shown that noncoding transcription regulates promoter usage within the TCR␣ locus and contributes to the diversity of the TCR repertoire (13). This transcription begins in the V␣-J␣ region, extends across the entire 65-kb J␣ array, and dictates alterations in J␣ chromatin structure and J␣ recombination. Although it remains uncertain whether these effects are due to the act of transcription per se or to functions imparted by the transcribed ncRNAs, these studies nevertheless highlight the potential scope for an important role for long ncRNAs in CD8⫹ T cell biology. There are also reports of a 17-kb noncoding nuclear RNA termed NTT (14) and
3
Address correspondence and reprint requests to Dr. John S. Mattick, Institute for Molecular Bioscience, University of Queensland, Brisbane, Queensland 4072 Australia. E-mail address:
[email protected]
cytokine staining; miRNA, microRNA; RefSeq, reference sequence; rVV, recombinant vaccinia virus; siRNA, small interfering RNA; UTR, untranslated region.
4
Abbreviations used in this paper: ncRNA, nonprotein coding RNA; GNF, Genomics Institute of Novartis Research Foundation; GO, Gene Ontology; ICS, intracellular
www.jimmunol.org/cgi/doi/10.4049/jimmunol.0900603
Copyright © 2009 by The American Association of Immunologists, Inc. 0022-1767/09/$2.00
The Journal of Immunology a 1.7-kb ncRNA related to the human BIC ncRNA proto-oncogene (15) that are specifically expressed in activated CD4⫹ T cells, as well as reports of ncRNAs expressed from a conserved 40-kb region between the IL-19 and IL-10 genes in a Th2-specific manner (16). In addition, growth arrest in human T cells has been shown to be controlled by the noncoding RNA growth arrest-specific transcript 5 (GAS5) (17). This report describes the first genome-wide characterization of long ncRNAs expressed in mammalian CD8⫹ T cells. We identified and characterized over 1000 long ncRNAs in human and mouse CD8⫹ T cells, many of which displayed stage- or tissuespecific expression, neighbored protein-coding genes with wellcharacterized roles in CD8⫹ T cells, and/or overlapped shorter functional RNAs. Examination of the promoter characteristics, evolutionary conservation, and secondary structure of expressed long ncRNAs further supported the specific transcription and functional relevance of these transcripts. These data provide an important foundation for future research in this area.
Materials and Methods
Mice, viruses, and CD8⫹ T cell priming C57/BL6 (B6) and congenic B6.Ly5.1 female mice were purchased from the Walter and Eliza Hall Institute’s Animal Services Department (Kew, Australia). Animals were generally used at 8 –12 wk of age. Experiments were conducted under the auspices and with the approval of the Austin Health Animal Ethics Committee (Heidelberg, Australia) and conformed to the Australian National Health and Medical Research Council’s code of practice for the care and use of animals for scientific purposes. A/Puerto Rico/8/34 influenza virus was grown in 10-day embryonic chicken eggs. Recombinant vaccinia virus (rVV) expressing full-length OVA protein (rVV-OVA) was generated as described previously (18) and was a gift from Drs. J. Yewdell and J. Bennink (National Institute for Allergy and Infectious Diseases (NIAID), National Institutes of Health, Bethesda, MD). For CD8⫹ T cell priming, mice were injected with either 1 ⫻ 107 PFU of influenza virus via an i.p. route or 5 ⫻ 106 PFU of rVV-OVA via an i.v. route.
Cell lines and effector CD8⫹ T cell culture The thymoma cell line EL-4 and dendritic cell-like cell line DC2.4 (a gift from Dr. K. Rock, University of Massachusetts Medical Center, North Worcester, MA) were cultured in RPMI 1640 containing 10% FCS, 50 M 2-ME, and 2 mM glutamine (RP-10). For growing effector CD8⫹ T cell lines, influenza-primed B6.Ly5.1 mouse spleens were harvested and 3 ⫻ 107 splenocytes were cultured in 6-well plates with RP-10 containing 10 U/ml recombinant human IL-2 and stimulated with 3 ⫻ 106 autologous splenocytes pulsed with peptide at 10⫺9 M. Media were changed every 2 days. Viable T cells were collected through Lymphoprep gradients (AxisShield) and enriched by depleting B220⫹ and CD4⫹ cells using M-450 Dynal beads coated with appropriate mAbs. Ten to 14 days after stimulation, peptide-specific effector CD8⫹ T cells generally comprised ⬃60 – 90% of the total cells in bulk culture, as confirmed by tetramer and intracellular cytokine staining (see below).
Abs and peptides The mAbs used (FITC- or allophycocyanin-labeled anti-IFN-␥, FITC-labeled anti-CD44, FITC-labeled anti-CD45.1, PE-labeled anti-CD62L, YCChrome-labeled anti-CD8␣, and purified anti-B220 and anti-CD4) were purchased from BD Biosciences. For flow cytometry, mAbs were used at 1/200 dilution in PBS supplemented with 10% FCS. Peptides corresponding to the dominant influenza CD8⫹ T cell determinants NP366 –374 and PA224 –233 were procured and characterized by the Biologic Resource Branch of the NIAID and were gifts from Drs. J. Yewdell and J. Bennink (NIAID). In each case, substances with the predicted mass constituted ⬎95% of the material analyzed. Peptides were dissolved in DMSO at 1 mM and stored at ⫺20°C.
Tetramer analysis and intracellular cytokine staining (ICS) Influenza-specific CD8⫹ T cells were identified using tetrameric complexes of H-2Db and NP366 –374 or PA224 –233 peptide (ImmunoID). Cells were stained with PE-conjugated tetramer and Cy-Chrome-labeled antiCD8␣ mAb for 30 min at room temperature, washed, immediately assessed
7739 by flow cytometry on a FACScalibur apparatus (BD Biosciences), and analyzed using FlowJo software (Tree Star). For ICS with influenza-specific CD8⫹ effectors, EL4 target cells were used as stimulators and pulsed with peptide at a concentration of 100 nM for 30 min at 37°C, washed thoroughly, and then incubated with 0.5–1 ⫻ 105 cultured CD8⫹ effectors at 37°C for 3 h in 200 l of RP-10 in roundbottom 96-well plates with brefeldin A (Sigma-Aldrich) at 10 g/ml. For ICS with naive and memory rVV-OVA-specific CD8⫹ T cells, rVV-OVAinfected DC2.4 cells were used as stimulators and infected with saturating amounts of rVV-OVA in PBS and 0.1% BSA for 4 h at 37°C, washed thoroughly, and then incubated with 1.5–2 ⫻ 106 splenocytes at 37°C for 4 h in 200 l of RP-10 in round-bottom 96-well plates with brefeldin A at 10 g/ml. After incubation, cells were stained with Cy-Chrome-labeled anti-CD8␣ mAb with or without PE-labeled CD45.1 mAb at 4°C for 30 min, washed, and fixed with 1% paraformaldehyde in PBS at room temperature for 20 min. Fixed cells were then stained with fluorescein-antiIFN-␥ in PBS containing 0.2% saponin (Sigma-Aldrich) and analyzed by flow cytometry.
CD8⫹ T cell subset isolation To purify naive CD8⫹ T cells, T cells were initially isolated by magnetic separation from the spleens of naive B6 mice using Thy1.2 MACS beads (Miltenyi Biotec) as per the manufacturer’s instructions, labeled with antiCD8␣ and anti-CD62L mAb at 4°C for 30 min, and washed. Naive CD8⫹ T cells (CD8⫹CD62Lhigh) were then isolated via FACS on a high-speed MoFlo sorter (DakoCytomation). To purify memory CD8⫹ T cells, T cells were isolated by magnetic separation from the spleens of rVV-OVAprimed B6 mice, labeled with anti-CD8␣ and anti-CD44 mAb, and washed. Memory CD8⫹ T cells(CD8⫹ CD44high) were then isolated via FACS. To purify activated effector CD8⫹ T cells, cells in bulk culture were initially activated by coculturing for 3 h at 37°C with EL-4 target cells prepulsed with the relevant peptide at 10⫺7 M. The cells were then labeled with anti-CD8␣ and anti-CD45.1 mAbs and washed. Activated effector CD8⫹ T cells (CD8⫹CD45.1⫹) were then isolated via FACS. To purify nonactivated, effector CD8⫹ T cells, cells in bulk culture were initially cocultured for 3 h at 37°C with unpulsed EL-4 target cells. Cells were then labeled with anti-CD8␣ and anti-CD45.1 mAbs and washed. Nonactivated effector CD8⫹ T cells (CD8⫹CD45.1⫹) were then isolated via FACS. After sorting of each CD8⫹ T cell subset, cell purity was checked by flow cytometry and found to be ⬃91–98% of the desired population.
RNA isolation and labeling RNA was purified from CD8⫹ T cell subsets using an RNeasy mini kit (Qiagen), and the quality of purified total RNA samples was assessed with an RNA 6000 Nano assay kit using the Agilent 2100 Bioanalyzer (Agilent Technologies) according to the manufacturer’s instructions. For microarray experiments, RNA was amplified and labeled using the Amino Allyl MessageAmp II kit (Ambion) following the instructions provided by the manufacturer. Amplified aminoallyl RNA was labeled with either Cy3 or Cy5 monoreactive dyes (GE Healthcare) according to the MessageAmp II protocol (Ambion). Satisfactory dye incorporation was confirmed by spectrophotometric analysis, and the quality and quantity of amplified RNA samples were assessed using the Agilent 2100 Bioanalyzer.
Custom microarray expression analysis Design of the custom microarray has been described elsewhere (10), and it is available from the ArrayExpress data warehouse (European Molecular Biology Laboratory-European Bioinformatics Institute (EMBL-EBI; ArrayExpress accession no. A-MEXP-1070; www.ebi.ac.uk/microarrayas/ae/). In summary, the microarrays contained 22,038 65-mer oligonucleotide probes from the Compugen mouse oligo library and 2,118 70-mer oligonucleotide probes that were designed to specifically target ncRNAs, including known mouse pre-miRNAs from miRBase (19), longer mouse ncRNAs from RNAdb (20), and “high confidence” ncRNAs identified from the FANTOM3 project (21). Probes were printed on PowerMatrix slides (Full Moon BioSystems) at the Special Research Centre Microarray Facility of the University of Queensland (Brisbane, Australia), and the quality of the print run was verified by hybridizing random 10-mer oligonucleotides to the first and last slides of the run. Naive and memory CD8⫹ T cells were compared by competitively hybridizing 5 g of Cy3- or Cy5-labeled RNA from each subset to individual microarrays. Activated and nonactivated effector CD8⫹ T cells were similarly compared. Two biological and three technical replicates (including dye swaps) were performed for each comparison. Blocking, hybridization, and washing were performed according to the manufacturer’s instructions (Full Moon BioSystems). Slides were scanned at 5-m resolution using a DNA microarray scanner (Agilent Technologies). Feature extraction was
7740 performed with ImaGene software (BioDiscovery) using manual grid adjustment, autospot finding, and segmentation. Data was exported from ImaGene and analyzed using the LIMMA (Linear Models for Microarray Data) software package via the R Project for Statistical Computing (www.r-project.org). Data were background corrected, normalized both within and between arrays (22), and differential expression analysis was performed by fitting a linear model of the data to the experimental design matrix and then calculating Bayesian statistics (B statistics; posterior log odds) adjusted for multiple testing using Benjamini-Hochberg analysis (23). Based on previous analyses (10), an A value of ⬎7 was selected as a conservative indicator of probe expression, and a B statistic of ⬎3 and a fold change of ⬎1.5 were selected as the threshold for significant differential expression. Raw and processed microarray data is available at the ArrayExpress data warehouse (EMBL-EBI; ArrayExpress Accession nos. E-TABM-491 and E-TABM-492; www.ebi.ac.uk/microarray-as/ae/).
Microarray probe classification Our microarray probe classification has been reported previously (10, 24) but has been recently updated and is described here in detail. Although the Compugen mouse oligo library probe set was predominantly designed to recognize protein-coding transcripts, several thousand probes targeted miscellaneous transcripts whose coding status was not well characterized at the time this commercial probe set was first produced. A computational pipeline was therefore designed to reannotate the entire probe set. Sequences for all probes were mapped to the February 2006 (National Center for Biotechnology Information (NCBI) build 36) assembly of the mouse genome using BLAT (BLAST-like alignment tool) (25), and probes that mapped uniquely to the genome were analyzed further. Probes that targeted protein-coding transcripts were initially identified based upon genomic overlap with all known protein-coding mRNAs in mouse and other mammals as defined by NCBI reference sequence (RefSeq) (26), the Mammalian Gene Collection (27) and the University of California Santa Cruz (UCSC) Known Genes (28). Next, we applied the CRITICA (coding region identification tool invoking comparative analysis) algorithm to assess the protein-coding capacity of all remaining transcripts (29). Probes corresponding to transcripts that CRITICA predicted to be protein coding were annotated as such. Probes that did not target protein-coding genes were then classified as either “noncoding” if they targeted a transcript of ⬎200 nt designated by CRITICA as a ncRNA or “unknown” if they targeted a genomic region without any associated transcript. Notably, many individual probes were found to jointly recognize both protein-coding and noncoding transcripts. This was hardly surprising given the highly interlaced nature of the mammalian transcriptome (30, 31), but given the potential ambiguity of using such probes, they were excluded from all subsequent analyses.
Genomics Institute of the Novartis Research Foundation (GNF) SymAtlas analysis Publicly available GNF Gene Expression Atlas data (symatlas.gnf.org) (32) were downloaded for mouse and human tissues. GNF probes were classified using the same computational pipeline described above. Absent/ present/marginal calls were obtained from the above GNF web site and used to identify probes with detectable expression. Hierarchical clustering of expressed probes was based upon the Pearson correlation and the single linkage method using Cluster software (33) and visualized via Java TreeView (34).
Gene Ontology (GO) term analysis The GO project (www.geneontology.org/) provides a controlled vocabulary for functionally annotating genes. By studying GO terms associated with a large set of genes, one obtains useful information about the types of genes represented. Lists of differentially expressed protein-coding genes identified from the custom ncRNA microarray experiments were uploaded into GOstat (gostat.wehi.edu.au/) (35). Statistically over-represented GO terms in the biological process and molecular function categories were obtained by applying a p value cutoff ⬍ 0.05, correcting for multiple testing with the Benjamini false discovery rate, and using the Mouse Genome Informatics (MGI) database (www.informatics.jax.org) as the reference set.
Quantitative real-time PCR (qRT-PCR) cDNA preparation and quantitative RT-PCR analysis were performed as previously described (10). The following primers were used to quantitate Ptpre and Ptpreas isoform levels: Ptpre long, 5⬘-TCCCAGCCGCT GCTCA-3⬘ (forward) and 5⬘-AGAACTTCTTGGGGCCTGAT-3⬘ (reverse); Ptpre short, 5⬘-AAGAACTTTTCCCGGCTCAC (forward) and 5⬘AGAACTTCTTGGGGCCTGAT-3⬘ (reverse); AK017962, AK020025, and AK08864, 5⬘-AGCCTCCAGCACACTCATTT-3⬘ (forward) and 5⬘-
LONG NONCODING RNAs IN CD8⫹ T LYMPHOCYTES GAGAAGCAGGCTTTTGATGG-3⬘ (reverse); and AK148045, 5⬘-CCTT GTGAAGCCCTTGAGAG-3⬘ (forward) and 5⬘-GTGAACGAACATCA CCATCG-3⬘). In all quantitative RT-PCR experiments, a minimum of three replicates was performed and RNA levels were quantified relative to Tubulin-D1 RNA expression using the following primer: 5⬘-GCTTG GCATGTCGATAGTGA-3⬘ (forward) and 5⬘-GAACAGAGTCCCTGG GAACA-3⬘ (reverse).
ncRNA genomic context analysis Determination of the genomic context of ncRNAs (relative to protein-coding genes) has been described previously (9, 36) but was updated for this study. In summary, cis-antisense ncRNAs were defined where the corresponding targeted transcript was mapped to the opposite strand of a RefSeq-annotated exon (this includes 5⬘-untranslated region (UTR), coding, and 3⬘-UTR); intronic ncRNAs were defined where the corresponding probes mapped within the intron of a protein-coding gene; bidirectional ncRNAs were defined where the corresponding probes targeted transcripts that were oriented head-head to a protein-coding gene at a distance of ⬍1000 bp; and promoter-associated ncRNAs were defined where the targeted transcripts overlap the RefSeq-annotated transcription start site.
ncRNA promoter analysis Promoter regions were classified as described previously (37). Briefly, transcripts with a 500-bp interval within ⫺0.5 to ⫹2 kb of the transcription start site with a GC fraction ⱖ 0.55 and an observed-to-expected ratio ⱖ 0.6 were classified as high CpG promoters. Promoters where all of the 500-bp intervals within ⫺0.5 to ⫹2 kb of the transcription start site have a CpG observed-to-expected ratio ⱕ 0.4 were classified as low CpG promoters. CpG observed-to-expected ratios were calculated as described previously (38). Promoter methylation status was obtained from publicly available DNA methylation maps previously generated for mouse CD8⫹ T cells (39). These maps were constructed using high-throughput, reduced representation bisulfite sequencing and provided ⬎5 million high-quality sequencing reads covering a majority of CpG islands within the genome.
Evolutionary conservation and secondary structure analysis of ncRNAs ncRNA conservation and secondary structure composition were determined by intersecting their chromosomal positions with those of genomewide PhastCons elements (40) and RNAz predictions (41), respectively. The PhastCons program uses genome alignments across multiple vertebrate species to identify conserved genomic regions based upon a phylogenetic hidden Markov model (40). The RNAz program predicts functional ncRNAs by identifying genomic regions that contain thermodynamically stable and conserved RNA secondary structures (41). The significance of these predictions is represented by the class probability P, and conserved RNA secondary structure predictions were considered significant at a threshold of P ⬎ 0.5 as previously reported (42). We also used RNAfold software to predict and visualize the secondary structure of selected ncRNAs (43).
Results Genome-wide expression analyses reveal presence of hundreds of long ncRNAs in CD8⫹ T cells To investigate the extent to which long ncRNAs are expressed in CD8⫹ T cells, we analyzed three independent microarray expression data sets. The first two data sets, from human and mouse, were derived from the GNF Symatlas (symatlas.gnf.org/) (32). The third was based on a custom-designed microarray (10), and the results from each analysis are presented below. The GNF Symatlas is a large-scale, publicly available gene atlas that features expression data for 44,775 human and 36,182 mouse transcripts using whole genome Affymetrix arrays. In total, the atlas profiles 79 human and 61 mouse tissues, including a variety of immune-related organs and cell types (e.g., CD8⫹ T cells). Although the probe set used by GNF was designed primarily to target the protein-coding transcriptome, we had informally observed that some probes appeared to target long ncRNAs. We therefore designed a computational pipeline to systematically classify the GNF probe set (see Materials and Methods) and found that 1,234 human and 5,622 mouse probes uniquely recognized long ncRNAs. Of these, 268 (22%) and 1,211 (22%) were expressed in human
The Journal of Immunology
7741
FIGURE 1. Hierarchical clustering of long ncRNAs expressed in mouse tissues. Affymetrix MAS5 call data for individual mouse GNF ncRNA probes were obtained for 61 different tissues examined in the GNF Symatlas. A, Three thousand, three hundred fifty-seven probes were expressed in at least one tissue and hierarchically clustered based upon their tissue distribution. Individual rows represent a single ncRNA probe, individual columns represent different tissue types (supplemental Table S2A), and individual pixels are colored to reflect expression (white, present; gray, marginal; black, absent). Many ncRNA probes show widespread expression, whereas others form tissue-specific clusters. B, Lymphoid-specific ncRNAs were clustered into two main blocks representing either shared (bottom, orange) or restricted (top, blue) lymphoid expression in the indicated tissues.
and mouse CD8⫹ T cells, respectively (supplemental Tables S1A and S1B).5 We recently designed custom ncRNA microarrays whose probes uniquely profile 4,329 high-confidence long ncRNAs (and 14,316 protein-coding transcripts) from the mouse genome (10). To complement the GNF data, we used these arrays to generate a third data set that examined the expression of CD8⫹ T cells at different stages of differentiation and activation. After naive CD8⫹ T cells encounter Ag, a minority of them differentiate into Ag-specific memory cells over subsequent weeks. This transition is typically characterized by down-regulation of L-selectin (CD62L) and upregulation of Pgp-1 (CD44) (44). We used FACS to isolate highly purified populations of naive (CD62Lhigh) and memory (CD44high) CD8⫹ T cells from the spleens of unprimed and vaccinia-infected B6 mice, respectively (supplemental Fig. S1A). Consistent with the expected functional differences between these two subsets, only memory CD8⫹ T cells were able to produce IFN-␥ upon exposure to viral Ag (supplemental Fig S1B). To obtain effector CD8⫹ T cells, we harvested splenocytes from mice infected ⬎30 days earlier with influenza virus and exposed the cells to influenza-specific peptides in vitro. After 10 –14 days, effector cells were activated via coculture with peptide-pulsed target cells and isolated to high purity by FACS (supplemental Fig. S1A); nonactivated control effector cells were similarly purified by FACS following coculture with unpulsed target cells. As expected, only activated CD8⫹ T cells produced IFN-␥ in an ICS assay (supplemental Fig. S1B) and, 5
The online version of this article contains supplemental material.
based upon tetramer staining, down-regulated TCR surface expression (supplemental Fig. S1C). Following isolation of each of these CD8⫹ T cell subsets, RNA was competitively hybridized to custom ncRNA microarrays. Experiments were designed to directly compare either naive and memory cells or activated and nonactivated effector cells. Of 4,329 noncoding probes examined, 1,106 (26%) were expressed in at least one of these experiments (supplemental Table S1C). Interestingly, the majority of these were common to both experiments (740/1106; 67%), whereas the remainder were expressed only in naive/memory cells (97/1106; 9%) or effectors (269/1106; 24%). Differential expression of long ncRNAs in CD8⫹ T cells We expected that some ncRNAs expressed in CD8⫹ T cells would fulfill general cellular housekeeping functions and were thus likely to be expressed ubiquitously; alternatively, other ncRNAs might have specific roles in T cell immunity and be expected to display lymphoid-restricted and/or stage-specific expression. To investigate these possibilities, we performed hierarchical clustering of the mouse GNF Symatlas ncRNA data set. The majority of noncoding probes (60%; 3354 of 5622) were expressed in at least one of 61 tissues examined. Of these, 33% (1110 of 3354) were present in the majority of tissues (supplemental Table S2A) whereas the remainder showed more limited expression patterns (including testis-specific, oocyte-specific, CNS-specific, and thyroid-specific clusters) (Fig. 1A). Of particular interest was the presence of 96 lymphoid-specific ncRNAs whose expression was generally either shared between or restricted to particular lymphoid organs (spleen,
LONG NONCODING RNAs IN CD8⫹ T LYMPHOCYTES
7742 Table I. Genomic context of expressed ncRNAsa
Probe set
Total expressed ncRNAs
Cis-antisense
Intronic
Bidirectional pairs
Promoteroverlapping
Custom mouse array ncRNAs
1106
204 (18%)
343 (31%)
89 (8%)
22 (2%)
GNF mouse ncRNAs
1211
263 (22%)
555 (46%)
37 (3%)
54 (4%)
GNF human ncRNAs
268
43 (16%)
85 (32%)
4 (1%)
1 (0.4%)
a The percentage of expressed transcripts from the total targeted by the array in each class is indicated in parentheses. For detailed information on each expressed transcript, see supplemental Tables S3–S5.
thymus, bone marrow, or lymph node) or lymphocyte subsets (CD8⫹, CD4⫹, or B cells) (Fig. 1B; supplemental Table S2B). In total, 29 of these lymphoid-specific ncRNAs were expressed in CD8⫹ T cells. Hierarchical clustering of the human GNF ncRNA data set produced similar clusters of ubiquitous and lymphoidspecific ncRNAs (supplemental Fig. S2). To identify ncRNAs that might be important during CD8⫹ T cell differentiation and activation, we examined the custom ncRNA array data set for ncRNAs whose expression was dynamically regulated. One hundred six of 1106 expressed noncoding probes (10%) were differentially expressed under the experimental conditions tested. Of these, 21 were significantly altered during naive to memory cell differentiation, 81 changed during effector cell activation, and four were differentially expressed during both transitions (supplemental Table S2C). Importantly, analysis of protein-coding probes on the custom array confirmed that our microarray experiments had successfully identified biologically relevant transcripts: many mRNAs with known roles in CD8⫹ T cell biology were dynamically regulated (supplemental Table S2D) in conjunction with long ncRNAs, and GO terms such as T cell differentiation and T cell activation were significantly enriched among the differentially expressed mRNAs ( p ⬍ 0.05). Expressed long ncRNAs share loci with protein-coding genes Long ncRNAs have previously been shown to originate from complex loci that contain interlaced networks of noncoding and protein-coding transcripts (31, 36). In these instances, the exact nature of the genomic relationship between long ncRNAs and their overlapping neighbors often has important functional consequences, especially in relation to local epigenetic regulation (5, 6, 8, 45– 47). Therefore, we characterized long ncRNAs as cis-antisense, intronic, bidirectional, and promoter-associated ncRNAs based upon their orientation to local protein-coding genes (see Materials and Methods, Table I, and supplemental Tables S3–S5). In doing so, we discovered that many ncRNAs associated with protein-coding genes, many of which fulfill previously characterized roles in T cell biology. A number of compelling examples are detailed below. cis-Antisense ncRNAs cis-Antisense transcripts are prevalent throughout the mammalian genome (48, 49) and are believed to regulate expression of neighboring mRNAs via a range of mechanisms, including chromatin modification, alternative splicing, endogenous siRNA generation, translational interference, and small RNA promoter targeting (47, 50 –56). Within our data sets, we found that 16 –22% of expressed ncRNAs was organized antisense to protein-coding exons (Table I
and supplemental Tables S3A–S5A). For example, a ncRNA (AK029296, Lef1as RNA) was identified antisense to the lymphoid enhancer binding factor 1 Lef1 (Fig. 2A). Lef1 is a downstream effector molecule in the Wnt signaling pathway and acts as a transcription factor to critically regulate T cell differentiation. Lef1 exists in two isoforms; the longer isoform acts as a transcriptional enhancer while the shorter one, missing a critical 5⬘ domain, has dominant negative function (57). In naive CD8⫹ T cells, the shorter inhibitory isoform predominates but is down-regulated following Ag encounter (58). The antisense ncRNA, which we named Lef1as, overlaps exclusively with the longer isoform and is predominately expressed in naive T cells (Fig. 2A), consistent with a possible role in suppression of the longer isoform. This organization is also apparent in the human Lef1 locus, which indicates that this cis-antisense pairing is conserved and therefore likely to be functional. We also identified an antisense ncRNA that lies opposite to the protein tyrosine phosphatase receptor type E (Ptpre) gene in a highly complex locus (Fig. 2B). Ptpre exists as two isoforms generated by alternative promoter usage; the longer form is membrane bound and the shorter one is cytoplasmic and selectively inhibits the Jak-Stat pathway critical for cytokine signaling in T cells (59). The antisense ncRNA, named here Ptpreas, itself exists as several different isoforms that vary in the extent to which they overlap with the different isoforms of Ptpre. Although all isoforms overlap with a common Ptpre coding exon, only the three shorter isoforms (AK017962, AK020025, and AK088640) overlap with the transcription start site and first exon of the shorter cytoplasmic Ptpre transcript (Fig. 2B, see inset), because the sequence complementary to this region is spliced from the longer ncRNA isoform (AK148045). We hypothesized that the different Ptpreas ncRNAs might function to regulate the balance of the two Ptpre variants in CD8⫹ T cells. However, specific profiling of the different Ptpreas and Ptpre isoforms by quantitative RT-PCR failed to establish any direct correlation between them (Fig. 2B, lower panel). Intronic ncRNAs At complex loci, the most common organizational arrangement we observed involved expressed CD8⫹ T cell ncRNAs hosted within the introns of protein-coding genes (31– 46%; Table I and supplemental Tables S3B–S5B). In some cases, long ncRNAs were completely nested within individual introns. For example, we identified a number of ncRNAs (M21979, M21980, and M21981) hosted within the introns of the IL 2 receptor IL2R␣ (Fig. 2C). These ncRNAs directly flank the seventh and ninth exon of the Il2ra gene and were previously considered simple artifacts of unprocessed Il2ra mRNA (60). However, we observed strong and up-regulated expression of one of these ncRNAs (M21981) upon effector cell activation, although the ncRNA was not expressed during the differentiation of naive to memory cells. In contrast, the Il2ra gene itself is strongly up-regulated in both transitions as previously reported (61, 62), suggesting that the fate of the mRNA and intronic ncRNA might be independently regulated. Furthermore, homologous ncRNAs are apparent within the human Il2ra gene, suggesting this unusual organization is conserved within the mammalian lineage (Fig. 2C). Bidirectional ncRNAs More than 1000 bidirectional transcript pairs have been previously identified within both mouse and human genomes that encompass ⬃10% of known genes (36, 63). Unlike cis-antisense transcripts, bidirectional pairs do not share any genomic overlap but instead are separated by ⬍1000 bp, are divergently transcribed, and typically share a common CpG island promoter. Among expressed
The Journal of Immunology
7743
FIGURE 2. Expressed ncRNAs share loci with CD8⫹ T cell-related, protein-coding genes. Long ncRNAs expressed in CD8⫹ T cells were categorized based upon their orientation to neighboring protein-coding genes. Examples of cis-antisense (A and B), intronic (C), bidirectionally oriented (D), or promoter-associated (E) ncRNAs are shown. Each panel illustrates the organization of the ncRNA (red, transcription initiation direction indicated by arrow) to associated protein coding gene (blue). For clarity, only selected mRNAs from the GenBank track are shown. A, Lef1as (AK029296) and Lef1 genomic locus. B, Top panel and inset, Ptpreas (short isoforms: AK017962, AK020025, and AK088640; long isoform: AK148045) and Ptpre genomic locus. Lower panel, Expression profiling of the indicated transcripts by quantitative RTPCR (see Materials and Methods for details). C, Il2ra intronic ncRNAs (M21979, M121980, and M21891) are found adjacent to the exon boundaries of Il2ra (see detailed inset). This intronic organization is also conserved in humans as shown. D, The Snhg1 ncRNA is organized bidirectional to the Slc3a2 gene with which it shares a CpG island. Multiple C/D box snoRNAs (Snord22–31) are nested within introns of Snhg1. E, A promoter-associated ncRNA (AK009498) overlaps the promoter and 5⬘-UTR of the Flip gene in the sense orientation.
CD8⫹ T cell ncRNAs, ⬍10% formed bidirectional pairs (Tables I and supplemental Tables S3C–S5C). As an example, the long ncRNA Snhg1, previously identified as a host gene encoding multiple small nucleolar RNAs (snoRNAs) within its introns (64), is bidirectional to the amino acid transporter, Slc3a2 (Fig. 2D). Also known as Ly-10 or CD98, Slc3a2 was originally identified in lymphocytes and subsequently considered a marker of T cell activation (66, 66). We observed an up-regulation of Slc3a2 upon CD8⫹ effector cell activation in mouse as expected, as well as an up-
regulation of Snhg1. Interestingly, the bidirectional orientation of these two transcripts, arising from a common CpG island promoter, is conserved in both human and mouse, which suggests that the observed coupling is functional. NcRNAs overlapping promoters Transcription of long ncRNAs across promoters of protein-coding genes that lie downstream on the same genomic strand has been shown to regulate mRNA expression both positively and negatively
7744
LONG NONCODING RNAs IN CD8⫹ T LYMPHOCYTES
FIGURE 3. Long ncRNAs expressed in CD8⫹ T cells overlap small RNAs. Long ncRNAs that were expressed in CD8⫹ T cells and overlap small RNAs were identified. Each panel illustrates the organization of the ncRNA (red; transcription initiation direction indicated by arrow) to annotated small RNA (green) or protein coding gene (blue). Blue histogram indicates conservation within vertebrates according to MultiZ alignment (mm8; UCSC Genome Browser). For clarity, only selected mRNAs from GenBank track are shown. A and B, We identified ncRNAs that overlap previously annotated miRNAs such as mmumir-22 (AK008813) (A) and mir142–5p and mir-142–3p (AK020764) (B). C, We also identified examples of long ncRNAs (AK010403) that overlap novel small RNAs (see detailed inset illustrating red, purple and blue small RNAs from mouse embryonic stem cells according to Barbiarz et al. (82). D, These small RNAs correspond to stems, as colored, within RNA secondary structure as predicted by RNAz and folded according to CONTRAfold (97).
(13, 67). For example, cascading ncRNA transcription across a yeast promoter was recently shown to convert chromatin to an open structure and thereby increase accessibility to transcription cofactors and RNA polymerase II binding (68). ncRNA transcription has also been shown to inform the promoter choice of the TCR (13). Indeed, in our profiling experiments we identified a long ncRNA (AK030929) expressed from the V␣-J␣ region at the 3⬘end of the TCR␣ locus, consistent with this previously reported role of noncoding transcription regulating J␣ promoter activity. We therefore searched systematically for long ncRNAs that overlapped promoters and transcription start sites of protein-coding genes and found that such ncRNAs represented ⬍5% of expressed ncRNAs (Table I and supplemental Tables S3D–S5D). Many of these ncRNAs overlapped the 5⬘-end of protein-coding genes that function in a T cell development. For example, a long ncRNA (AK009498) overlapped the transcription start site of Flip (Fig. 2E), a gene essential for the development and survival of mature T lymphocytes (69, 70). Interestingly, we observed that Flip is up-regulated during the transition of T cells to an activated or memory phenotype, whereas AK009498 is in contrast down-regulated during both of these transitions in keeping with a potential negative regulatory function. Expressed long ncRNAs frequently overlap small RNAs Small ncRNAs such as miRNAs and snoRNAs can be processed from longer primary ncRNAs (51, 72–74) as we noted earlier with
Snhg1 (Fig. 2D). To explore the possibility that other long ncRNAs expressed in mouse CD8⫹ T cells might also act as primary transcripts for small RNAs, we systematically searched for genomic overlap between expressed long ncRNAs and known small RNAs. Mature miRNAs bind to the 3⬘-UTRs of mRNAs and, in doing so, regulate the stability and fate of thousands of protein-coding transcripts (reviewed in Ref. 75). We found that 18 long ncRNAs expressed in mouse CD8⫹ T cells overlap annotated miRNAs (supplemental Table S6A), and a further 21 overlap with snoRNAs (supplemental Table S6B). For example, a long ncRNA (AK008813) up-regulated during effector cell activation contains mmu-mir-22 within its second exon (Fig. 3A). This direct overlap suggests that the long ncRNA is likely to be processed into and function via this smaller RNA, and indeed mir-22 has recently been detected at a low copy number in CD8⫹ effector cells (76). Moreover, the most strongly predicted targets of mmu-mir-22, based on the TargetScan algorithm (77), include multiple genes that function in CD8⫹ effector cells (supplemental Table S6C). One of the most strongly up-regulated ncRNAs during effector cell activation (AK053349) partially overlaps a well-characterized cluster of miRNAs (mir-17/18/19a/20a-1/19b/ 92-1). Interestingly, this cluster is often amplified in human lymphomas (78, 79) and its forced overexpression in mouse lymphocytes results in lymphoproliferative disease and autoimmunity, most likely
The Journal of Immunology
7745
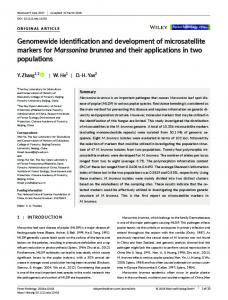
chr11:3,539,788-3,547,539 (mm8)
0
1kb
Tug1 DQ517434
s
PhastCons elements
chr11:83,478,650-83,481,800 (mm8)
0
500bp
RNAz predicted secondary structure
Ccl4 AK154685
410 C UU A C 405 U U A A A A C U G 415 400 G U U A C A 385 U A A AA U A A A 395 A G U 420 A G U G A 390 A U 380CU A GA A A U 425 A AU U U U 375A U A A 430 U U A U A U AA A A U 370 A 365GU U435 A U A U A A U 360U A U440 A U A U A U U 355A A U445 A A A A U A C 350U A A AA U 450 U A U 345A U A A 455 U U 340G U 460 A CA AA UU A U A 465 U CA UU A 495 470 UA UC AA A C CUC A AA 335 U 475 UG CA A U UA UA A A 320 C500 A C 485 A UA G 325 315 A A G A 480 U UU U C GC C U U CC 490 U C A UA A U A A 310 A U CAAU UG A 330 A A AG AC C CC 305 G 505 CU 300A A 510 C U U UUC AA C 515 C G 295 C 290GG A U C 520 A CC CAU C C AU525 G 545 285 G G C UC C U C UA AGGG C 530 A GC CU 280 U G U U C U 535 540U G 550 G CCCC A 275 U G G U G G 555 A A GU 270 C G A G G G G GC A AC C U U 265 CA C C 260G 565 C C C U 570 G U 560 U G A U C G C 255G C 575 G A U C G U A U 250G C 580 G C G A U C CA585 245AG U A A G C A C A A C U 590 240 C G U G C G U 235A A 595 C G C C G A U U 230A C 600 A C G C G C G C 225G U 605 A U A U A G U C 220G U 610 A G 615 C GG G C A U 215 C C C AC A U GA A CC 620 A U C 625 210G A C A A AU G GU A 205U G 630 G C A U C 200G U G A 635 U U A C G C G 195 C G C C 640 G C G U C 190A C G C 645 A C U G U C 185A G C G U 650 G AC U G 180U G A A 655 C U U A GC C 175C C 720 A 660 C UU U G G U A A A U C U UA 715 A U G 170 G G U A 665 U 725 G G G U A U G C C G 710A C C 670 C G 165 G A U C G U G 730 U U C GU C C A U U 675 G 705C 160 A U C C A U U G A735 G G A U A C U G C C 155 G A680 700G U C U U C 740 A U U 745 A U G A 685 G A GC C G U 150 A GG 695C U U G C A U 690 G G A G U 750 C AU C U G G 145 C C C U CC CU G A UG A G A 125 A 120A U755 A 140 C C U C U C G U G C U 130 A U A G760 C C U G135 G U 115 CA U A A 765 U G U C U 110 AA G A G U770 U A A U U 105 A U G A U775 C 790 UU A UG C 785 G G U U 100AC A U 780 UG G A CC UG AA A C C 795 G CC 95 G A CUU CG 800 U A 805 G C G C A U 90 U U 810 A C G A U G UC815 C UU 85 C C C 820 A C U AG U A A
L1 LINE elements
FIGURE 4. Evolutionary conservation of long ncRNAs expressed in CD8⫹ T cells. Long ncRNAs that were expressed in CD8⫹ T cells and show evidence of either primary sequence or secondary structure conservation were identified. NcRNAs (red; transcription initiation direction indicated by arrow) and protein coding gene (blue) are shown above histogram (blue), indicating conservation within vertebrates according to MultiZ alignment (mm8; UCSC Genome Browser). A, Tug1 and an alternative isoform (DQ517434) that exhibit strong conservation are widely overlapped with PhastCons elements (black). B, An ncRNA (AK154685) overlaps the entire Ccl14 gene and two inverted LINE elements (green) that are strongly predicted to form an extended RNA duplex (see inset). Additional predicted RNA secondary structures are shown (pink).
via enhanced lymphocyte proliferation and survival following activation (80). Lastly, two miRNAs, mir-142-5p and mir-142-3p, recently shown to be among the most highly expressed miRNAs in naive, memory, and effector CD8⫹ T cell populations (76), are hosted within the first intron of a long ncRNA (AK020764) that is also strongly expressed in CD8⫹ T cells (Fig. 3B). When mir-142-5p is ectopically expressed in hematopoietic progenitor cells, the proportion of cells differentiating down the T lymphoid lineage increases (81), further supporting a role for mir-142, and by extension AK020764, in T cell biology. Recently, it has been demonstrated that endogenous siRNAs exist within a variety of mouse tissues, including oocytes and embryonic stem cells (51, 82, 83). These reports also revealed a diversity of mammalian small RNA-generating pathways and an abundance of other novel small RNAs, the functions of which are still largely unknown. To estimate the extent to which our long ncRNAs might be processed into siRNAs and other novel small RNAs, we examined the genomic locations of these recently identified small RNAs and compared them to those of the long ncRNAs expressed in CD8⫹ T cells. Although the small RNAs we examined were derived from embryonic stem cells and might not include the full range of small RNAs found in T cells, we nevertheless found that ⬃20% of long ncRNAs expressed in mouse CD8⫹ T cells on the custom arrays directly overlapped these small RNAs (supplemental Table S6D). In some cases, these small RNAs overlapped stable secondary structures within the long ncRNAs. For instance, a long ncRNA (AK010403), abundantly expressed in T cells, was identified directly downstream of Nbl4a, a component of the -catenin/Tcf pathway (84). This ncRNA is
predicted to fold into a highly stable structure whose extended dsRNA regions are likely to be processed into numerous small RNAs (Fig. 3, C and D). Another prominent example of a long ncRNA overlapping small RNAs was MALAT1 (supplemental Fig. S3), a long ncRNA previously associated with nuclear S35 splicing domains (85). We found that MALAT1 is associated with abundant small RNAs previously identified from mouse oocytes and embryonic stem cells (51, 82). Interestingly, these small RNAs are not significantly altered after Dicer knockdown, suggesting they are not produced by the canonical Dicer-dependent dsRNA cleavage pathway (82). Consistent with this observation, MALAT1 was recently shown to be cleaved by RNase P to generate a small tRNAlike cytoplasmic ncRNA (86), and our findings suggest that additional small RNAs might be generated from non-Dicer RNases. Promoter analysis and DNA methylation status of expressed ncRNAs Mammalian gene promoters can be classified into distinct categories based on their CpG dinucleotide content. The majority of protein-coding genes (⬃64%) have high CpG content (HCG) (37) and typically play “housekeeping roles” within the cell (87). In contrast, low CpG (LCG) content is seen with ⬃17% of genes (37) whose functions are generally tissue specific (87). In this way, promoter class can provide clues to gene function. We therefore classified the promoters of long ncRNAs expressed in mouse CD8⫹ T cells. Of those identified on the custom arrays, surprisingly only 22% had HCG content, whereas 32% had LCG content. Similar results were obtained for CD8⫹ T cell ncRNAs identified from the mouse GNF atlas (23% HCG and 36% LCG). Taken at
7746 face value, these results indicate that a greater proportion of long ncRNAs are likely to exert tissue-specific effects, as suggested by previous studies (9). However, our results should be treated with some caution, because the 5⬘-ends and promoter regions of long ncRNAs are currently not as well annotated as those of proteincoding genes. DNA methylation helps determine local chromatin architecture and gene expression, with unmethylated CpG dinucleotides indicative of an open chromatin conformation and regional transcription. To determine the methylation status of ncRNA promoters, we compared previously published, genome-wide DNA methylation maps for mouse CD8⫹ T cells with the 5⬘ start sites of long ncRNAs expressed on the custom arrays (39). For this analysis, we focused on 208 ncRNAs with HCG promoters, because their annotation (and therefore methylation status) was likely to be the most reliable. Of these ncRNAs, 29 (14%) had HCG promoters that were specifically unmethylated in CD8⫹ T cells (and methylated in other tissues) (supplemental Table S7), providing further evidence that the expression of these transcripts is regulated in CD8⫹ T cells. Expressed ncRNAs exhibit evolutionary conservation of primary sequence and predicted secondary structure Across evolutionary time, the purifying selection of functional genomic elements results in the presence of sequences that exhibit high levels of conservation across multiple species, providing a useful indicator of function. We therefore identified elements (known as PhastCons elements) within expressed CD8⫹ T cell ncRNAs that are strongly conserved across species (40). We found that the majority of human and mouse ncRNAs expressed in CD8⫹ T cells contained PhastCons elements: 180 of 268 human (67%), 964 of 1211 mouse GNF (80%), and 700 of 1106 mouse custom array (63%) probes targeted ncRNAs with ⱖ20 PhastCons bases (supplemental Table S1A—S1C). One illustrative example was the Tug1 ncRNA, whose DQ517434 isoform was comprised of 32% PhastCons bases (Fig. 4A). Although Tug1 was originally identified as having an essential role in retinal differentiation, our observation of Tug1 expression in both mouse and human CD8⫹ T cells is consistent with previous reports of splenic Tug1 expression and induction by taurine (88), the predominant free amino acid in lymphocytes that attenuates activation-induced T cell death (74, 89). Functional ncRNAs often contain conserved secondary structures that may be processed into small RNAs (see above) or serve specific functions, such as binding protein partners. Stereotyped selection signatures can facilitate the identification of these functional RNA secondary structures. We used the RNAz prediction algorithm to identify conserved RNA secondary structures in the mouse and human genome (42) (see Materials and Methods). We found that a significant number of long ncRNAs contained predicted secondary structures. Thirty-nine of 268 human (15%), 417 of 1211 mouse GNF (34%), and 278 of 1106 mouse custom array (25%) probes targeted ncRNAs with ⱖ20 RNAz conserved bases (supplemental Table S1A–S1C). In addition to identifying a number of previously annotated secondary structures such as miRNA stem loops (e.g., miR-296) and snoRNAs (e.g., snoRNA-HACA39/HACA60), our analysis also unearthed a number of high-confidence novel structures (supplemental Table S8). For example, the ncRNA (AK154685) is a noncoding isoform of Ccl4, a chemokine important in T cell adhesion and migration (90). Up-regulated in both memory and activated T cells, this ncRNA overlaps the entire Ccl4 premRNA and then extends ⬃750 bp downstream (Fig. 4B) to encompass two inverted L1 repeats that are strongly predicted
LONG NONCODING RNAs IN CD8⫹ T LYMPHOCYTES to fold into a long, stabilized, double-stranded RNA hairpin (Fig. 4B, inset).
Discussion Although long ncRNAs comprise a large portion of the mammalian transcriptome (21, 91), our understanding of these transcripts is limited. Thus, despite a steady accumulation of reports ascribing biological roles to individual ncRNAs, the vast majority of long ncRNAs remain biological orphans without clear function or context. Using CD8⫹ T cells as our model, we have taken advantage of the high throughput nature of microarrays to identify and characterize long ncRNAs expressed in adaptive immunity. After CD8⫹ T cells encounter Ag, the resultant functional and phenotypic differences are underpinned by widespread changes in gene expression. Although recent transcriptional profiling has provided an unprecedented level of detail regarding the nature of these changes (76, 92, 93), the regulatory mechanisms that ultimately drive differences in gene expression remain incompletely understood. What is understood is that, as CD8⫹ T cells differentiate, epigenetic alterations in DNA methylation, chromatin structure, and locus accessibility combine to influence gene expression (reviewed in Refs. 94 and 95). Given the previously documented roles of long ncRNAs in gene regulation and epigenetics (reviewed in Ref. 8), our discovery in this study that hundreds of long ncRNAs are expressed in CD8⫹ T cells should not be surprising. Although expression per se is not necessarily indicative of function, several lines of evidence presented in this study support the likelihood that many of the long ncRNAs expressed in CD8⫹ T cells are functional. First, many ncRNAs are dynamically regulated during either differentiation or activation. Second, a number of ncRNAs identified in our study have previously been shown to have function in other biological contexts (e.g., Tug1), and it is not unreasonable to imagine that these transcripts also function in CD8⫹ T cells. Third, many long ncRNAs appear evolutionarily constrained by positive selection, whether at the level of primary sequence, secondary structure, and/or their genomic relationships with protein-coding genes. Determining the exact functions of the many long ncRNAs identified in this article is beyond the scope of the present study. Nevertheless, based upon previous reports, our results are consistent with the likelihood that many long ncRNAs will function in a variety of ways, including as cis-antisense transcripts, small RNA precursors, promoter-associated transcripts, and molecular decoys. With regard to the latter, it is notable that mRNAs contain important regulatory sequences in their introns and UTRs capable of binding to various factors (e.g., splicing factors and miRNAs). We observed that the major class of long ncRNAs expressed in CD8⫹ T cells overlapped and therefore shared such sequences, raising the possibility that they function as regulatory decoys. This possibility has been proposed previously for the long ncRNA Makorin1-p1 (96), but our results imply that ncRNA decoys might be more widespread than currently realized. Similarly, although it is known that small numbers of long ncRNAs are processed into miRNAs and snoRNAs, our finding that ⬎20% of expressed long ncRNAs overlap endogenous siRNAs (and other miscellaneous small RNAs) suggests that the processing of long ncRNAs into small RNAs is common. Together, our results lend further weight to the conclusion that long ncRNAs are an important regulated component of the mammalian transcriptome (9, 10) and not simply transcriptional “noise.” The majority of ncRNAs we identified have not previously been characterized beyond their original cloning and sequencing, and this study places them for the first time in a defined biological context i.e., CD8⫹ T cell immunity. Nevertheless, it is
The Journal of Immunology important to note that the findings described in this article are merely a starting point for the study of long ncRNAs in CD8⫹ T cells, and much exciting work lies ahead to functionally characterize the identified ncRNAs.
Disclosures The authors have no financial conflict of interest.
References 1. Okamura, K., and E. C. Lai. 2008. Endogenous small interfering RNAs in animals. Nat. Rev. Mol. Cell Biol. 9: 673– 678. 2. Farazi, T. A., S. A. Juranek, and T. Tuschl. 2008. The growing catalog of small RNAs and their association with distinct Argonaute/Piwi family members. Development 135: 1201–1214. 3. Mercer, T. R., M. E. Dinger, and J. S. Mattick. 2009. Long non-coding RNAs: insights into functions. Nat. Rev. Genet. 10: 155–159. 4. Brockdorff, N., A. Ashworth, G. F. Kay, V. M. McCabe, D. P. Norris, P. J. Cooper, S. Swift, and S. Rastan. 1992. The product of the mouse Xist gene is a 15 kb inactive X-specific transcript containing no conserved ORF and located in the nucleus. Cell 71: 515–526. 5. Rinn, J. L., M. Kertesz, J. K. Wang, S. L. Squazzo, X. Xu, S. A. Brugmann, L. H. Goodnough, J. A. Helms, P. J. Farnham, E. Segal, and H. Y. Chang. 2007. Functional demarcation of active and silent chromatin domains in human HOX loci by noncoding RNAs. Cell 129: 1311–1323. 6. Sleutels, F., R. Zwart, and D. P. Barlow. 2002. The non-coding Air RNA is required for silencing autosomal imprinted genes. Nature 415: 810 – 813. 7. Amaral, P. P., and J. S. Mattick. 2008. Noncoding RNA in development. Mamm. Genome 19: 454 – 492. 8. Mattick, J., P. Amaral, M. Dinger, T. Mercer, and M. Mehler. 2009. RNA regulation of epigenetic processes. BioEssays 31: 51–59. 9. Mercer, T. R., M. E. Dinger, S. M. Sunkin, M. F. Mehler, and J. S. Mattick. 2008. Specific expression of long noncoding RNAs in the mouse brain. Proc. Natl. Acad. Sci. USA 105: 716 –721. 10. Dinger, M. E., P. P. Amaral, T. R. Mercer, K. C. Pang, S. J. Bruce, B. B. Gardiner, M. E. Askarian-Amiri, K. Ru, G. Solda, C. Simons, et al. 2008. Long noncoding RNAs in mouse embryonic stem cell pluripotency and differentiation. Genome Res. 18: 1433–1445. 11. Guttman, M., I. Amit, M. Garber, C. French, M. F. Lin, D. Feldser, M. Huarte, O. Zuk, B. W. Carey, J. P. Cassady, et al. 2009. Chromatin signature reveals over a thousand highly conserved large non-coding RNAs in mammals. Nature 458: 223–227. 12. Vigneau, S., P. S. Rohrlich, M. Brahic, and J. F. Bureau. 2003. Tmevpg1, a candidate gene for the control of Theiler’s virus persistence, could be implicated in the regulation of gamma interferon. J. Virol. 77: 5632–5638. 13. Abarrategui, I., and M. S. Krangel. 2007. Noncoding transcription controls downstream promoters to regulate T-cell receptor ␣ recombination. EMBO J. 26: 4380 – 4390. 14. Liu, A. Y., B. S. Torchia, B. R. Migeon, and R. F. Siliciano. 1997. The human NTT gene: identification of a novel 17-kb noncoding nuclear RNA expressed in activated CD4⫹ T cells. Genomics 39: 171–184. 15. Haasch, D., Y. W. Chen, R. M. Reilly, X. G. Chiou, S. Koterski, M. L. Smith, P. Kroeger, K. McWeeny, D. N. Halbert, K. W. Mollison, et al. 2002. T cell activation induces a noncoding RNA transcript sensitive to inhibition by immunosuppressant drugs and encoded by the proto-oncogene, BIC. Cell. Immunol. 217: 78 – 86. 16. Jones, E. A., and R. A. Flavell. 2005. Distal enhancer elements transcribe intergenic RNA in the IL-10 family gene cluster. J. Immunol. 175: 7437–7446. 17. Mourtada-Maarabouni, M., V. L. Hedge, L. Kirkham, F. Farzaneh, and G. T. Williams. 2008. Growth arrest in human T-cells is controlled by the noncoding RNA growth-arrest-specific transcript 5 (GAS5). J. Cell Sci. 121: 939 –946. 18. Restifo, N. P., I. Bacik, K. R. Irvine, J. W. Yewdell, B. J. McCabe, R. W. Anderson, L. C. Eisenlohr, S. A. Rosenberg, and J. R. Bennink. 1995. Antigen processing in vivo and the elicitation of primary CTL responses. J. Immunol. 154: 4414 – 4422. 19. Griffiths-Jones, S., R. J. Grocock, S. van Dongen, A. Bateman, and A. J. Enright. 2006. miRBase: microRNA sequences, targets and gene nomenclature. Nucleic Acids Res. 34: D140 –D144. 20. Pang, K. C., S. Stephen, P. G. Engstrom, K. Tajul-Arifin, W. Chen, C. Wahlestedt, B. Lenhard, Y. Hayashizaki, and J. S. Mattick. 2005. RNAdb - a comprehensive mammalian noncoding RNA database. Nucleic Acids Res. 33: D125–D130. 21. Carninci, P., T. Kasukawa, S. Katayama, J. Gough, M. C. Frith, N. Maeda, R. Oyama, T. Ravasi, B. Lenhard, C. Wells, et al. 2005. The transcriptional landscape of the mammalian genome. Science 309: 1559 –1563. 22. Smyth, G. K., and T. Speed. 2003. Normalization of cDNA microarray data. Methods 31: 265–273. 23. Smyth, G. K. 2004. Linear models and empirical Bayes methods for assessing differential expression in microarray experiments. Stat. Appl. Genet. Mol. Biol. 3: Article 3. 24. Dinger, M. E., K. C. Pang, T. R. Mercer, M. L. Crowe, S. M. Grimmond, and J. S. Mattick. 2009. NRED: a database of long noncoding RNA expression. Nucleic Acids Res. 37: D122–D126. 25. Kent, W. J. 2002. BLAT—the BLAST-like alignment tool. Genome Res. 12: 656 – 664.
7747 26. Pruitt, K. D., T. Tatusova, and D. R. Maglott. 2005. NCBI Reference Sequence (RefSeq): a curated non-redundant sequence database of genomes, transcripts and proteins. Nucleic Acids Res. 33: D501–D504. 27. Gerhard, D. S., L. Wagner, E. A. Feingold, C. M. Shenmen, L. H. Grouse, G. Schuler, S. L. Klein, S. Old, R. Rasooly, P. Good, et al. 2004. The status, quality, and expansion of the NIH full-length cDNA project: the Mammalian Gene Collection (MGC). Genome Res. 14: 2121–2127. 28. Hsu, F., W. J. Kent, H. Clawson, R. M. Kuhn, M. Diekhans, and D. Haussler. 2006. The UCSC known genes. Bioinformatics 22: 1036 –1046. 29. Badger, J. H., and G. J. Olsen. 1999. CRITICA: coding region identification tool invoking comparative analysis. Mol. Biol. Evol. 16: 512–524. 30. Cheng, J., P. Kapranov, J. Drenkow, S. Dike, S. Brubaker, S. Patel, J. Long, D. Stern, H. Tammana, G. Helt, et al. 2005. Transcriptional maps of 10 human chromosomes at 5-nucleotide resolution. Science 308: 1149 –1154. 31. Kapranov, P., J. Drenkow, J. Cheng, J. Long, G. Helt, S. Dike, and T. R. Gingeras. 2005. Examples of the complex architecture of the human transcriptome revealed by RACE and high-density tiling arrays. Genome Res. 15: 987–997. 32. Su, A. I., T. Wiltshire, S. Batalov, H. Lapp, K. A. Ching, D. Block, J. Zhang, R. Soden, M. Hayakawa, G. Kreiman, et al. 2004. A gene atlas of the mouse and human protein-encoding transcriptomes. Proc. Natl. Acad. Sci. USA 101: 6062– 6067. 33. Eisen, M. B., P. T. Spellman, P. O. Brown, and D. Botstein. 1998. Cluster analysis and display of genome-wide expression patterns. Proc. Natl. Acad. Sci. USA 95: 14863–14868. 34. Saldanha, A. J. 2004. Java Treeview - extensible visualization of microarray data. Bioinformatics 20: 3246 –3248. 35. Beissbarth, T., and T. P. Speed. 2004. Gostat: find statistically overrepresented gene ontologies within a group of genes. Bioinformatics 20: 1464 –1465. 36. Engstrom, P. G., H. Suzuki, N. Ninomiya, A. Akalin, L. Sessa, G. Lavorgna, A. Brozzi, L. Luzi, S. L. Tan, L. Yang, et al. 2006. Complex loci in human and mouse genomes. PLoS Genet. 2: e47. 37. Mikkelsen, T. S., M. Ku, D. B. Jaffe, B. Issac, E. Lieberman, G. Giannoukos, P. Alvarez, W. Brockman, T. K. Kim, R. P. Koche, et al. 2007. Genome-wide maps of chromatin state in pluripotent and lineage-committed cells. Nature 448: 553–560. 38. Gardiner-Garden, M., and M. Frommer. 1987. CpG islands in vertebrate genomes. J. Mol. Biol. 196: 261–282. 39. Meissner, A., T. S. Mikkelsen, H. Gu, M. Wernig, J. Hanna, A. Sivachenko, X. Zhang, B. E. Bernstein, C. Nusbaum, D. B. Jaffe, et al. 2008. Genome-scale DNA methylation maps of pluripotent and differentiated cells. Nature 454: 766 –770. 40. Siepel, A., G. Bejerano, J. S. Pedersen, A. S. Hinrichs, M. Hou, K. Rosenbloom, H. Clawson, J. Spieth, L. W. Hillier, S. Richards, et al. 2005. Evolutionarily conserved elements in vertebrate, insect, worm, and yeast genomes. Genome Res. 15: 1034 –1050. 41. Washietl, S., I. L. Hofacker, and P. F. Stadler. 2005. Fast and reliable prediction of noncoding RNAs. Proc. Natl. Acad. Sci. USA 102: 2454 –2459. 42. Washietl, S., I. L. Hofacker, M. Lukasser, A. Huttenhofer, and P. F. Stadler. 2005. Mapping of conserved RNA secondary structures predicts thousands of functional noncoding RNAs in the human genome. Nat. Biotechnol. 23: 1383–1390. 43. Zuker, M. 2003. Mfold web server for nucleic acid folding and hybridization prediction. Nucleic Acids Res. 31: 3406 –3415. 44. Mobley, J. L., S. M. Rigby, and M. O. Dailey. 1994. Regulation of adhesion molecule expression by CD8 T cells in vivo. II. Expression of L-selectin (CD62L) by memory cytolytic T cells responding to minor histocompatibility antigens. J. Immunol. 153: 5443–5452. 45. Faghihi, M. A., F. Modarresi, A. M. Khalil, D. E. Wood, B. G. Sahagan, T. E. Morgan, C. E. Finch, G. St. Laurent III, P. J. Kenny, and C. Wahlestedt. 2008. Expression of a noncoding RNA is elevated in Alzheimer’s disease and drives rapid feed-forward regulation of -secretase. Nat. Med. 14: 723–730. 46. Yu, W., D. Gius, P. Onyango, K. Muldoon-Jacobs, J. Karp, A. P. Feinberg, and H. Cui. 2008. Epigenetic silencing of tumour suppressor gene p15 by its antisense RNA. Nature 451: 202–206. 47. Beltran, M., I. Puig, C. Pena, J. M. Garcia, A. B. Alvarez, R. Pena, F. Bonilla, and A. G. de Herreros. 2008. A natural antisense transcript regulates Zeb2/Sip1 gene expression during Snail1-induced epithelial-mesenchymal transition. Genes Dev. 22: 756 –769. 48. Katayama, S., Y. Tomaru, T. Kasukawa, K. Waki, M. Nakanishi, M. Nakamura, H. Nishida, C. C. Yap, M. Suzuki, J. Kawai, et al. 2005. Antisense transcription in the mammalian transcriptome. Science 309: 1564 –1566. 49. Yelin, R., D. Dahary, R. Sorek, E. Y. Levanon, O. Goldstein, A. Shoshan, A. Diber, S. Biton, Y. Tamir, R. Khosravi, et al. 2003. Widespread occurrence of antisense transcription in the human genome. Nat. Biotechnol. 21: 379 –386. 50. Schwartz, J. C., S. T. Younger, N. B. Nguyen, D. B. Hardy, B. P. Monia, D. R. Corey, and B. A. Janowski. 2008. Antisense transcripts are targets for activating small RNAs. Nat. Struct. Mol. Biol. 15: 842– 848. 51. Watanabe, T., Y. Totoki, A. Toyoda, M. Kaneda, S. Kuramochi-Miyagawa, Y. Obata, H. Chiba, Y. Kohara, T. Kono, T. Nakano, et al. 2008. Endogenous siRNAs from naturally formed dsRNAs regulate transcripts in mouse oocytes. Nature 453: 539 –543. 52. Ebralidze, A. K., F. C. Guibal, U. Steidl, P. Zhang, S. Lee, B. Bartholdy, M. A. Jorda, V. Petkova, F. Rosenbauer, G. Huang, et al. 2008. PU. 1 expression is modulated by the balance of functional sense and antisense RNAs regulated by a shared cis-regulatory element. Genes Dev. 22: 2085–2092.
7748 53. Hastings, M. L., H. A. Ingle, M. A. Lazar, and S. H. Munroe. 2000. Posttranscriptional regulation of thyroid hormone receptor expression by cis-acting sequences and a naturally occurring antisense RNA. J. Biol. Chem. 275: 11507–11513. 54. Ogawa, Y., B. K. Sun, and J. T. Lee. 2008. Intersection of the RNA interference and X-inactivation pathways. Science 320: 1336 –1341. 55. Nagano, T., J. A. Mitchell, L. A. Sanz, F. M. Pauler, A. C. Ferguson-Smith, R. Feil, and P. Fraser. 2008. The Air noncoding RNA epigenetically silences transcription by targeting G9a to chromatin. Science 322: 1717–1720. 56. Pandey, R. R., T. Mondal, F. Mohammad, S. Enroth, L. Redrup, J. Komorowski, T. Nagano, D. Mancini-Dinardo, and C. Kanduri. 2008. Kcnq1ot1 antisense noncoding RNA mediates lineage-specific transcriptional silencing through chromatin-level regulation. Mol. Cell 32: 232–246. 57. Hovanes, K., T. W. Li, and M. L. Waterman. 2000. The human LEF-1 gene contains a promoter preferentially active in lymphocytes and encodes multiple isoforms derived from alternative splicing. Nucleic Acids Res. 28: 1994 –2003. 58. Willinger, T., T. Freeman, M. Herbert, H. Hasegawa, A. J. McMichael, and M. F. Callan. 2006. Human naive CD8 T cells down-regulate expression of the WNT pathway transcription factors lymphoid enhancer binding factor 1 and transcription factor 7 (T cell factor-1) following antigen encounter in vitro and in vivo. J. Immunol. 176: 1439 –1446. 59. Tanuma, N., K. Nakamura, and K. Kikuchi. 1999. Distinct promoters control transmembrane and cytosolic protein tyrosine phosphatase ⑀ expression during macrophage differentiation. Eur. J. Biochem. 259: 46 –54. 60. Froussard, P., P. Chastagner, G. Somme, A. Abadie, W. Greene, J. Theze, and S. Longacre. 1988. p55 IL-2 receptor mRNA precursors in murine T lymphocyte nuclei. J. Immunol. 141: 1358 –1364. 61. Ortega, G., R. J. Robb, E. M. Shevach, and T. R. Malek. 1984. The murine IL 2 receptor. I. Monoclonal antibodies that define distinct functional epitopes on activated T cells and react with activated B cells. J. Immunol. 133: 1970 –1975. 62. Sharon, M., R. D. Klausner, B. R. Cullen, R. Chizzonite, and W. J. Leonard. 1986. Novel interleukin-2 receptor subunit detected by cross-linking under highaffinity conditions. Science 234: 859 – 863. 63. Trinklein, N. D., S. F. Aldred, S. J. Hartman, D. I. Schroeder, R. P. Otillar, and R. M. Myers. 2004. An abundance of bidirectional promoters in the human genome. Genome Res. 14: 62– 66. 64. Tycowski, K. T., M. D. Shu, and J. A. Steitz. 1996. A mammalian gene with introns instead of exons generating stable RNA products. Nature 379: 464 – 466. 65. Kimura, S., N. Tada, and U. Ha¨mmerling. 1980. A new lymphocyte alloantigen (Ly-10) controlled by a gene linked to the Lyt-1 locus Immunogenetics 10: 363–372. 66. Chan, M. M., U. Ha¨mmerling, and O. Stutman. 1998. The Ly-10 antigen is a marker of mouse-activated T lymphocytes. Immunogenetics 28: 425– 432. 67. Martens, J. A., L. Laprade, and F. Winston. 2004. Intergenic transcription is required to repress the Saccharomyces cerevisiae SER3 gene. Nature 429: 571–574. 68. Hirota, K., T. Miyoshi, K. Kugou, C. S. Hoffman, T. Shibata, and K. Ohta. 2008. Stepwise chromatin remodelling by a cascade of transcription initiation of noncoding RNAs. Nature 456: 130 –134. 69. Zhang, N., K. Hopkins, and Y. W. He. 2008. c-FLIP protects mature T lymphocytes from TCR-mediated killing. J. Immunol. 181: 5368 –5373. 70. Zhang, N., and Y. W. He. 2005. An essential role for c-FLIP in the efficient development of mature T lymphocytes. J. Exp. Med. 202: 395– 404. 71. Rodriguez, A., S. Griffiths-Jones, J. L. Ashurst, and A. Bradley. 2004. Identification of mammalian microRNA host genes and transcription units. Genome Res. 14: 1902–1910. 72. Frey, M. R., W. Wu, J. M. Dunn, and A. G. Matera. 1997. The U22 host gene (UHG): chromosomal localization of UHG and distribution of U22 small nucleolar RNA. Histochem. Cell Biol. 108: 365–370. 73. Smith, C. M., and J. A. Steitz. 1998. Classification of gas5 as a multi-smallnucleolar-RNA (snoRNA) host gene and a member of the 5⬘-terminal oligopyrimidine gene family reveals common features of snoRNA host genes. Mol. Cell. Biol. 18: 6897– 6909. 74. Fukuda, K., Y. Hirai, H. Yoshida, T. Nakajima, and T. Usui. 1982. Free amino acid content of lymphocytes and granulocytes compared. Clin. Chem. 28: 1758 –1761. 75. Bartel, D. P., and C. Z. Chen. 2004. Micromanagers of gene expression: the potentially widespread influence of metazoan microRNAs. Nat. Rev. Genet. 5: 396 – 400.
LONG NONCODING RNAs IN CD8⫹ T LYMPHOCYTES 76. Wu, H., J. R. Neilson, P. Kumar, M. Manocha, P. Shankar, P. A. Sharp, and N. Manjunath. 2007. miRNA profiling of naive, effector and memory CD8 T cells. PLoS ONE 2: e1020. 77. Friedman, R. C., K. K.-H. Farh, C. B. Burge, and D. Bartel. 2009. Most mammalian mRNAs are conserved targets of microRNAs. Genome Res. 19: 92–105. 78. Ota, A., H. Tagawa, S. Karnan, S. Tsuzuki, A. Karpas, S. Kira, Y. Yoshida, and M. Seto. 2004. Identification and characterization of a novel gene, C13orf25, as a target for 13q31– q32 amplification in malignant lymphoma. 79. He, L., J. M. Thomson, M. T. Hemann, E. Hernando-Monge, D. Mu, S. Goodson, S. Powers, C. Cordon-Cardo, S. W. Lowe, G. J. Hannon, and S. M. Hammond. 2005. A microRNA polycistron as a potential human oncogene. Nature 435: 828 – 833. 80. Xiao, C., L. Srinivasan, D. P. Calado, H. C. Patterson, B. Zhang, J. Wang, J. M. Henderson, J. L. Kutok, and K. Rajewsky. 2008. Lymphoproliferative disease and autoimmunity in mice with increased miR-17–92 expression in lymphocytes. Nat. Immunol. 9: 405– 414. 81. Chen, C. Z., L. Li, H. F. Lodish, and D. P. Bartel. 2004. MicroRNAs modulate hematopoietic lineage differentiation. Science 303: 83– 86. 82. Babiarz, J. E., J. G. Ruby, Y. Wang, D. P. Bartel, and R. Blelloch. 2008. Mouse ES cells express endogenous shRNAs, siRNAs, and other microprocessor-independent, Dicer-dependent small RNAs. Genes Dev. 22: 2773–2785. 83. Tam, O. H., A. A. Aravin, P. Stein, A. Girard, E. P. Murchison, S. Cheloufi, E. Hodges, M. Anger, R. Sachidanandam, R. M. Schultz, and G. J. Hannon. 2008. Pseudogene-derived small interfering RNAs regulate gene expression in mouse oocytes. Nature 453: 534 –538. 84. Ishiguro, H., Y. Furukawa, Y. Daigo, Y. Miyoshi, Y. Nagasawa, T. Nishiwaki, T. Kawasoe, M. Fujita, S. Satoh, N. Miwa, et al. 2000. Isolation and characterization of human NBL4, a gene involved in the -catenin/Tcf signaling pathway. Jpn. J. Cancer Res. 91: 597– 603. 85. Hutchinson, J. N., A. W. Ensminger, C. M. Clemson, C. R. Lynch, J. B. Lawrence, and A. Chess. 2007. A screen for nuclear transcripts identifies two linked noncoding RNAs associated with SC35 splicing domains. BMC Genomics 8: 39. 86. Wilusz, J. E., S. M. Freier, and D. L. Spector. 2008. 3⬘ end processing of a long nuclear-retained noncoding RNA yields a tRNA-like cytoplasmic RNA. Cell 135: 919 –932. 87. Saxonov, S., P. Berg, and D. L. Brutlag. 2006. A genome-wide analysis of CpG dinucleotides in the human genome distinguishes two distinct classes of promoters. Proc. Natl. Acad. Sci. USA 103: 1412–1417. 88. Young, T. L., T. Matsuda, and C. L. Cepko. 2005. The noncoding RNA taurine upregulated gene 1 is required for differentiation of the murine retina. Curr. Biol. 15: 501–512. 89. Maher, S. G., C. E. Condron, D. J. Bouchier-Hayes, and D. M. Toomey. 2005. Taurine attenuates CD3/interleukin-2-induced T cell apoptosis in an in vitro model of activation-induced cell death (AICD). Clin. Exp. Immunol. 139: 279 –286. 90. Vroon, A., C. J. Heijnen, M. S. Lombardi, P. M. Cobelens, F. Mayor, Jr., M. G. Caron, and A. Kavelaars. 2004. Reduced GRK2 level in T cells potentiates chemotaxis and signaling in response to CCL4. J. Leukocyte Biol. 75: 901–909. 91. Ota, T., Y. Suzuki, T. Nishikawa, T. Otsuki, T. Sugiyama, R. Irie, A. Wakamatsu, K. Hayashi, H. Sato, K. Nagai, et al. 2004. Complete sequencing and characterization of 21,243 full-length human cDNAs. Nat. Genet. 36: 40 – 45. 92. Kaech, S. M., S. Hemby, E. Kersh, and R. Ahmed. 2002. Molecular and functional profiling of memory CD8 T cell differentiation Cell 111: 837– 851. 93. Neilson, J. R., G. X. Y. Zheng, C. B. Burge, and P. A. Sharp. 2007. Dynamic regulation of miRNA expression in ordered stages of cellular development. Genes Dev. 21: 578 –589. 94. Pearce, E. L., and H. Shen. 2006. Making sense of inflammation, epigenetics, and memory CD8⫹ T-cell differentiation in the context of infection. Immunol. Rev. 211: 197–202. 95. Wilson, C. B., K. W. Makar, M. Shnyreva, and D. R. Fitzpatrick. 2005. DNA methylation and the expanding epigenetics of T cell lineage commitment. Semin. Immunol. 17: 105–119. 96. Hirotsune, S., N. Yoshida, A. Chen, L. Garrett, F. Sugiyama, S. Takahashi, K. Yagami, A. Wynshaw-Boris, and A. Yoshiki. 2003. An expressed pseudogene regulates the messenger-RNA stability of its homologous coding gene. Nature 423: 91–96. 97. Do, C. B., D. A. Woods, and S. Batzoglou. 2006. CONTRAfold: RNA secondary structure prediction without physics-based models. Bioinformatics 22: e90 – e98.