Color profile: Generic CMYK printer profile Composite Default screen
706
Genomic targeting and high-resolution mapping of the domestication gene Q in wheat Justin D. Faris and Bikram S. Gill
Abstract: The Q locus is largely responsible for the domestication of bread wheat. Q confers the free-threshing character of the spike and influences other important agronomic traits. Using chromosome deletion lines, Q was placed on the physical map within a submicroscopic segment of the long arm of chromosome 5A. We targeted markers to the segment by comparative mapping of anonymous RFLP clones, AFLP, and mRNA differential display analysis of deletion lines 5AL-7 and -23, which have deletion breakpoints that flank the Q locus. Differentially expressed sequences detected fragments at various loci on group 5 chromosomes suggesting that Q may be a regulatory gene. We identified 18 markers within the Q gene deletion interval and used them to construct a genetic linkage map of the region in F2 populations derived from chromosome 5A disomic substitution lines. The genetic map corresponding to the deletion segment was 20-cM long, and we identified markers as close as 0.7 cM to the Q gene. An estimate of base pairs per centimorgan within the region is 250 kb/cM, an 18-fold increase in recombination compared with the genomic average. Genomic targeting and high-density mapping provide a basis for the map-based cloning of the Q gene. Key words: Triticum aestivum, positional cloning, physical mapping. Résumé : Le locus Q est largement responsable de la domestication du blé panifiable. Ce locus détermine si les grains tomberont de l’épi (allèle Q) ou seront maintenus sur celui-ci (allèle q) à maturité en plus d’influencer d’autres caractères agronomiques importants. À l’aide de lignées délétantes, l’emplacement physique du locus Q a pu être déterminé au sein d’un segment sub-microscopique du bras long du chromosome 5A. Les auteurs ont ciblé cette région pour le développement de marqueurs moléculaires par cartographie comparée de marqueurs RFLP et AFLP anonymes et par affichage différentiel des ARNm chez les lignées délétantes 5AL-7 et 5AL-23, deux lignées dont les extrémités des délétions bordent le locus Q. Les séquences à expression différentielle détectaient des fragments situés à différents endroits sur les chromosomes du groupe 5 ; une observation qui suggère que le gène Q pourrait contrôler l’expression de plusieurs gènes. Les auteurs ont identifié 18 marqueurs au sein de l’intervalle qui contient le gène Q et ont employé ceux-ci afin de produire une carte génétique de cette région à l’aide d’une population F2 dérivée de lignées de substitution disomiques pour le chromosome 5A. La carte génétique du segment mesurait 20 cM et des marqueurs situés à aussi peu que 0,7 cM du gène Q ont été identifiés. Il a été estimé que dans cette région 1 cM correspond à 250 kb, une valeur suggérant 18 fois plus de recombinaison dans cet intervalle par rapport à la moyenne pour l’ensemble du génome. Un tel travail de ciblage génomique et de cartographie fine fournissent l’assise pour le clonage positionnel du gène Q. Mots clés : Triticum aestivum, clonage positionnel, cartographie physique. [Traduit par la Rédaction]
Faris and Gill
718
Introduction Rice (Oryza sativa), wheat (Triticum aestivum), maize (Zea mays), and sorghum (Sorghum bicolor) are the major cereals of the grass family and were all domesticated from their wild relatives quite recently in human history. These Received 16 January 2001. Accepted 13 May 2002. Published on the Research Press Web site at http://genome.nrc.ca on 21 June 2002. Corresponding Editor: G.J. Scoles. J.D. Faris1. USDA–ARS Cereal Crops Research Unit, Northern Crop Science Laboratory, 1307 18th St. N., Fargo, ND 58105, U.S.A. B.S. Gill. Department of Plant Pathology, 4024 Throckmorton Plant Sciences Center, Kansas State University, Manhattan, KS 66506, U.S.A. 1
Corresponding author (e-mail:
[email protected]).
Genome 45: 706–718 (2002)
I:\gen\gen45\gen-04\G02-036.vp Tuesday, June 18, 2002 2:20:05 PM
wild grass ancestors possessed the shattering trait that was used as a mechanism of natural seed dispersal. Upon domestication, each of the major cereals underwent genetic modifications that led to shatter-resistance phenotypes allowing early farmers to more efficiently harvest the grain. Paterson et al. (1995) found correspondence of QTLs associated with shattering among rice, maize, and sorghum, suggesting that the convergent domestication of these cereals may have resulted from mutations at corresponding genetic loci. The shattering trait is likely governed by the location of an abscission zone. Abscission is a universal process in plants whereby organs are shed during normal development owing to the separation of cells in distinct regions of the plant. The tomato JOINTLESS locus has been thoroughly studied and found to be a MADS-box gene that activates the development of an abscission zone at the pedicel (Mao et al. 2000). As a result of domestication, common hexaploid bread wheat (T. aestivum subsp. vulgare L., 2n = 6x = 42,
DOI: 10.1139/G02-036
© 2002 NRC Canada
Color profile: Generic CMYK printer profile Composite Default screen
Faris and Gill
AABBDD genomes) is essentially free threshing because it has soft glumes, but it is nonshattering because it has the tough rachis trait. Other wild wheats and hexaploid subspecies, such as T. aestivum subsp. spelta, subsp. vavilovii, and subsp. macha, are not free threshing because of tough glumes and are susceptible to shattering because they have a fragile rachis (Leighty and Boshnakian 1921; Singh et al. 1957; Kabarity 1966). The patterns of rachis disarticulation differ among the wild wheats with fragile rachis and the domesticated wheats with tough rachis (Cao et al. 1997). Thus, rachis fragility or toughness is likely due to an alteration of the abscission zone location. The Q allele, which confers the square-headed phenotype and free-threshing character, is possessed by most of the cultivated wheats, but most wild wheats have the q allele and, therefore, speltoid spikes that are not free threshing (Muramatsu 1986). The expression of Q affects many different characters including glume keeledness, rachis toughness, spike length, spike type, and culm height. Muramatsu (1986) suggested that the range of variation of the characters is very narrow in the absence of Q, and when Q is present they express an obvious phenotype. However, each characteristic is subjected to modification by other genes depending on the genetic background. It is the Q gene that makes T. aestivum subsp. vulgare different from T. aestivum subsp. spelta and speltoid mutants that have a deficiency for the Q locus (Smith et al. 1949; MacKey 1954). Differences between the spelta subspecies and speltoid mutants are slight and are probably due to the presence of q in T. aestivum subsp. spelta, but modifier genes at other loci may be involved (MacKey 1954). Q is incompletely dominant to q, and plants with the genotype Qq have a spike morphology that is intermediate to speltoid and squareheaded. Plants that are monosomic, disomic, trisomic, and tetrasomic for chromosome 5A have phenotypes that are speltoid, normal (squarehead), subcompactoid, and compactoid, respectively (Huskins 1946; Sears 1952; 1954). These phenotypic changes were attributed to increased dosage of Q located on the long arm of chromosome 5A (Unrau et al. 1950; MacKey 1954). Muramatsu (1963) determined that the q allele is hypomorphic to Q. He showed that four or fewer doses of q resulted in a speltoid spike, but five doses of q gave a squareheaded spike that corresponded approximately to two doses of Q. The tetraploid Triticum turgidum subsp. durum and the hexaploid T. aestivum subsp. vulgare are domesticated wheats that are free threshing and have the QQ genotype. Both species evolved from the tetraploid Triticum dicoccoides, which is not free threshing and has a fragile rachis. Kuckuck (1959) suggested that subspecies vulgare originated through duplication of q to produce Q because a cross between two spelta subspecies lines resulted in some progeny with a vulgare phenotype. But it is not known if the same mutations occurred independently in durum and vulgare or if durum may have been involved in the origin of hexaploid wheat. Hexaploid wheat is composed of the A, B, and D genomes derived from diploid donor species that are related to genomes of other grass species of the Poaceae. Related species in this family include rye, barley, oats, and numerous wild diploids. It is well established that DNA probes cloned
707
from these related species commonly identify sets of orthologous loci that lie at approximately the same positions relative to each other and to the centromeres. Consensus maps of several chromosomes uniting loci from homoeologous wheat genomes and the corresponding chromosomes of barley (Hordeum vulgare), Aegilops tauschii, Triticum monococcum, and rice have been presented by Van Deynze et al. (1995a) and Nelson et al. (1995a, 1995b, and 1995c). These experiments have shown that the genomes of barley, Ae. tauschii, and T. monococcum are essentially colinear with the wheat genome. The genomes of more distantly related cereals such as oat, rice, and maize can be divided into linkage blocks that have homology to corresponding segments of the wheat genome (Ahn et al. 1993; Van Deynze et al. 1995b). Therefore, comparative mapping among related grass species can be used to identify candidate markers for a targeted wheat genomic segment. In addition to comparative mapping, wheat cytogenetic stocks can be employed to target markers to subgenomic regions. Wheat is a unique genetic model in that its polyploid nature allows it to tolerate a certain degree of aneuploidy, whereas its disomic inheritance allows it to behave much like a diploid. Thus, many cytogenetic stocks such as nullisomic-tetrasomic lines and ditelosomic lines were developed as early as the 1950s and used to study gene dosage and locate genes to individual chromosomes and chromosome arms (Sears 1954, 1966; Sears and Sears 1978). Disomic chromosome substitution lines, where a pair of foreign chromosomes has been substituted for a native pair of chromosomes, allow one to essentially study the effects of the substituted chromosomes in isolation, and they can be used to develop mapping populations that are recombinant for only one pair of chromosomes. More recently, chromosome deletion lines have been developed using the gametocidal genes from alien species, which act as biological scissors to create terminal chromosome deletions (Endo 1988; 1990; Endo and Gill 1996; Nasuda et al. 1998). The deletion stocks allow genes to be located to subchromosomal regions. Several studies have reported on deletion mapping of the Q gene to the long arm of chromosome 5A (Miller and Reader 1982; Endo and Mukai 1988; Tsujimoto and Noda 1989, 1990; Ogihara et al. 1994; Endo and Gill 1996). Endo and Gill (1996) physically mapped Q within a cytological submicroscopic deletion flanked by overlapping breakpoints. When combined with modern molecular techniques such as AFLP (Vos et al. 1995) or RNA differential display (Liang and Pardee 1992), the subchromosomal regions can be targeted and saturated with molecular markers. Our objectives were to (i) use mRNA differential display and AFLP analysis to target markers to the submicroscopic deletion interval defined by the chromosome breakpoints in deletion lines 5AL-7 and -23 containing the Q gene, (ii) develop a high-resolution genetic linkage map of the region, and (iii) identify markers closely linked to the Q gene.
Materials and methods Plant materials Nullisomic-tetrasomic (NT) stocks of ‘Chinese Spring’ (CS) wheat (Sears 1954), in which a missing pair of chromosomes is compensated for by an extra pair of homo© 2002 NRC Canada
I:\gen\gen45\gen-04\G02-036.vp Tuesday, June 18, 2002 2:20:05 PM
Color profile: Generic CMYK printer profile Composite Default screen
708
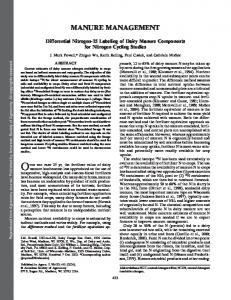
eologues, were used to identify fragments hybridizing to group 5 chromosomes. We used 36 lines of CS with terminal chromosomal deletions in the long arms of group 5 chromosomes (Endo and Gill 1996) for physical mapping. The number of deletion lines for each chromosome was 16, 12, and 8 for 5AL, 5BL, and 5DL, respectively. Of these deletion lines, 28 are either homozygous or hemizygous (monosomic) for the deletion chromosome, and eight (5AL16, 5AL-19, 5BL-3, 5BL-7, 5BL-15, 5DL-7, 5DL-8, and 5DL-10) are heterozygous for the deletion chromosome. The deletion lines 5AL-7 and -23 have breakpoints flanking the Q gene and were used in differential display and AFLP analysis. The deletion line 5AL-7 is lacking the Q locus and has a speltoid spike, whereas 5AL-23 possesses Q and has a squareheaded phenotype (Fig. 1). A segregating population of 190 F2 progeny derived from the cross of CS with CS having a pair of T. dicoccoides 5A chromosomes substituted for the native 5A chromosomes (CS-DIC 5A) was scored for spike morphology and used for initial genetic mapping of all markers within the Q gene region. Because Q is hemizygous ineffective, 20 F3 family members derived from each non-squareheaded F2 plant were scored to obtain the F2 genotype. An additional 73 homozygous QQ plants from the CS × CS-DIC 5A population, and 202 homozygous QQ F2 plants derived from the cross of CS with a pair of 5A chromosomes from ‘Cheyenne’ substituted for its native 5A chromosomes (CS-CNN 5A) with CS-DIC 5A were used for fine mapping of markers near the Q gene. Differential display analysis Total RNA was isolated from immature spikes of deletion lines 5AL-7 and -23 using the TRIzol® reagent (Life Technologies Inc., Grand Island, N.Y.) as described by the manufacturer. Differential display analysis was done using the Delta™ differential display kit (Clontech Laboratories, Inc., Palo Alto, Calif.) according to the manufacturer’s recommendations. Briefly, single-stranded cDNA was synthesized from 2 µg of total RNA. Differential display polymerase chain reaction (PCR) was performed in the presence of [35S]dATP using an arbitrary primer along with an oligo(dT) primer. Nine oligo(dT) and 10 arbitrary primers were used in all possible combinations for a total of 90. Three initial cycles were performed at 94°C for 2 min, a low annealing temperature of 40°C for 5 min to allow the arbitrary primer to bind imprecisely to various cDNA strands, and 68°C for 5 min. This was followed by 25 cycles consisting of 94°C for 1 min, a 60°C annealing temperature for 1 min, and 68°C for 2 min. Amplified products were run on a 5% polyacrylamide gel at 80 W for 3.5 h, dried on filter paper for 2 h at 80°C, and exposed to X-ray film for 3–7 d. Reactions yielding fragments present in 5AL-23 and absent in 5AL-7 were performed a second time for verification. AFLP analysis DNA was isolated from leaf tissue of deletion lines 5AL-7 and -23 as described in Faris et al. (2000). The AFLP™ Analysis System I and AFLP Starter Primer Kit (Life Technologies Inc.) were used according to the manufacturer’s instructions. Briefly, genomic DNA was digested with the restriction enzymes EcoRI and MseI simultaneously, followed by ligation of EcoRI and MseI adapters to serve as
Genome Vol. 45, 2002 Fig. 1. Wheat spikes of deletion lines 5AL-23 (left) and 5AL-7 (right). The spike of 5AL-23 is squareheaded with a tough rachis and is free threshing. The spike of 5AL-7 is speltoid with a brittle rachis and is not free threshing.
primer binding sites on the restriction fragments. A preamplification reaction was then performed using primers that each had one selective nucleotide. The preamplification products were diluted 1:50 and used to perform a selective amplification reaction consisting of an EcoRI and an MseI primer with three selective nucleotides. The EcoRI primer was labeled by phosphorylating the 5′ end with [33P]ATP and T4 kinase. The kit contained eight EcoRI primers and eight MseI primers for a total of 64 possible primer combinations, which were used to identify DNA fragments differing between deletion lines 5AL-7 and -23. An additional eight EcoRI primers and eight MseI primers were constructed allowing an additional 192 primer combinations that were used to conduct bulked segregant analysis on pooled individuals from the F2 population. Selective amplification products were run on a 5% polyacrylamide gel at 80 W for 3.5 h, dried on filter paper for 2 h, and exposed to X-ray film for 3–7 d. Reactions yielding positive fragments were performed a second time for verification. Characterization of positive fragments Positive bands identified in differential display and AFLP analysis were excised from the dried polyacrylamide gels, added to 40 µL TE buffer, and boiled for 10 min. The liquid was extracted and 7 µL was used to reamplify the fragment. Differential display fragments were reamplified using the original arbitrary and oligo(dT) primers, and AFLP frag© 2002 NRC Canada
I:\gen\gen45\gen-04\G02-036.vp Tuesday, June 18, 2002 2:20:08 PM
Color profile: Generic CMYK printer profile Composite Default screen
Faris and Gill
ments were reamplified using universal EcoRI and MseI primers that had no selective nucleotides. PCR conditions were 20 cycles of 94°C for 1 min, 60°C for 1 min, and 68°C for 2 min for differential display fragments, and 30 cycles of 94°C for 30 s, 55°C for 30 s, and 72°C for 1 min for AFLP fragments. Ten microliters of the reamplified product was run on a 2% agarose gel for quantification. Approximately 10 ng of the reamplified product was cloned and transformed using the AdvanTAge™ PCR Cloning Kit (Clontech Laboratories Inc.) according to the manufacturer’s instructions. Bacteria were grown on solid Luria– Bertani (LB) media containing carbenicillin and X-gal, and 10–20 white colonies of each transformant were selected and grown in 150 µL of liquid LB media containing 50 mg carbenicillin/mL for 8–12 h. One microliter of each culture was used as the template for PCR in a reaction volume of 50 µL. For differential display clones, the original primer combination was used, and for AFLP clones the universal EcoRI and MseI primers were used to amplify the cloned inserts. Thermocycler conditions were the same as that for reamplification of the excised AFLP fragments as described above. A 10-µL sample of the reaction product was run on a 2% agarose gel at 100 V for 30 min. The gel was then stained with ethidium bromide, visualized under UV light, and photographed. Clones containing inserts whose size did not correspond to the original excised fragment were discarded. Clones having an insert of the correct size were saved and 10 µL of the amplified product was digested with the restriction enzyme RsaI and run on a 2% agarose gel that was stained and photographed. Different clones from the same transformation event showing different restriction patterns indicated that multiple DNA fragments existed within the original excised band. All clones with unique restriction patterns were then used as RFLP markers and hybridized to Southern blots containing digested genomic DNA of CS, N5AT5D, N5BT5D, N5DT5B, 5AL-7, and 5AL-23. Fragments mapping to group 5 chromosomes were further analyzed by hybridizing to the array of group 5 long-arm deletion lines. RFLP analysis DNA isolation, Southern blotting, and hybridization procedures were performed as described in Faris et al. (2000). Because the deletion interval containing the Q gene on chromosome 5A is homoeologous to the deletion interval on 5BL investigated by Faris et al. (2000), the same anonymous RFLP clones that were hybridized to 5BL deletion lines in that experiment were hybridized to deletion lines of 5AL. The RFLP clones were derived from various species and included probes from oat cDNA (CDO), barley cDNA (ABC and BCD), barley genomic DNA (ABG and MWG), rice cDNA (RZ), wheat genomic DNA (PSR and FBB), and maize genomic DNA (Pr1 gene sequence). Anonymous, AFLP-derived, and differential display-derived RFLP clones that detected fragments within the Q gene deletion interval were hybridized to Southern blots consisting of the parents of the mapping populations digested with 12 restriction enzymes (EcoRI, EcoRV, DraI, HindIII, BamHI, ScaI, SacI, XbaI, SspI, BglII, KpnI, and ApaI) to survey for polymorphism. Clones were then hybridized to DNA of the F2 popu-
709
lation digested with the enzyme giving the clearest polymorphism. Linkage analysis The computer program Mapmaker (Lander et al. 1987) version 2.0 for Macintosh was used to calculate linkage distances using the Kosambi mapping function (Kosambi 1944) and an LOD of 3.00. Sequencing A sterile toothpick was used to pick a single bacterial colony and inoculate 2 mL of liquid LB containing 50 mg carbenicillin/mL. The culture was grown for 14–16 h at 37°C with gentle shaking. Plasmid DNA was isolated and purified from the culture using the Qiagen Plasmid Mini Kit (Qiagen Inc., Valencia, Calif.) according to the manufacturer’s instructions. Approximately 1 µg of purified plasmid was sent to the University of Chicago Cancer Research Center DNA Sequencing Facility (Chicago, Ill.) to be sequenced. Retrieved sequences were tested for similarity to other known sequences in public databases using BLASTx and (or) BLASTn searches.
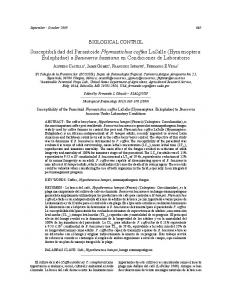
Results We employed various cytogenetic stocks of wheat in combination with molecular technologies such as mRNA differential display, AFLP, and comparative RFLP mapping in an effort to target a subgenomic region with molecular markers (Fig. 2). By comparing the genetic material of chromosome deletion lines 5AL-7 and -23 using these molecular techniques, we were able to efficiently identify markers within the physical chromosome segment containing the Q gene. Subsequent analysis of the markers on nullisomic-tetrasomic (NT) lines allowed rapid verification of the physical locations of the fragments. Finally, segregating populations derived from disomic chromosome substitution lines allowed efficient construction of DNA pools for bulked segregant analysis and for genetic fine mapping of the physical segment containing the Q gene. Differential display analysis RNA was isolated from spikes of deletion lines 5AL-7 and -23 (Fig. 1) and used to conduct differential display analysis to identify fragments within the overlapping deletion interval. An average of approximately 80 bands were visualized for each primer combination. We tested 90 primer combinations and therefore observed approximately 7200 bands. Of these bands, 16 were repeatedly expressed in 5AL-23, but not in 5AL-7. Cloning and characterizing these bands resulted in 92 unique clones. The differential expression of positive fragments was not verified by Northern analysis, because we were concerned only that they mapped within the targeted deletion interval. Therefore, fragments were tested by Southern analysis using chromosome group 5 deletion lines. The number of unique clones identified for each excised band ranged from 1 to 11, and 11 of the 16 differential display bands yielded at least one clone that hybridized to one or more of the group 5 chromosomes (Table 1). Two differential display bands each yielded three clones that hybrid© 2002 NRC Canada
I:\gen\gen45\gen-04\G02-036.vp Tuesday, June 18, 2002 2:20:08 PM
Color profile: Generic CMYK printer profile Composite Default screen
710
Genome Vol. 45, 2002
Fig. 2. Flow chart outlining the scheme for targeting subgenomic regions in wheat using various cytogenetic stocks. Two stocks with an overlapping chromosome deletion are compared using AFLP or RNA differential display analysis. Positive fragments are cloned and used as RFLP probes to detect fragments on a Southern blot containing appropriate nullisomic-tetrasomic lines and deletion lines to verify the existence of the fragment in the targeted interval. The resulting marker is then placed on the physical map of the corresponding chromosome. For genetic mapping population development, euploid ‘Chinese Spring’ is crossed with ‘Chinese Spring’ that has had a pair of Triticum dicoccoides 5A chromosomes substituted for the native ‘Chinese Spring’ 5A chromosomes (CS-DIC 5A). The resulting F1 is heterozygous along only chromosome 5A and, when selfed, the F2 contains a pair of recombinant 5A chromosomes in a homozygous ‘Chinese Spring’ background. The F2 population of recombinant substitution lines is then used for genetic mapping of probes derived from the AFLP or RNA differential display analysis. The resulting genetic map of the corresponding deletion interval is compared with the physical map to reveal marker order and estimate physical to genetic distance ratios.
© 2002 NRC Canada
I:\gen\gen45\gen-04\G02-036.vp Tuesday, June 18, 2002 2:20:08 PM
Color profile: Generic CMYK printer profile Composite Default screen
Faris and Gill
711
Table 1. Differentially expressed bands cloned from mRNA differential display analysis comparing RNA of deletion lines 5AL-7 and 5AL-23. No. of loci on: Differential display band (primers) A1T3 A1T6 A2T4 A3T4 A3T5 A4T5 A5T9 A6T3a
A6T3b
A6T3c A10T2
Clone
5A
5B
5D
Fragment size (bp)
Group 5 specific
KSUQ13 KSUQ16* KSUQ24 KSUQ32 KSUQ34* KSUQ35 KSUQ45* KSUQ59 KSUQ58 KSUQ62 KSUQ60 KSUQ61 KSUQ66 KSUQ63 KSUQ65 KSUQ67 KSUQ64 KSUQ10 KSUQ11
0 1 1 1 1 1 2 1 1 1 1 1 0 0 0 0 0 1 1
1 1 0 1 1 1 2 1 1 0 1 1 1 1 1 1 1 1 1
1 1 1 1 1 1 1 1 1 0 1 1 0 1 1 0 1 1 1
450 350 250 350 700 700 400 800 800 450 450 450 400 400 400 400 400 500 500
no yes no yes yes yes no yes yes no no no no yes no no no yes yes
Note: The clone names, number of group 5 loci, specificity to group 5, and fragment size are presented for those clones hybridizing to group 5 chromosomes. An asterisk next to the clone name indicates that the clone maps within the Q gene deletion interval.
ized to at least one group 5 chromosome. Four of the differential display bands each yielded two unique group 5 clones, and five bands resulted in one group 5 clone each. Five differential display bands yielded no clones that detected loci on group 5 chromosomes and were not further analyzed. Only three bands yielded clones that hybridized within the Q gene deletion interval on chromosome 5A (Figs. 3 and 4). The rest of the group 5 clones detected other loci on the long arms of one or more group 5 chromosomes (Fig. 3). The three differential-display clones that hybridized to the Q gene deletion interval were sequenced and tested for similarity to other sequences in the public databases. One of these, KSUQ34 (GenBank accession No. AF503187), had significant similarity to a synaptobrevin-like protein, but KSUQ16 (GenBank accession No. AF503188) and KSUQ45 (GenBank accession No. AF503189) had no significant similarity with any sequences in the databases. AFLP analysis of 5AL-7 and -23 A total of 64 primer combinations were tested on genomic DNA of 5AL-7 and -23. As with differential display, the AFLP analysis averaged about 80 bands/primer pair. Therefore, about 5000 fragments were visually observed. Ten bands were repeatedly present in 5AL-23 and absent in 5AL-7. Cloning and characterizing these bands revealed that three bands consisted of only highly repetitive sequences and could not be used as RFLP probes. However, the remaining seven bands yielded low-copy clones that detected loci within the Q gene deletion interval (Figs. 3 and 4). Clones KSUP18, KSUP20, and KSUP23 hybridized to group 5 chromosomes only (Table 2). KSUP18 and KSUP20
detected loci on all three homoeologues, whereas KSUP23 detected two loci on 5A, one on 5D, and none on 5B. KSUP10 and KSUP21 detected loci on other chromosomes in addition to chromosome 5A, but not 5B or 5D. KSUP50 and KSUP64 detected homoeologous loci on 5A, 5B, and 5D, as well as loci on other chromosomes. AFLP bulked segregant analysis Based on preliminary genetic mapping analysis of the differential-display derived clones, AFLP-derived clones from the analysis of 5AL-7 and -23, and anonymous RFLP clones in the CS × CS-DIC 5A population of 190 F2s, two DNA pools were constructed that differed in homozygosity at the Q locus and had crossovers immediately flanking the Q gene (see below). The two pools consisted of DNA from 10 individuals each and were used as templates for AFLP analysis of 192 additional primer combinations. AFLP primer combinations revealing polymorphisms between the bulks were then rescreened using the two bulks, both parents, and deletion line 5AL-7 for verification. Sixteen positive bands were confirmed, but only three resulted in lowcopy fragments, all of which mapped to the long arm of chromosome 5A. Clones KSUP16 and KSUP14 mapped within the Q gene region, but KSUP78 mapped distal to the 5AL-23 breakpoint and was not investigated further. KSUP16 detected loci on 5A and 5D, but not 5B. KSUP14 detected loci on 5A, 5B, and other chromosomes, but not on 5D. Anonymous RFLP clones Of the 135 anonymous RFLP clones tested (Faris et al. 2000), six detected fragments within the Q gene deletion in© 2002 NRC Canada
I:\gen\gen45\gen-04\G02-036.vp Tuesday, June 18, 2002 2:20:09 PM
Color profile: Generic CMYK printer profile Composite Default screen
712
Genome Vol. 45, 2002
Fig. 3. Physical maps of the long arms of homoeologous group 5 chromosomes showing the locations of markers derived from mRNA differential display (bold), AFLP analysis (plain), and anonymous RFLP clones (underlined). Loci of RFLP clones that mapped only within the 5AL-7–5AL-23 deletion interval are shown. Loci of all mRNA differential display and AFLP-derived clones mapping to group 5 chromosomes are shown. Fraction breakpoint values and corresponding deletion line names appear to the left of chromosomes. The marker names and their physical deletion interval positions are given on the right. The X symbol preceding marker names is omitted to conserve space. Dark and hatched bands on the physical maps indicate positions of darkly and lightly stained C bands, respectively.
terval on chromosome 5A (Figs. 3 and 4). Descriptions of the six clones are given in Table 3. ABC155, MWG740, and RZ744 were specific to group 5 chromosomes and detected a single locus on each of the chromosomes 5A, 5B, and 5D. CDO1475 was specific to chromosomes 5A and 5B. FBB255 was not specific to group 5, detected one locus on chromosome 5D, no loci on 5B, and in addition to a locus in the Q gene region detected a second, more-proximal locus on chromosome 5A. PR1 gave a complex banding pattern and was not specific to group 5 (Li et al. 1999). It detected loci on 5A and 5B, but not on 5D. Genetic mapping The three differential-display derived markers, six anonymous RFLP clones, and nine AFLP-derived markers that hybridized within the Q gene deletion interval on the physical map were mapped on the 190 F2 progeny as RFLP markers. The resulting genetic linkage map of the physical segment delineated by deletion lines 5AL-7 and -23 is ~20 cM (Fig. 4). The AFLP-derived markers XksuP23 and XksuP16 flank the Q gene at genetic distances of 1.3 and 0.7 cM, respectively. Only two markers, XksuP21 and Xfbb255, did not map at an LOD > 3.0 and were therefore placed in the most likely in-
tervals. The Q gene mapped toward the distal end of the linkage group and we therefore mapped several additional anonymous RFLP clones distal to Q. Of the 190 F2 plants used for initial mapping of all markers in the 5AL-7–5AL-23 interval, 130 had no crossovers within the deletion interval. Fifty-six plants had one crossover, three plants had two crossovers, and one plant had three crossovers within the region. Of the four plants that had multiple crossovers, three of them were due to singleallele, gene-conversion type events. Markers delineating the region between XksuP14 and XksuP16 on the genetic map (Fig. 4) were mapped on all 465 F2 individuals. Only one plant was found to contain a double crossover within this region. Comparative mapping We compared the genetic linkage map of the Q gene region constructed in the CS × CS-DIC 5A mapping population with those constructed by Kato et al. (1999), Kojima and Ogihara (1998), and the map of the homoeologous region of chromosome 5B constructed in a CS × CS-DIC 5B population (Faris et al. 2000) (Fig. 5). The orders of markers along the CS × CS-DIC 5A map and the CS × CS-DIC 5B © 2002 NRC Canada
I:\gen\gen45\gen-04\G02-036.vp Tuesday, June 18, 2002 2:20:10 PM
Color profile: Generic CMYK printer profile Composite Default screen
Faris and Gill
713
Fig. 4. Comparison of the 5AL physical map with the genetic map of chromosome 5A corresponding to the 5AL-7–5AL-23 deletion interval and the distal segment including the 4A.5A translocation breakpoint. On the genetic map, centimorgan distances are shown to the left and DNA marker names are on the right. On the physical map, fraction breakpoint values and the corresponding deletion line names are given on the left and marker names and their physical deletion interval positions are given on the right. The X symbol preceding marker names is omitted on the physical map to conserve space. Dark bands on the physical map indicate positions of darkly stained C bands.
map were in complete agreement. The degree of recombination among the two maps agreed relatively well, but some variability was observed between specific marker intervals. Xcdo457 and Xbcd1235 cosegregated on the 5A map, but were 2.0 cM apart on the 5B map. Conversely, the degree of recombination was less between XksuQ45 and XksuP50 on the 5B map (2.2 cM) compared with the 5A map (6.0 cM). The genetic distance for the interval between Xcdo457 and XksuP18, which spans the Q locus, was nearly the same, with the 5A map having 12.9 cM and the 5B map having 10.2 cM. The maps constructed by Kato et al. (1999) and Kojima and Ogihara (1998) contained few markers common to our map. However, some discrepancies in marker order were observed. The 5A map constructed by Kato et al. (1999) placed
both Xpsr370 and Xcdo457 distal to Q, but in the inverse order compared with our 5A map. The genetic distance between Xabg391 and Xpsr370 on the Kojima and Ogihara (1998) 5A map was about 12 cM, which is close to the distance between the two markers on our 5A map (10.2 cM). However, Xabg391 mapped proximal to Q on the Kojima and Ogihara (1998) 5A map, but distal to Q on our map.
Discussion Targeting of markers to the Q gene region The chromosome deletion lines of wheat provide an efficient tool for targeting markers to specific regions of the genome. Two lines containing terminal chromosome deletions © 2002 NRC Canada
I:\gen\gen45\gen-04\G02-036.vp Tuesday, June 18, 2002 2:20:10 PM
Color profile: Generic CMYK printer profile Composite Default screen
714
Genome Vol. 45, 2002
Table 2. Clones generated from AFLP analysis comparing deletion lines 5AL-7 and 5AL-23. No. of loci on: AFLP band (primers)
Clone name
5A
5B
5D
Fragment size (bp)
Group 5 specific
E-AAG, M-CAC E-ACA, M-CAT E-ACA, M-CAC E-ACA, M-CTA E-ACA, M-CTG E-AGC, M-CAC E-AGG, M-CTT E-ACA, M-CGA E-ACC, M-CCG
KSUP10 KSUP20 KSUP18 KSUP21 KSUP23 KSUP50 KSUP64 KSUP14* KSUP16*
1 1 1 1 2 1 1 1 1
0 1 1 0 0 1 1 1 0
0 1 1 0 1 1 1 0 1
150 550 200 350 200 500 600 450 380
no yes yes no yes no no no no
Note: The AFLP primer combinations, clone names, number of group 5 loci, group 5 specificity, and fragment size is given for each AFLP-derived clone mapping to the 5AL-7–5AL-23 interval. *Clones obtained from AFLP bulked segregant analysis.
Table 3. Descriptions, sources, number of group 5 loci, group 5 specificity, and suppliers of anonymous RFLP clones used in genetic mapping of the Q locus. No. of loci on: Clone
Description
Source
Marker designation
5A
5B
5D
Group 5 specific
Supplier
ABC155 ABG391* BCD1235* CDO457* CDO1475 FBB255 MWG740 CR1 PSR370* RZ744
cDNA genomic DNA cDNA cDNA cDNA genomic DNA genomic DNA Pr1 gene genomic DNA cDNA
barley barley barley oat oat wheat barley maize wheat rice
Xabc155 Xabg391 Xbcd1235 Xcdo457 Xcdo1475 Xfbb255 Xmwg740 Xksu923(Pr1) Xpsr370 Xrz744
1 1 2 1 1 2 1 1 1 1
1 1 1 1 1 0 1 1 1 1
1 1 2 1 0 1 1 0 1 1
yes yes yes yes yes no yes no no yes
A. Kleinhofs A. Kleinhofs M. Sorrells M. Sorrells M. Sorrells P. Leroy A. Graner S. Morris M. Gale S. McCouch
Note: Clones with asterisks do not map within the Q gene deletion interval.
in the same chromosome arm will differ only for the overlapping segment that is a result of different sized deletions. The rest of the genomic content between the two lines will be identical and any differences will be due to the DNA content within the overlapping segment. These differences can be identified using various types of analysis and DNA markers. We used anonymous RFLP clones, mRNA differential display analysis, and AFLP analysis to identify fragments within the 5AL-7–5A23 deletion interval that carries the Q locus. Using anonymous RFLP clones as probes to identify markers is relatively inefficient because each reaction generally results in the identification of only one locus per homoeologous chromosome. However, extensive genetic linkage maps of cereal crops have been constructed by various researchers using RFLP markers, and comparative mapping studies have shown that barley chromosomes are essentially colinear with those of wheat. Furthermore, linkage blocks of rice, maize, and oat chromosomes can be arranged to correspond to wheat chromosomes (Ahn et al. 1993; Van Deynze et al. 1995b; Moore et al. 1995a, 1995b). DNA clones of rice, maize, oat, and barley will hybridize to wheat DNA provided the sequences retain a certain degree of homology. Therefore maps of the related cereals can be surveyed for RFLP markers exhibiting the potential to detect loci within the targeted wheat segment. In this work, the se-
lection of markers from orthologous regions of related grasses proved to be beneficial. Differential display analysis of RNA isolated from the overlapping deletion lines allowed us to identify fragments of expressed genes within the targeted genomic region. All of the excised fragments yielded single or low-copy sequences that worked well as RFLP probes. The display of cDNA fragments in 5AL-23 that were absent in 5AL-7 indicated that the underlying gene was either present within the targeted deletion interval, or that it was under the control of a regulatory gene that existed within the targeted interval. The absence of a regulatory gene in 5AL-7 would lead to a lack of expression of the regulated genes at other loci and to the differential display of the corresponding fragments. It seems likely that a regulatory gene exists within the Q gene deletion interval that governs the expression of other genes on group 5 chromosomes, because 11 of the 16 differentially expressed bands resulted in 48 loci on group 5 chromosomes. Q is known to affect many traits and is probably a major regulatory gene. It is possible that Q is responsible for regulating the expression of at least some of the other differentially expressed genes identified on the group 5 chromosomes. However, we can not rule out the possibility that another regulatory gene(s) exists within the targeted deletion interval and is responsible for the variation in expression of © 2002 NRC Canada
I:\gen\gen45\gen-04\G02-036.vp Tuesday, June 18, 2002 2:20:11 PM
Color profile: Generic CMYK printer profile Composite Default screen
Faris and Gill
715
Fig. 5. Comparison of three genetic linkage maps of the Q gene region on chromosome 5A and one map of the homoeologous region of chromosome 5B. The maps were generated from CS – T. spelta 5A × CS –‘Cappelle-Desprez’ 5A (Kato et al. 1999), CS × CS-DIC 5A (this research), CS × T. spelta (Kojima and Ogihara 1998), and CS × CS-DIC 5B (Faris et al. 2000).
genes on group 5 chromosomes. The remaining five differentially expressed fragments that were isolated represent genes on chromosomes other than group 5. It is possible that these genes are also regulated by (a) gene(s) within the targeted interval, but we can not rule out the possibility that they represent artifacts of the technique. Gene-expression studies utilizing a wild type and Q mutants will provide information on which of the differentially expressed genes, if any, are controlled by the Q gene. In a similar study, Kojima et al. (2000) compared cDNAAFLP fingerprints of ‘Chinese Spring’ and a deletion line lacking the distal 15% of chromosome 5AL including the Q gene. Sixteen fragments were cloned and verified to be differentially expressed between ‘Chinese Spring’ and the deletion line. Only 4 of the 16 fragments mapped within the Q gene deletion interval, and the rest detected loci elsewhere in the genome. This result agrees with our suggestion that Q, or another gene nearby, regulates the expression of many other genes throughout the genome. Our goal for using the differential display technique was to identify fragments that could be used as markers to detect loci within the Q gene deletion interval. We identified only three of more than 7000 (0.04%) observed fragments that resulted in markers for the targeted region. Assuming that an arbitrary primer primes as a 7mer, it represents 1/16 000 sequences. A given mRNA 3′-end sequence contains about 500 sites for recognition on a denaturing polyacrylamide gel. Therefore, each arbitrary primer will recognize 500/16 000, or 3%, of the mRNAs, so 97% of the mRNAs will not be
seen. With n arbitrary primers, (0.97)n of total mRNAs will not be detected. We used 10 arbitrary primers and therefore detected only about 26% of the mRNAs. To detect 90% of the mRNAs, we would have had to survey 75 arbitrary primers. This would have likely led to the identification of more differentially expressed sequences, but may have further decreased the efficiency of the technique. AFLP analysis of deletion lines 5AL-7 and -23 produced sharper bands that could be scored with less ambiguity than the bands generated by differential display. The presence of a band in 5AL-23 and the concomitant absence of the same band in 5AL-7 indicated that the fragment represents a sequence within the targeted deletion interval. Unlike bands generated by mRNA differential display, AFLP bands represent genomic sequences that are unaffected by gene expression or regulatory genes. However, genomic sequences have a greater potential of being repetitive and are often of little use as RFLP or PCR markers. In total, 26 positive AFLP bands were identified, 16 of which appeared to contain highly repetitive sequences and were not used for further analysis. In comparing AFLP fingerprints of deletion lines 5AL-7 and-23, we isolated seven single or low-copy fragments that mapped within the Q gene deletion interval from more than 5000 AFLP bands. Thus, 0.14% of the observed bands yielded fragments within the targeted region. This is a 3.5-fold increase in efficiency over the differential display technique. In comparison with selecting anonymous RFLP clones from comparative maps for targeted mapping, techniques © 2002 NRC Canada
I:\gen\gen45\gen-04\G02-036.vp Tuesday, June 18, 2002 2:20:11 PM
Color profile: Generic CMYK printer profile Composite Default screen
716
such as AFLP and differential display used in combination with the cytogenetic deletion stocks of wheat provide a more robust and high-throughput method of targeting markers to specific genomic regions. The number of presently available RFLP clones is limited, whereas a virtually unlimited number of fragments can be screened using AFLP, which are easily scored by their presence or absence in the appropriate deletion stocks. The disadvantage is that some positive fragments contain repetitive sequences and thus are not useful when converted to RFLP probes. If an AFLP fragment contains repetitive sequences, it could be mapped in a segregating population as an AFLP marker, but use of such a fragment for screening a large-insert clone library by hybridization is difficult. In theory, the mRNA differential display technique is less efficient than AFLP because the technique is limited by the number of expressed genes. However, the advantage of the technique over AFLP is that recovered fragments represent expressed genes and tend to be low copy, thus making them relatively easy to use as RFLP probes. Physical and genetic mapping The genetic linkage map that corresponds to the physical chromosome segment differing between deletion lines 5AL7 and -23 is about 20 cM long (Fig. 4). The difference in size between chromosome 5A of the two lines can not be measured cytologically. Therefore, this segment accounts for less than 1% of the chromosome arm. Nelson et al. (1995a), Xie et al. (1993), Kojima and Ogihara (1998), and Kato et al. (1999) constructed RFLP linkage maps of chromosome 5A that were about 160, 130, 180, and 240 cM, respectively. This suggests that the submicroscopic deletion interval accounts for 8 to 15% of the recombination that occurs on chromosome 5A. Nonrandom distribution of crossovers along the chromosome has been observed in many organisms including wheat and was discussed in detail in Faris et al. (2000). Several physical and genetic mapping experiments in wheat have suggested that the genes are nonrandomly distributed along the chromosome and most of the recombination occurs within these gene-rich regions (Gill et al. 1996a and 1996b; Faris et al. 2000). Recent experiments involving sequencing and BAC contig construction have verified that gene-rich regions tend to be hot spots for recombination (Feuillet and Keller 1999; Spielmeyer et al. 2000; Stein et al. 2000). In fact, Spielmeyer et al. (2000) showed that the physical distance – genetic distance relationship within a region on chromosome 1DS containing the seed storage proteins was