geological visualisation in the field is a new application area with potential for wider ... application, known as fieldVis [3], was developed and evaluated to test the ... created on a conventional desktop computer using a specialist. Geological .... allowing HTML5 and Javascript access to client side multimedia devices such.
Geological Visualisation with Augmented Reality Dylan Mathiesen#1, Trina Myers#*, Ian Atkinson* and Jarrod Trevathan+ #
School of Business (Information Technology), James Cook University, Townsville, Australia. * e-Research Centre, Townsville, James Cook University, Queensland, Australia. + School of Information and Communication Technology, Griffith University, Brisbane, Queensland, Australia.
Abstract—Geological visualisation while working in the field often requires expensive specialised equipment that is conventionally hard to master. Knowledge and prior experience of the specific techniques and formats used by the different devices is required to create data. This paper presents a new method that applies Augmented Reality (AR) with generic smart phones and tablets to view existing geological data sets. AR is an emerging technology that is a synthesised hybrid between the virtual world and the real world. Here, this method negates the need to understand mapping techniques when referencing threedimensional (3D) models to the above ground terrain. Geologists can explore subterranean phenomenon with datasets visually laid accurately over the environment so the need to reference diagrams and maps to the physical world while in the field is no longer necessary. Geologists can see data as though it were part of the environment, analogous to giving them x-ray vision in the field. We present a prototype that can be applied in fields of education or as device to assist the mining industry to enhance understanding of subterranean geological structures. For example, volcanic structures, faults and fractures can be seen as they would appear from the surface or mine data such as tunnels, ventilation, ore bodies and rock types. AR techniques used for geological visualisation in the field is a new application area with potential for wider commercial applications. Keywords—Augmented Reality, Visualisation, Smart Phones/Tablets
I.
Geology,
Geological
INTRODUCTION
Visualisation of geological features is a complex computational task that requires geological knowledge and understanding of three-dimensional (3D) modelling. Currently, few visualisation tools allow geologists to view subterranea and then directly relate it to the above ground terrain. Therefore, it would be beneficial to have a tool that enables Geologists to understand quickly the relationship between the unseen subterranean geological features and the visible surface. Visualisation technologies can help to understand processes under the ground and aid in teaching these concepts to students. The current visualisation technologies allow the creation of highly detailed 3D models and diagrams, which enable the teaching of complex concepts through visual demonstrations. However, static or animated diagrams do not easily show the relationship between geological features and the real surrounding terrain.
Maps have a similar problem to the conventional geological 3D packages, as they do not directly show how they fit into the environment. Maps require translation by a user with specialist knowledge to interpret representations into usable information. A technology that does have the potential to show how complex geological features fit into the environment is Augmented Reality (AR). AR is the term given to the enhancement of the real world [1]. In essence, AR creates a hybrid view of the real and virtual world. This hybrid can be used to bring new understanding to the real world by the addition of new information or the revealing of otherwise obscured information. New information can be placed into the environment to enhance the user’s perception of reality [2]. AR can be used to translate geological features to the environment. The complex process of translating conventional maps or 3D models can be simplified by visually placing the information into the environment. Geologists can instantaneously relate models to the above ground terrain where the visualisation is only limited to the geographic location from where the data was collected. Then, geologists, students and mining engineers and/or management can view the AR model as though they were peering through the ground at the geological feature itself. Users with no cartography or geography experience can more easily grasp complex geological structures in their surrounding environment. The requirements for spatial awareness and map comprehension skills to understand complex concepts are reduced because geological structures can be seen in context to the above ground terrain. For example, if applied to teaching in geology AR has the potential to provide concrete examples of structures and their relationship to the landscape on the surface. These more practical visualisations could aid teachers in explanation of subterranean structures that are not commonly visible. This paper describes a technique where virtual environments are placed over a mobile device's view of the real world and "clamped" geographically to the environment. The users of the handheld devices can see and move around virtual objects as though they are real. The goal is to create a new method for visualising subterranean features using modern AR techniques. This enables users to easily comprehend how subsurface structures fit into the environment. A prototype
application, known as fieldVis [3], was developed and evaluated to test the capabilities of consumer mobile devices for producing acceptable geological visualisations in the field. The prototype is an AR system capable of visualising structural geology. Although this paper focuses on the field of Geology, this device could potentially benefit any of the Earth Sciences and have applications in other disciplines requiring similar visualisation techniques.
enabled more complex and realistic graphics [1]. Powerful handheld devices have almost become commonplace in many countries, with 2011 sales totalling 472 million units. The abundance of faster devices, with GPS has allowed AR technology to start growing, making it available to a large user base. The growing user base and improvements to cellular networks provides the ability for users to access location-based services all around the globe.
This paper is organised as follows: Section 2 presents an overview of the geography visualisation techniques and technologies and the AR concepts. Section 3 describes the development of the fieldVis framework and the AR in-field prototype. Section 4 outlines the results of a participatory study. Section 5 discusses the feasibility of using AR on mobile devices when working in the field. Section 6 concludes the paper with possible implications for geological science, the mining industry and education.
The notion of subterranean visualisation using AR has been around since 1998 as a tool for underground pipe visualisation [10]. Further developments in technology and improvements in GPS and inertial tracking systems made systems more accurate and started opening new areas for application of AR tools [11].
II.
BACKGROUND AND REQUIREMENTS
A. The geological domain Geologists utilise 3D geological modelling packages to create and manipulate 3D data and models. These tools allow the construction of raw data into coherent and easily interpretable structures [4]. The significant advantages 3D environments provide over conventional paper maps include better manipulation of depth perception and colouring and the ability to zoom and pan around the entire field [5]. Data sets commonly used by geologists can consist of details of rock structures, pockets and seams of minerals, mine topography, and soil data. 3D models of these types of data are often created on a conventional desktop computer using a specialist Geological package such as GOCAD or GeoModeller. Models commonly used can be represented by either surfaces showing one side of a structure, or an enclosed model representing an entire structure. These modelling tools allow the exportation of 2D maps for use in the field and/or 3D models taken into the field for viewing on laptops. Developments in GIS software for smartphones and tablets have enabled the viewing of geological data in the field on small devices [6]. However, data is still constrained to the device or map and the user must still comprehend how the visualisation fits the environment. [7] Augmented reality provides the potential for simplifying the comprehension process of understanding geological data by showing the data’s relationship to the surface. AR devices have been shown to offer significant improvements to performing complex tasks and comprehension of complex systems in the real world [8, 9]. AR’s application to geology provides a new way to view the data and can extend the reach of complex geological models to users with limited geology experience. B. Augmented reality Many AR devices and applications have been successfully built and several have been deployed and commercialised. The majority of the newer AR systems run on handheld computing devices, such as tablets and smart phones. Handheld devices have become much faster over the past few years and have
As portable computers became lighter, smaller and faster AR moved onto handheld devices enabling users to carry systems in their pocket [12]. A more recent development in handheld AR technology known as “Vidente” was used to visualise pipes and cables underground [8]. Vidente is a prototype device developed to visualise underground city infrastructure. The prototype uses AR so users can effectively see underground assets from their perspective. A new range of AR implementations based on the same technology are taking advantage of the hardware on modern smart-phones and tablets, which makes the technology more accessible to the wider public [13]. Related work includes Layar, Wikitude and Junaio [14], which are some existing AR applications available on smartphones and tablets. All three are well-known AR browsers that allow users to look at content created by many different users or services in the one application. Information and points of interest (POI) are downloaded from the Internet and laid over the environment to give the user more information about an area. Together they are the most commonly used type of AR system available to mobile devices. These current AR systems are capable of successfully augmenting custom 3D objects over the environment. However, they do not allow for the application of custom visualization or rendering techniques required for the different types of geological data. C. Limitations and Requirements The solution must run on low cost commonly available hardware to achieve the required results. Smartphones and tablets where selected as the base hardware. Although the computational power in these devices has increased significantly over the years, the demands of running both AR tracking and complex visualisations on the hardware are high. The hardware for a successful subterranean geology visualisation tool must be capable of showing complex structures laid over the devices camera image in real time. The complexities of geological structures underground can often require complex 3D models to fully represent them. The complexity and file size of a model directly influences the load time of data. The solution in this development needed to load large models quickly from non-volatile memory. To effectively display subterranean data the depth of occluded objects must be apparent to users. A lack of depth cues necessary for accurate representation of an objects
location is a common problem that must be resolved with AR devices [18]. Depth perception is the visual ability to perceive the world in 3D and the distance of an object. The scale and size of an object as it appears in a 3D space can change how the objects location is perceived. The scale and size have a large impact on the applied rendering technique. The requirements for a subterranean geology visualisation tool include the ability: •
To display information smoothly and accurately;
•
To load large geological models quickly; and
•
To show enough depth information to understand geological models relation to the surrounding terrain.
A mobile device software platform was selected to meet the requirements as previously listed. Android, iOS and Windows Phone all have native Source Development Kits (SDKs), which provide an abstracted environment to build applications in. Applications built using native SDKs are restricted to their respective operating system. The alternate, device independent technologies, provide the ability to develop applications that can run across multiple operating systems. An example of a device independent technology is Adobe Air, which enables the development of applications that can run on all supported smart phones and tablets with minimal modification. Another example is Hyper-Text Markup Language 5 (HTML5) with WebGL1, which would be a strong contender due to its platform independent nature. WebGL enables hardware acceleration of 3D graphics in supported web browsers. A sensor based AR system could be built by coupling the devices sensors with the webcam using the WebRTC2 standard and WebGL for graphics processing. III.
IMPLEMENTATION
Android was selected as the platform for development due to its open source nature and availability to consumers. The Android operating system is the fastest growing mobile operating system on the market [15], which provides more opportunities for accessibility and availability of this technology. The app was developed as a native android application due to the performance requirements and need for underlying hardware access. HTML5 was a strong contender as a device independent technology, however WebGL and WebRTC are not currently supported on any mobile devices. The underlying positioning and orientation tracking needed in this AR system is provided by Mixare [16], an open source solution. Mixare was ideal as the backbone for a custom visualisation overlay and is one of the few active open source AR projects on Android. However, Mixare does not provide the capabilities for loading large mesh datasets or rendering these datasets. Thus, a custom visualisation layer was built on
1 WebGL (Web Graphics Language) is a low level Javascript interface to enable OpenGL based graphics support in HTML5. 2 WebRTC (Web Real-time Communication) is a draft specification allowing HTML5 and Javascript access to client side multimedia devices such as web cameras.
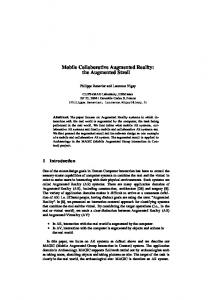
Figure 1: Architectural Diagram of fieldVis
top of Mixare to take advantage of the location and orientation tracking provided. The visualisation layer built consists of two major parts; the visualisation system and the model loader (Figure 1). The first component is the visualisation system, which performs the rendering of models. OpenGL [17] was selected as the rendering environment due to its diverse toolkit and widespread adoption as the industry standard for 3D Graphics. OpenGL enables control of all aspects of the rendering process and allows custom stylisation appropriate to geology to be applied to rendered models. The second component is the model loader, which enables the importing of models along with their positioning and rendering information into the visualisation environment. Geological models often cover a vast area resulting in large files to represent the features. The model loader is required to quickly load geological models from the devices storage, and provide them to the visualisation system. To quickly load models they are reduced on a workstation computer before being copied to the device. A. Locating Models The location of the model to be augmented in the real world is important because it determines the size and parameters required of the drawn model. The drawn models, which are built by the user and represent real or pseudo-real structures, are placed into the real world. The model is positioned in OpenGL using the glTranslate function, which is a core function of OpenGL that allows the movement of objects in the virtual world. To move objects in to the correct location the distance needs to be calculated from the users current position and the objects intended position. The camera angle is crucial to determining the distance that the object needs to be moved. To adjust the virtual camera's view angle, the vertical field of view is set to match the devices
camera's vertical field of view. By setting the virtual cameras field of view to the same as the real cameras means that any translation in the virtual world is of 1:1 equivalence in the real world and vice versa. This equivalence means movement in the virtual world can be defined using real world measurements, assuming the same unit of measure is used globally. The movement of objects in OpenGL uses relative distances, so any measurement system can be used globally without conversion. The metric system was used here to conform with exported models from GoCAD. The units chosen for scaling in the operation of fieldVis were meters. To further simplify movements the position of the virtual camera always stays at 0,0,0 and the models move as needed around the camera. This allows user defined adjustments to be made after the models position has been determined, such as applying additional rotation or translation. Positioning models is a straightforward process using the glTranslate function in OpenGL. Units for the models position are given as World Geodetic System of 1984 3 (WGS84) decimal degrees, a common geographic co-ordinate system supported by most geological modelling packages. These units are compared to the devices current position to determine the position of the model relative to the device. The decimal degrees from the WGS84 co-ordinates are converted into meters. Altitude is calculated from the GPS and models altitude, both given in meters. The altitude is then simply expressed as the difference between the devices altitude and the models altitude. The measurement in meters for all three axes (meters east, meters north and altitude difference) are then passed straight to the OpenGL before the model is drawn. B. Loading Models 3D models representing geological structures or surfaces are commonly comprised of vertices, edges and polygons. Vertices are points on the 3D model that when joined with a line form an edge. A loop of edges defines a polygon, which can be drawn to represent part of the surface of a shape. Commonly polygons are limited to three or four sides (Triangles and Quads). Models produced in a geological modelling application such as GoCAD often use both triangles and quads. FieldVis supports the importation of any models that can be represented by three vertices per face. While models with four vertex faces are common and supported by the standard OpenGL implementation, the mobile OpenGL ES implementation only supports vertex faces. To produce models suitable for use in the OpenGL ES implementation all faces must be converted to triangles.
C. Rendering Models The rendering phase is the final stage of producing the augmented effect and is the where the visible model is produced. OpenGL renders and produces an image based on the models loaded, their positioning, colouring and opacity. This produces a view of the virtual world with the same aspect as the devices camera would see in the real world. The rendering produces an image of the virtual world on a transparent background. This rendered augmentation can then simply be placed on top of the image produced by the devices camera to give the impression the virtual objects are located in the real world. Several colouring and styling techniques were explored to determine the best process for overlaying objects while maintaining depth cues. The first method rendered objects in a single colour with no transparency. This is comparable to models overlaid in general AR browsers that are textured but have no transparency. The lack of transparency worked well for objects that where sitting on the surface. However, objects under the surface still appeared to be on the surface. Complex shapes also lacked sufficient detail to fully understand the shape. To improve the poor depth perception several improvements were investigated to determine their potential for use with geological models. Adjusting the transparency of the model with a gradient based on depth adds more contrast to bumps and makes depth more obvious on complex shapes. The effect can be seen in Figure 2 where lower parts of the model in the bottom left are more transparent than the sections at ground level on the right. Transparency increases as parts of the model gain depth. This effect can be applied to colour to produce an effect similar to a rainbow coloured height map, which is often used for creating heat maps. For example, higher parts of the model could be red but transition to blue towards the bottom of the model. These effects significantly help show the change of depth in a model. A further issue with using a solid or transparent colour to render a complex object is the loss of detail. To make details in the object more pronounced a wire frame of the object was drawn with the semi-transparent coloured object (Figure 2). Drawing wire-frames is not natively supported due to OpenGL ES's limited feature-set. A custom wire-frame drawing technique was implemented that draws the wire-frame where separate calls to the draw function are made for each triangle.
Conversion between the two formats is a straightforward process in most 3D modelling packages. To evaluate fieldVis, Blender was used to convert models to triangle only faces. These models once exported from blender are simply converted and imported into the device by a user.
3
WGS84 is a standard commonly used in cartography and navigation to provide a co-ordinate system for referencing locations on earth.
Figure 2: Wire frame and gradient transparency make details and depth of the model more apparent.
The draw fucntion specifies to draw only the lines with a black colour. The addition of the wireframe to objects makes complex details more obvious and intricacies of objects much easier to interpret. D. Modelling The prototype system takes geological data in the form of 3D models. Models can be developed to represent any objects below or above the surface to be augmented into the environment. Models are usually constructed using triangles or quads; however, the device only accepts triangles due to limitations in OpenGL ES. Conversion from quads to triangles is a simple process in a 3D package such as blender. When the modelling is complete, models can be exported as a Wavefront Object (.obj) file and converted using one of the two custom conversion scripts. The conversion scripts strip unnecessary information from the object files to improve load speed on slower handheld devices. The primary script allows the conversion of models that are built using coordinates in the WGS84 geographic co-ordinate system. Models using geographic co-ordinates are more common in the geological community as many geology specific modelling packages support output in the WGS84 format. The secondary script allows the importation of models that are using Cartesian coordinates, which are more common in the generic 3D packages. Both scripts automatically produce a meta-data file along with the converted model file. The meta-data file provides the ability for content creators to customise how their data is visualised on the device. The meta-data contained in the file provides extra information needed by the device to correctly draw the models on the device; including co-ordinates, rotation information, position offset and rendering stylization details. The primary script produces a meta-data with location information automatically filled, and is then ready to be added to the device. Notably, models converted from a Cartesian coordinate system require users to manually enter location information into the metadata file.
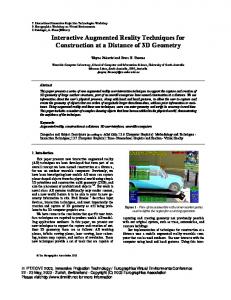
Figure 3: (different view of the subduction model in Figure 2) Scaled down subducting plate demonstration augmented over street to show tectonic plate interactions using the road and footpath as pseudo-real examples.
down subduction demonstration located outside on a nearby road, as pictured in Figure 3 as well as the volcanic bodies in Figure 4. This part of the participatory study aimed to collect feedback on the comprehensibility of the augmentation. The performance of fieldVis on a mobile device is crucial to establishing the feasibility of augmenting real world geological models with low powered hardware. FieldVis needs to handle the potentially large size of geological models. Two performance tests were designed around common bottlenecks in similar systems. These bottlenecks are the speed large models can be loaded and the frame rate of rendering large models. The device used for testing was a HTC Desire smartphone running the android operating system. At the time of testing the Desires hardware is on par with the mid to entry-level smartphones on the market. The device was selected to match the requirement of being available to users who may not have access to more expensive hardware. The tests were designed to analyse the performance on a common device and to evaluate the capacity to load and display realistic geological models. The tests were run ten
E. Testing User testing by observation and a survey were completed to help gauge the quality and potential of the prototype. The participatory study was from the perspective of a geologist as they use 3D geological models as part of their work and would have potential uses for this kind of system in their fieldwork. In addition, geologists who teach in the field and could use the system for pedagogical purposes. The participatory study was completed in a geology visualisation laboratory and also outdoors. The participants were asked to follow the manual written to instruct on how to set up existing data from GoCAD in the device. Then, models the participants had previously constructed in GOCAD were used to test the devices with real world geological data. The geologist, two science teachers from a Secondary School and 10 university students where then given the opportunity to explore local geological data loaded onto the device. The participants were able to explore a smaller scaled
Figure 4: Geological models of subterranean granite bodies and volcanic structures around Townsville, Australia. (a): Volcanic flanks, residing north of Castle Hill and extending to Magnetic Island. (b): Magma body residing underneath Castle hill. (c): Magnetic Island granite structure located beneath the island.
times and averaged to minimise the effects of external or internal influences from other applications running on the mobile hardware. To ensure consistency amongst the tests all background applications and services that could be stopped where closed. The testing utilized both synthetic and real world models. The synthetic model was a 1x1x1 meter cube comprised of 15608 vertices. The real world models, shown in Figure 4, are geological models of granite and volcanic structure around Townsville, Australia. The models where created in GOCAD by a geologist from James Cook University. The models represent the remaining, albeit buried, volcanic structure in the region and where chosen due to their locality and suitability for demonstrating geological phenomena little known by nongeologists. These models originally ranged from 36,000 to 65,000 vertices but for the purpose of the performance trial they were simplified using Blender's poly reduce tool [19]. Models were converted using the WGS84 conversion script and copied over to the device. IV.
(a)
RESULTS
The prototype device is successfully able to augment geological models into the environment. Figure 5 (b) shows the volcanic models from Figure 4 augmented over the environment. The screen shot in Figure 5 (b) was taken directly from the operational device so it does not give the full experience of the live overlay. An isometric view (Figure 5 (a)) was added to show the relationship of the geological models to the surface. The isometric view still lacks the cues to relate these structures quickly to a user standing in the field. FieldVis is able to show the relationship of subterranean structures directly to the surface without the need for user interpretation. Depth and position is a lot more apparent on the device as the device can move around. Interestingly, the static screen shots taken from the device re-introduce the same loss of spatial awareness and difficulty of interpretation this project aimed to overcome. The transparency gradient based on depth adds more contrast to bumps and makes depth more obvious on complex shapes compared to an even transparency. The variation in transparency helps to make objects that cross over themselves, such as mine tunnels or pipes more visible. The lower tunnels appear more transparent than tunnels above them and help to show changes in depth. The gradient also works well with mostly planar surfaces such as in Figure 3. As the plane disappears underground it gradually becomes more transparent. Indentations and unevenness in the plane become more obvious due to the variation in transparency. FieldVis was received well during the participatory study and survey. The geologists who were given a chance to view the device noted the potential the device had in the field for quickly comprehending complex structures. Similarly, test participants noted great potential for teaching geology students about structural geology in the field.
(b) Figure 5: (a) 3D representation showing models in as they sit under Townsville, Australia. (b) All three models augmented over environment using fieldVis. Screenshot taken from the Mount Stuart Observatory (Townsville, Australia).
There was a consensus that AR could reduce the need for interpretation of maps and models into the real world. Further implementations could extend geological data and to a wider user-base including students and even the public. For example, teachers could help students understand complex underground structures that cannot be seen. Importantly, this system could aid in the development of the skills required to understand maps by non-geologists who simply need concrete examples of sub terrain in a real world visual (e.g., mining engineers and mining management). The feedback received was overwhelmingly positive and the ability to quickly import existing data sets was a popular feature. The feedback also included many comments about extensions to the system into similar scientific disciplines. Suggestions received from the local secondary school indicated
significant interest not only for off-campus field trips but also for exploring smaller local structures such as the water table and the depth map of the school pond. The most notable suggestion was extending the device to support collection of strike and dip measurements in the field and to display them in the environment. The ability to quickly reference where and what measurements are taken could provide significant advantages over current paper or digital logging systems. Table I. shows the time taken to load models with specific vertex counts into the device. The slow load time was expected due to the limited processing power available on the device. Each model was loaded and timed separately three times and the results where averaged. All the models where simplified using the poly-reducer script within blender. The script lowered the polygon count on average by a factor of ten without adversely impacting the appearance of the final augmentations. TABLE I.
LOAD TIME OF REALISTIC MODELS.
Name
Vertices
Mean Time
Basic Subduction
243
396ms
Volcanic Flanks
3669
5752ms
Magnetic Island Granite
4587
9384ms
Volcanic Chamber Cube
6228 15608
10113ms 21095ms
Table II. shows the average frame-rate of the OpenGL layer in fieldVis. The measured frame-rate taken from the application with models loaded was as expected from OpenGL ES on a low-mid range mobile device. The tests were conducted outdoors with GPS signal with the device looking directly at the models to provide results similar to those expected in the field. All background applications that could be halted where closed to ensure consistent results. Starting 60 seconds after the application loaded the frame-rate was taken every 20 frames over a 30 second period and averaged. Variation between each 20 frames was observed to be minimal. TABLE II.
FRAME-RATE OF DEVICE WITH DIFFERENT TEST MODELS LOADED.
Name
Vertices
Volcanic Flanks, Magnetic Island Granite, Volcanic Chamber 2x15608
14484
Frame rate per second 27fps
31216
15fps
3x15608
46824
11fps
V.
DISCUSSION
The potentially large size of geological models, due to the complexity of the features represented, presented a potential road block for applying AR to geological models on low powered mobile devices. The load speed of models has a large influence over device usability. Benchmark results of the load performance demonstrated that models of a larger vertex count required significantly longer times to load. This was an expected result due to the procedural nature of the model loader. The load time for the three volcanic models was 25
seconds, which is quite acceptable for loading over 14,000 vertices. The improvement of resuming models was on average five times faster than when a model is first loaded. Models are serialised to storage on their first load, resulting in substantially faster load times each subsequent time the application is opened. Resuming the closed application is the most likely use case for a device being used in the field. A. Frame rate The results from the frame rate test demonstrated that the increase of model complexity resulted in a decrease in rendering performance. The frame rate of the device was limited to 30 frames-per-second (FPS) to reduce wasted processing power when only displaying simple models. The frame rate decreased significantly after loading the 2x15608 models. However, the quality of the augmentation did not decrease noticeably until the 3x15608 models where loaded. The lower frame rate resulted in rougher movement as the device panned around. The jumpiness in the movement was caused by the smart-phone being unable to render new frames fast enough. Notably, the apparent jumpiness of models when panning is not of huge concern when looking at geological features, as they do not require the user to make quick perspective changes. Further, the quality of the real world geological models was only trivially degraded and ample capacity is left for larger geological models to be loaded simultaneously. B. Depth perception A limitation of the fieldVis is the range of depth the device can effectively display. The issue lies in the perception of depth on a 2D screen without having the ablity to quickly move around the object. The user can easily comprehend the spatial relationship of a model by changing the viewing angle in a standard 3D environment. However, the ability to change the viewing angle is more difficult in an augmented reality system and requires the user to move around the object physically, which may not be practical for large objects. When the user is viewing from directly over the model there is a loss of depth perception. The top view of any 3D modelling environment has a complete loss of depth perception. However, the loss of depth is an expected limitation and does not inhibit the ability to see how a structure sits in the environment. As the user moves back from the model the depth will again become apparent. The lack of depth from static positions and directly above the feature being visualised fade away as the user starts to move around the field. Although the system is unable to communicate depth of larger models precisely, it does provide significant potential to see sub-surface features in the environment. This also provides teachers with the ability to demonstrate structures to students in the field, which can aid in the comprehension of complex geological phenomena.
C. Further Applications The feedback received during the participatory study showed the potential and interest in fieldVis as a geological visualisation tool. Several extensions were also noted as having merit for educational purposes. The ability to visualise the depth of the school pond was an unexpected use for the device. The school could record depth measurements in the pond and create a mesh of the pond bed allowing students to understand contours underneath the pond. VI.
FINAL REMARKS
The ability to comprehend and understand sub-surface features is a valued skill in geology. This paper presented the fieldVis prototype, which is capable of rendering real geological models over the environment. Users are able to walk around and explore geological models clamped to the real world from their current perspective allowing easier comprehension of sub-surface features in the real world. Existing geological models are simply imported into the device using conversion scripts. The system was tested for performance and functionality necessary to augment subterranean geology on mobile devices. The results from the tests indicate that it is feasible to use standard smart phones and tablets for geological visualisation enhanced with AR. The size and complexity of common geological models can be quite extensive but they can be simplified with generic 3D applications such as Blender with minimal loss of detail to prepare them for visualisation on small devices. The results and feedback provided during the participatory study indicated the potential for use of fieldVis in educational geological applications. FieldVis offers a new way for students to visualise data without having to rely on their interpretation of 2D maps or conventional 3D modelling. The prototype, fieldVis, presented in this paper simplifies the comprehension process of interpreting subterranean geological models and their spatial relationship to the landscape. The placement of object into the environment reduces the need for cartography and geography experience to understand the structures. For use in the mining industry, this technology would allow mining engineers and management, who may not have the same cartography skills as geologists, to visualise underground structures around a mine site. FieldVis is a first step in making comprehension of subterranean features and their relation to surface terrain an easier task for both the geological and non-geological communities. The findings from this project show that current smart phones and tablets have ample capacity for geological visualisation. The use of mainstream consumer hardware for scientific visualisation opens the door for easier access to geospatial science by the public. Future applications of AR into not only the geological domain but also all field sciences have great potential. ACKNOWLEDGMENT The authors would like to thank the staff at the School of Earth and Environmental Sciences at James Cook University
and in particular Dr Simon Richards for their expertise and feedback to this project. REFERENCES [1] [2]
[3] [4]
[5] [6] [7]
[8]
[9]
[10] [11]
[12] [13]
[14] [15]
[16] [17] [18] [19]
R. T. Azuma and others, “A survey of augmented reality,” PresenceTeleoperators and Virtual Environments, vol. 6, no. 4, pp. 355–385, 1997. M. A. Livingston, L. J. Rosenblum, D. G. Brown, G. S. Schmidt, S. J. Julier, Y. Baillot, J. E. Swan, Z. Ai, and P. Maassel, “Military Applications of Augmented Reality,” in Handbook of Augmented Reality, B. Furht, Ed. Springer New York, 2011, pp. 671–706. D. Mathiesen, “FieldVis.” [Online]. Available: http://fieldvis.com/. [Accessed: 04-Nov-2011]. G. D. Toro, S. Mittempergher, F. Ferri, T. M. Mitchell, and G. Pennacchioni, “The contribution of structural geology, experimental rock deformation and numerical modelling to an improved understanding of the seismic cycle: Preface to the Special Volume ‘Physico-chemical processes in seismic faults’,” Journal of Structural Geology, in press. J. N. Van Driel, “Three dimensional display of geologic data,” Short Courses in Geology, vol. 10, pp. 57–62, 1989. W. Binzhuo and X. Bin, “Mobile phone GIS based on mobile SVG,” in Geoscience and Remote Sensing Symposium, 2005. IGARSS’05. Proceedings. 2005 IEEE International, 2005, vol. 2, pp. 4. T. Hollerer, S. Feiner, T. Terauchi, G. Rashid, and D. Hallaway, “Exploring MARS: developing indoor and outdoor user interfaces to a mobile augmented reality system,” Computers and Graphics, vol. 23, pp. 779–785, 1999. G. Schall, E. Mendez, E. Kruijff, E. Veas, S. Junghanns, B. Reitinger, and D. Schmalstieg, “Handheld Augmented Reality for underground infrastructure visualization,” Personal Ubiquitous Comput., vol. 13, no. 4, pp. 281–291, May 2009. S. Henderson and S. Feiner, “Evaluating the benefits of augmented reality for task localization in maintenance of an armored personnel carrier turret,” in Proceedings of IEEE International Symposium on Mixed and Augmented Reality (ISMAR) 2009, 2009, pp. 135–144. S. W. Lawson and J. R. G. Pretlove, “Augmented reality for underground pipe inspection and maintenance,” in Proceedings of SPIE, 1998, vol. 3524, pp. 98. G. W. Roberts, A. Evans, A. Dodson, B. Denby, S. Cooper, R. Hollands, and others, “The use of augmented reality, GPS and INS for subsurface data visualization,” in FIG XXII International Congress, 2002. D. Wagner and D. Schmalstieg, “First steps towards handheld augmented reality,” in Wearable Computers, 2003. Proceedings. Seventh IEEE International Symposium on, 2003, pp. 127 – 135. T. Langlotz, S. Mooslechner, S. Zollmann, C. Degendorfer, G. Reitmayr, and D. Schmalstieg, “Sketching up the world: in situ authoring for mobile augmented reality,” Personal and Ubiquitous Computing, in press. L. Madden, Professional Augmented Reality Browsers for Smartphones: Programming for Junaio, Layar and Wikitude. John Wiley & Sons, 2011. Gartner, “Gartner Says Worldwide Smartphone Sales Soared in Fourth Quarter of 2011 With 47 Percent Growth.” [Online]. Available: https://www.gartner.com/it/page.jsp?id=1924314. [Accessed: 12-Apr-2012]. “mixare Free Open Source Augmented Reality Engine.” [Online]. Available: www.mixare.org. “OpenGL The Industry’s Foundation for High Performance Graphics.” [Online]. Available: http://www.opengl.org/. [Accessed: 12-Mar-2012]. D. Kalkofen, E. Mendez, and D. Schmalstieg, “Comprehensible visualization for augmented reality,” Visualization and Computer Graphics, IEEE Transactions on, vol. 15, no. 2, pp. 193–204, 2009. “Blender.” [Online]. Available: http://www.blender.org/. [Accessed: 12-Apr-2012].