Geomorphometry.org/2015
Kociuba
Geometrical parameters of TLS-based DEM acquisition for a small Arctic catchment (Svalbard SW) Waldemar Kociuba Faculty of Earth Sciences and Spatial Management Maria Curie-Sklodowska University Lublin, Poland E-mail:
[email protected] scanning [ALS] (3,4), the application of TLS in research on Arctic areas is still rare (5,1,6). In the case of the applications to date, the importance of selection of the relevant measurement strategy has been emphasised. This particularly concerns the applied methods of reference (7,2,1), and the implementation of normalised methods of area and volume analysis for the purpose of obtaining better comparability of results (8,1,5,6).
Abstract. The article presents an example of application of the Terrestrial Laser Scanning (TLS) technology in high definition surveys and recording results of geomorphical events, as well as in the assessment of the dynamics of transformations of the small paraglacial Tyvjobekken Stream valley. The field works involved the application of a Leica Scan Station C10 and GPS RTK global positioning system. The Tyvjobekken Stream is a paraglacial tributary catchment typical of the Arctic morphoclimatic zone. It is located in the NW part of the Wedel-Jarlsberg Land (Spitsbergen, Svalbard). A complex survey of the main part of catchment (central and lower part of the valley) was carried out from 24 interrelated measurement sites. 3D scanning at each of the sites resulted in a point cloud of 5 million points [M pt.]. The resulting cloud of 170 M pt. of data was used to create a digital elevation model [DEM] of the river valley with a length of more than 1.2 km and width of up to 0.45 km. The DEM developed based on the TLS survey, featuring high point density, permitted the determination of the basic hypsometric parameters of the analysed part of the catchment and valley floor, and comparison of the parameters of the asymmetric slopes of the valley’s mouth section. The high accuracy of the obtained model permitted precise identification of the geometry of the main slope and valley floor landforms, as well as the identification and inventory of ephemeral rills and braided channels.
The primary objective of this paper was to evidence the effectiveness of TLS as a universal tool of spatial analyses in the environment of small Arctic catchments, and to develop a strategy of application of TLS in research on the dynamics of transformations o non-glaciated Arctic catchments. II.
RESULTS
A. Study area The research involving the application of TLS in the cold climate environment covered the Tyvjobekken Stream catchment located in the NW part of the Wedel-Jarlsberg Land, in the Bellsund Region of Spitsbergen (Fig. 1). The paraglacial valley of the stream dissecting the area of elevated marine terraces (called the Calypsostranda) drains the eastern forefield of the Renard glacier, and the slopes of the Bohlinryggen massif. The sources of the stream with nival-permafrost alimentation regime, developing a catchment with an area of 1.3 km2, are located at the forefield of the Bohlinryggen massif. The paraglacial Tyvjobekken Stream valley stretches from WSW to ENE along approx. 1.2 km, reaching a mean inclination of approx. 4.1% (9).
I. INTRODUCTION In the conditions of modern rapid transformations of the Arctic environment, the quantitative and qualitative assessment of the dynamics of the processes requires the application of new research strategies and precise measurement tools (1). The application of Terrestrial Laser Scanning [TLS] for monitoring transformations of slope (mass movements, solifluction, muddebris runoffs, debris flow) and valley landforms (changes in the channel pattern, lateral erosion, scroll ridges) subject to continuous dynamic transformations permits the assessment of the rate of the occurring processes, and the identification of potential threats of occurrence of catastrophic phenomena (2). In contrast to the increasingly commonly applied data from aerial
The valley floor relief includes three clearly distinguishable parts. The upper part has a character of an extensive, weakly developed basin covering the area between the moraine zone of the north-eastern forefield of the Renard glacier and the eastern slopes of the Bohlinryggen massif. From the side of the forefield of the Renard glacier, the Tyvjobekken Stream is fed by a bifurcating stream using the former routes of outwash plain runoff.
In: Geomorphometry for Geosciences, Jasiewicz J., Zwoliński Zb., Mitasova H., Hengl T. (eds), 2015. Adam Mickiewicz University in Poznań - Institute of Geoecology and Geoinformation, International Society for Geomorphometry, Poznań
61
Geomorphometry.org/2015
Kociuba
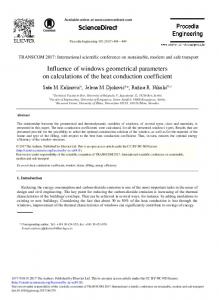
case, medium resolution was applied (0.1/0.1 m per 100 m), permitting obtaining an average of approximately 5 M pt.at each of the measurement sites. The final DEM quality depends on both the technical possibilities of the device, and the applied field survey strategy (1,5). The survey involved the application of the modified target point [TP] method (5), i.e. measurement of a point with known coordinates oriented to the network of permanent control points with known coordinates [KC]. The measurement based on a network of points with known coordinates required prior permanent marking of points of the planned location of the scanner, as well as reference points (they were applied interchangeably). The determination of the location of the KC point network was based on satellite positioning by means of the GPS RTK TopCon Hipper II system. Although the KC methods required a precise (accuracy of 1 mm) determination of the location of the scanner at the measurement site, the orientation of the scanner was only based on one reference point. As a result of the application of the KC measurement strategy, each of the measured points already had geographic coordinates during the scanning process. Such organisation of measurements largely reduced the time of interpretation of results. The Leica Cyclone 8.0 software used for DEM integration automatically combines georeference model spaces obtained by means of this method into one 3D model (Fig.1).
Figure 1. Digital elevation model of the scanned part of the Tyvjobekken Stream catchment (gridding method: Triangulation with Linear Interpolation, spacing: 0.1 m).
In its middle section, the stream develops a gorge with a depth of up to 25 m, extended along 0.8 km of the edge of the elevated marine terrace (9,10). The section is distinguished by a narrow erosional valley developed by the braided system. In this part, the stream is fed by small, periodically functioning tributaries with nival-permafrost regime. The slopes of the middle part of the valley have a character of an erosional scarp dissected by shallow erosional cuts, periodically modelled by cryogenic and solifluction processes and slight debris flow (e.g. 5). The floor with inconsiderable denivelations is modelled by a system of shallow channels (1,11).
C. Results. Catchment characteristics The data (point clouds) transformed to a DEM model permit geomorphometric analyses of land surface, including the estimation of the area or volume, and detailed measurements of the geometry of selected landforms at various spatial scales (1), or analysis of changes in the shape of cross-sections and longitudinal sections (e.g. 13). The measurements resulted in a DEM model obtained from the integration of 24 “model spaces”, comprising approximately 170 M pt. The obtained model covered approx. 37% of the catchment area, including the entire erosional valley and subcatchments of the main tributaries. For the purpose of comparison of the analytical and interpretative possibilities of the obtained DEM, multiscale objects were selected for the detailed analyses. The macroscale object was the erosional valley with a length of approximately 1.18 km and width from 0.01 km to 0.44 km (13% of the catchment area), dissecting the elevated marine terrace (14-30 m a.s.l.). Along the section, the valley has a character of a gorge with a length of almost 800 m and width of 15-60 m (Fig. 1, Table 1).
In its lower course, below the gorge, the river causes aggradation of the alluvial fan inherited from the former outflow from the Renard catchment. The low amounts of water and sediments load transported by the Tyvjobekken Stream result in periodical lack of surface inflow of the river to the fjord, and contribute to the development of a micro lagoon separated from the fjord waters with a coastal berm (12,11). B. Methods The field research was conducted at the turn of July and August 2013. The applied model of terrestrial scanner Leica ScanStation C10 provides measurement of 3D location (accuracy of 3D point location to 6 mm) at a rate of up to 50,000 points per second by means of green pulse laser with wavelength of 532 nm. The measurements covered an area of 480,000 m2, i.e. 37% of the catchment area. The measurements were performed from 24 measurement sites during three days. The predefined resolution of the survey determined the number of points. In this
62
Geomorphometry.org/2015
TABLE I.
Kociuba
PARAMETERS OF THE TYVJOBEKKEN STREAM EROSIONAL VALLEY
erosional valley parameters area length valley width / min.-max. valley bed width / min.-max. max. valley bed elev. min. valley bed elev. max. terrace elev. N/S [part] min. terrace elev. N/S [part] lifted terrace slope N/S [part] valley bed slope
direction NS part upper units 2 m 27,265.4 m 345 m m m a.s.l. m a.s.l. m a.s.l. m a.s.l. m m-1 m m-1
WE central
lower
all
97,124.3 43,209.9 167,599.6 630 200 1,175 60-102 45-175 178- 45-436 436 15-60 10-60 60-316 10-316 32.0 21.7 2.4 0.3 21.7 2.4 0.3 0.2 37.9 37.9/32.7 ---37.9 32.7 14.2/13.5 ---13.5 0.02 0.04/0.03 ---- 0.06/0.03 0.03 0.03 0.01 0.03
The denivelation between the valley floor in the area of the stream sources and its mouth to the fjord amounts to less than 32 m, and that of the dissected surfaces of the elevated marine terrace 24 m (N part) and 19 (N part), respectively. The comparison with the reference area (level of the elevated marine terrace) permitted the estimation of the volume of the erosional valley for 1,011,588 m3. The valley slopes in the zone of the gorge have a character of an erosional scarp, and are intensively modelled by mass and solifluction processes. The narrowing of the valley floor to 10 m forces the concentration of braided channels. Below the gorge zone, along approximately 200 m, the valley widens to 440 m, and its floor occupies the alluvial fan at its mouth (Fig. 1, Table 1).
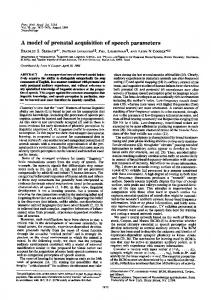
Figure 2. Digital elevation model of the lower part of the erosional valley. View on the asymmetric slopes transformed by erosional (N part) and periglacial (S part) processes (gridding method: Triangulation with Linear Interpolation, spacing: 0.1 m).
D. Final remarks and conclusions Research on modern transformations occurring in the Arctic environment increasingly focuses on the detailed morphometric characteristics of the study object. Precise 3D modelling of multiscale objects such as catchments, valley floors, and valley or slope landforms, considerably facilitates solving research problems in the dynamically changing environment of the Arctic. Traditional measurement techniques are very time-consuming. In the case of cold climate environments, they are also strenuous for the researchers. Due to the varied degree of detail of the output materials, the existing DEM models of the analysed terrain, integrating information from aerial photographs, orthophotomaps, topographic maps, geodesic measurements, or GPS, have not permitted detailed analyses of landforms at mesoand microscale so far (1, 5). TLS is a universal tool possible to replace the currently applied methods. It provides precise data for land relief modelling and the quantitative assessment of spatial and temporal changes. TLS permits better understanding of the course of processes developing small proglacial catchments (1).
The mesoscale object was constituted by the asymmetric slopes of the mouth sections of gorge valleys, typical of the valleys of this part of the Wedel Jarlsberg Land, modelled by mass (slumps, breaking, solifluction) and erosional processes. The effects of the processes are microscale objects, including shallow erosional cuts and small debris flow dissecting the N slope and solifluction terraces on the S slope. A difference by 1.6 in volume was recorded between the N part of the mouth section (185,932 m3) primarily modelled by erosional processes, and the S part (305,469 m3) particularly modelled by solifluction processes.
The TLS measurements in the Tyvjobekken Stream valley were analysed in the context of their usefulness for modelling landforms with varied size and origin. The application of TLS was evidenced to offer the possibility of multiscale analyses based on one universal DEM model. The performed detailed spatial analyses of the surface of the valley floor and slopes confirmed the high precision and efficiency of the tool. The applied strategy of measurements and high accuracy of output data provided obtaining a DEM with features permitting
63
Geomorphometry.org/2015
Kociuba
multiparameter analyses adjusted to the size and importance of the analysed objects. This allowed for detailed analyses of the morphology of the catchment area, and the determination of the volume of selected parts of the erosional valley. The relevant selection of DEM parameters permits the determination of the degree of connectivity of the slope and valley subsystems, the estimation of the volume of material deposited in the valley floor (e.g. 14,1,5), and even a detailed analysis of the geometry of small erosional forms (e.g. 1,5).
[5]
Kociuba, W., 2014. “Application of Terrestrial Laser Scanning in the assessment of the role of small debris flow in river sediment supply in the cold climate environment.” Annales UMCS B 69, 1, 79-91. [6] Kääb, A., L. Girod, and I. Berthling, 2014. “Surface kinematics of periglacial sorted circles using structure-from-motion technology.” Cryosphere, 8, 1041–1056. [7] Abbelán, A., Jaboyedoff, M., Oppikofer, T. and J.M. Vilaplana, 2009. “Detection of millimetric deformation using a terrestrial laser scanner: experiment and application to a rockfall event.” Natural Hazards and Earth System Sciences 9, 365-372 [8] Lichti, D., M. Stewart, M. Tsakiri and A. Snow, 2000. “Benchmark Testing on a Three-Dimensional Laser Scanning System”, Geomatics Research Australasia, 72, 1-235 [9] Bartoszewski, S., 1998. „Reżim odpływu rzek Ziemi Wedel Jarlsberga (Spitsbergen).” Wydawnictwo UMCS, Lublin. 167. [10] Bartoszewski, S., Chmiel, S. and Z. Michalczyk, 2013. „ Hydrography.” In: The Geographical Environment of NW Part of Wedel Jarlsberg Land (Spitsbergen, Svalbard), Edited by: Zagórski, P., Harasimiuk, M. and J. Rodzik, Wydawnictwo UMCS, Lublin, 192-211.
ACKNOWLEDGMENT The field research was conducted during the 25 th Maria CurieSklodowska University Polar Expedition. The study was supported by the scientific project of the National Science Centre 2011/01/B/ST10/06996 “Mechanisms of fluvial transport and sediment supply to channels of Arctic rivers with various hydrological regimes (SW Spitsbergen)”. The author is grateful for the field and technical assistance from Ph.D. Grzegorz Gajek and M.Sc. Lukasz Franczak.
[11] Kociuba, W. and G. Janicki, 2013. “Fluvial Processes.” In: The Geographical Environment of NW Part of Wedel Jarlsberg Land (Spitsbergen, Svalbard), Edited by: Zagórski, P., Harasimiuk, M. and J. Rodzik, Wydawnictwo UMCS, Lublin, 192-211. [12] Harasimiuk, M. and T. Król, 1992. “The dynamics of morphogenetic and sedimentary processes in the estuary segments of river valleys in the Recherche Fiord (Western Spitsbergen).” In: Spitsbergen Geographical Expeditions, Arctic natural environment problems, Edited by: RepelewskaPękalowa, J. and K. Pękala, MCSU Press, Lublin, 59–66. [13] Kociuba W., Janicki G. and J. Rodzik, 2014. „3D laser scanning as a new tool of assessment of the dynamics of development of forested loess gullies based on the example of Kolonia Celejów (Lublin Upland).” Annales UMCS B 69, 1, 107-116. [14] Bremer, M. and O. Sass, 2012. “Combining airborne and terrestrial laser scanning for quantifying erosion and deposition by a debris flow event.” Geomorphology 138, 49–60.
REFERENCES [1]
[2]
[3]
[4]
Kociuba, W., Kubisz, W. and P. Zagórski, 2014. „Use of terrestrial laser scanning (TLS) for monitoring and modelling of geomorphic processes and phenomena at a small and medium spatial scale in Polar environment (Scott River — Spitsbergen).” Geomorphology, 212, 84-96. Kenner, R., Philips, M., Danioth, C., Denier, C., Thee, P. and A. Zgraggen, 2011. “Investigation of rock and ice loss in a recently deglaciated mountain rock wall using terrestrial laser scanning: Gemsstock, Swiss Alps.” Cold Regions Science and Technology 67, 157-164. Bamber, J.L., Krabill, W., Raper, V., Dowdeswel, J.A. and J. Oerlemans, 2005. “Elevation changes measured on Svalbard glaciers and ice caps from airborne LiDAR data.” Annals of Glaciology 42, 202-208. Arnold, N.S., Ress, W.G., Devereux, B.J. and G.S. Amable, 2006. “Evaluating the potential of high resolution airborne LiDAR data in glaciology.” International Journal of Remote Sensing 27, 1233-1251.
64