Bright curvilinear features in Synthetic Aperture Radar (SAR) images arising from the geometry of urban structures have been successfully used for estimating ...
Geometry-Based SAR Curvilinear Feature Selection for Damage Detection Peter T.B. Brett and Raffaella Guida Surrey Space Centre, University of Surrey, Guildford, United Kingdom
Abstract Bright curvilinear features in Synthetic Aperture Radar (SAR) images arising from the geometry of urban structures have been successfully used for estimating urban earthquake damage, using single pre- and post-event high resolution amplitude SAR images. In this paper, further automation of the process of selecting candidate curvilinear features for change detection is proposed, based on a model selection using priors derived from idealised building geometry. The technique is demonstrated using COSMO-SkyMed data covering the 2010 Port-au-Prince earthquake.
1
Introduction
In 2008, it was reported that in the preceding two decades earthquakes had taken half a million lives and caused billions of dollars of economic damage [1]. Since then, natural disasters in Italy and China in 2009, Haiti in 2010 and Japan in 2011 have added enormously to those statistics, adding weight to the urgent need laid out by the Hyogo Framework to improve global capabilities for prompt and effective earthquake disaster response. Support for decision making by making near-real-time information available is being developed in projects such as PAGER [2] and EXTREMUM [3], using predictive modelling based on earthquake statistics and historical data. Recently, enhanced methods for urban damage assessment and mapping using real time remote sensing measurements have been introduced, enabled by very high resolution Synthetic Aperture Radar (SAR) platforms such as COSMO-SkyMed and TerraSAR-X that are able to resolve the many metre-scale features common to urban areas. As an alternative to texture-based methods [4], previous literature introduced the concept of producing damage maps by examining a single pair of SAR images, one each from before and after the event, acquired with as similar radar parameters as possible [5, 6]. In [7], the authors introduced a curvilinear feature detection step to assist in the process of identifying possible damage sites, although manual site selection and damage estimation were still required. In this paper, a high-speed, fully-automated damage detector working on the scale of individual buildings is introduced, using prior probability density functions derived from an urban building stereotype to identify suitable curvilinear features as candidate damage sites. In Section 2 of this paper, an analytical prior for the geometry of curvilinear features is outlined, and in Section 3 a classifier based on the prior is defined. Section 4 de-
ˆB e jˆ φ ˆi
b a
ˆA e
θ
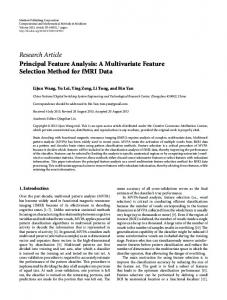
ˆ k ˆi Figure 1: Geometry of isolated building scene with distant SAR sensor, showing unit vectors and angles.
scribes a damage detection algorithm utilising this classifier. Finally, Section 5 shows some preliminary results of using the detector to locate damage caused by the 2010 Haiti earthquake.
2
Double reflection line geometry
Consider a scene containing an isolated building with a rectangular footprint of dimensions a × b, a > 0, b > 0, and smooth, vertical walls of height h, surrounded by a generic random rough surface. In the coordinate system x, y, z, the building lies above the plane z = 0, oriented at an angle 0 ≤ φ ≤ π2 to the y axis. A SAR observation is made at a look angle 0 < θ < π2 by a distant sensor travel-
0.2
θ = 35◦◦ θ = 45◦ θ = 60
0.15 p(N )
fT (t)
0.007 0.006 0.005 0.004 0.003 0.002 0.001 0
0.1 0.05
0
200
400 600 t m2
800
Figure 2: Probability density of double-reflection line internal area for image with 1 × 1 m pixels, for look angles θ = {35◦ , 45◦ , 60◦ }.
ling parallel to the y axis. This configuration is illustrated in Figure 1. The backscattering pattern of such a scene is expected to contain a bright line caused by double reflections between the rough surface and the walls of the building facing the sensor [8]. If λx is the range pixel size and λy is the azimuth pixel size in the SAR amplitude image, the projected area of the building footprint t in the image plane is a geometrical parameter that can be easily derived from the model: t = Ct · ab ,
ˆ
∞
0
1 fA u
�
t Ct u
� fA (u) du .
(2)
A Gamma prior for building length, i.e. A ∼ Γ (k, m), is a convenient choice of distribution, as it is a single-lobed one-sided distribution with variable shape and scale, and gives a closed-form density for T . With this assumption, the density of T is then a variant of the K distribution [9]:
� 2 fT (t|k, m, Ct ) =
t Ct m2
�k
0
5
� r K0 2
t Ct Γ2 (k)
t Ct m2
� , (3)
where Kα (x) is the modified Bessel function of the second kind. In this paper, a prior A ∼ Γ (4, 5) was empirically chosen as a model for medium-size buildings of mean side length 20 m. Figure 2 shows ft (t|k, m, Ct ) for double-reflection lines in images with 1 m range and azimuth pixel spacing and a variety of different look angles.
10
15 20 25 N steps
30
35
40
Figure 3: Length distribution of Rayleigh-noise induced curvilinear features. Monte-Carlo results are plotted with a solid line, and the estimated geometric density with dashes.
3
Curvilinear feature classification
The curvilinear feature detector used in this paper is the same single-scale Lindeberg ridge detector [10] as used in the authors’ previous studies [7, 11], using a scale parameter σ 2 = 8. For an N -step curvilinear feature C = {r 0 , r 1 , . . . , r N } starting at the origin (i.e. r 0 = 0), the end-to-end distance Re and radius of gyration Rg about the end-to-end axis are convenient statistics to calculate:
(1)
where Ct = λx λy sin θ. If the random variables A = a and B = b corresponding to the dimensions of the building are independent and identically distributed (i.i.d.) with density fA (a), then the density of the area random variable T = t, t > 0 is: 1 fT (t|Ct ) = Ct
0
1000
Re = kr N k ,
Rg2 =
(4)
N −1 1 X 2 kr n ∧ r N k . N Re2 n=0
(5)
The hypothesis that C arose from a double reflection line from a building conforming to the model described in Section 2 is denoted H1 . Under H1 , the corresponding projected footprint area can be estimated from curvilinear feature statistics: q e t ≈ Re · 3 Rg2 . (6) The hypothesis that C arose from speckle noise in an area of otherwise uniform backscattering intensity is denoted H0 . Speckle noise in a single-look amplitude SAR image can be modelled as i.i.d. Rayleigh-distributed noise [12]. The number of steps N in C can be considered as the number of trials required to find a location from which no further steps can be made. Assuming that each test is independent (i.e. the image is uncorrelated and the probability of C self-intersecting is small) then the distribution of N can be approximated by the geometric distribution, i.e. n−1
fN (n|ρ) = (1 − ρ)
ρ,
(7)
where (1 − ρ) is the probability of finding a next step for a feature [13].
ln
p (C|ϑ1 , H1 ) H1 p (H1 ) ≷ 0 + ln p (H0 ) p (C|ϑ0 , H0 ) H0
Azimuth
A Monte-Carlo experiment was carried out, in which the curvilinear feature detector was applied to a set of 2048 × 2048 tiles containing uncorrelated Rayleigh noise to generate 108 features. This yielded a maximum likelihood estimate ρ˜ = 0.121. Figure 3 shows the results and the corresponding model. A maximum a posteriori decision rule was used to choose between H0 and H1 for each C:
Range
(8) (a) Pre-event SAR image.
(b) Pre-event optical image.
(c) Post-event SAR image.
(d) Damage map.
where ϑ1 = {k, m, θ, λx , λy } and ϑ0 = {ρ} are the corresponding parameter sets. For the purposes of this paper, p (H1 ) was estimated to be ≈ 0.05.
Urban damage detection
The change detection algorithm used in this paper builds on the methods used in [5, 6, 7], using single, coregistered pre-event and post-event SAR amplitude images, denoted X− and X+ respectively. Curvilinear features are extracted from X− , and candidates are selected using the classifier described in Section 3. These are used to produce a pixel mask which is multiplied with the ratio image XR = X− /X+ . The resulting image is processed to produce per-pixel damage estimates on a per-building scale.
5
Figure 4: Haitian Supreme Court site. Red indicates >90% damage, yellow >75%. Optical image © GeoEye 2009. COSMO-SkyMed product © Agenzia Spaziale Italiana 2009-2010. All rights reserved.
Results
The damage detection algorithm was tested by applying it to a pair of single-look SAR amplitude images of Port-auPrince, Haiti, acquired by the COSMO-SkyMed constellation. The pre-event image was acquired on 12th December 2009, and the post-event image on 21st January 2010. Both images were acquired in high-resolution spotlight mode with a look angle θ = 38.2◦ , and the products were processed with azimuth and ground range resolutions of 1.0 m, giving Ct = 1 m−2 . The Supreme Court building, near to the National Palace, was effectively demolished by the earthquake. Figure 4 shows the results of applying the damage detector to a 256 × 256 pixel image segment centred on this site. Note the correctly-located estimates of damage ≥ 90% around the court building. A second major building affected by the earthquake was the city’s cathedral. The results of applying the detector to 256×256 segment covering this site are shown in Figure 5. Note that major damage is correctly reported on the south front of the nave and to the south transcept, but that the damage to the west face of the building is not shown due to an absence of suitable curvilinear features in that area. Note also that in the upper area of the segment, a collapsed building and several nearby intact structures are correctly distinguished.
Azimuth
4
Range (a) Pre-event SAR image.
(c) Post-event optical image.
(b) Post-event SAR image.
(d) Damage map.
Figure 5: Haitian Cathedral site. Red indicates >90% damage, yellow >75%. Optical image © GeoEye 2010. COSMO-SkyMed product © Agenzia Spaziale Italiana 2009-2010. All rights reserved.
To test the overall performance of the detector, it was applied to an 8000 × 6000 segment covering the central Portau-Prince area. The detector was run using four cores of an Intel Core i5 CPU at 2.67 GHz in 56.8 s. These results, and a comparison with ground truth data from UNOSAT, will be presented at the conference.
6
Conclusions
A fully-unsupervised SAR-based tool for mapping damaged structures in urban areas has been introduced. Selection of candidate sites is carried out using a curvilinear feature detector and analytical prior probability distributions derived from the geometry of a stereotypical scene, and the change in amplitude of chosen features is used to estimate damage levels. The lack of a requirement for detector training, and the high speed of detection even when applied to large images is beneficial for applications when a rapid result is required, such as short-term disaster response. The drawback is that the detector is based on a simple model that assumes isolated structures of a particular shape and size. The authors are currently investigating additional or alternative feature models to improve candidate site selection. In the mean time, the detector presented in this paper provides a capable method for identifying particular critically damaged structures in an urban area in the wake of an earthquake, and a useful complement to other damage estimation and mapping techniques.
Code availability The source code to the ridge detection tools used to generate the results described in this paper is available at https://github.com/peter-b/ssc-ridge-tools.
Acknowledgement The authors thank the Italian Space Agency for providing the COSMO-SkyMed SAR images used in this study. This work was supported by the UK Engineering and Physical Studies Research Council (EPSRC).
References [1] Natural catastrophes 2008: analyses, assessments, positions. Topics Geo. Munich Re Group, Munich, Germany, 2009. [2] P.S. Earle, D.J. Wald, K.S. Jaiswal, T.I. Allen, K.D. Marano, A.J. Hotovec, M.G. Hearne, and J.M. Fee. Prompt Assessment of Global Earthquakes for Response (PAGER): A system for rapidly determining the impact of global earthquakes worldwide. U.S.
Geological Survey, 2009. Open-File Report 20091131. [3] N. Frolova, V. Larionov, S. Sushchev, and A. Ugarov. EXTREMUM system for earthquake risk and loss assessment. In Conference Skopje Earthquake — 40 Years of European Earthquake Engineering, 2003. [4] F. Dell’Acqua, P. Gamba, and D.A. Polli. Earthquake damage assessment from post-event VHR radar data: From Sichuan, 2008 to Haiti, 2010. In Urban Remote Sensing Event (JURSE), 2011 Joint, pages 201 –204, april 2011. [5] R. Guida, A. Iodice, and D. Riccio. Monitoring of collapsed built-up areas with high resolution SAR images. In Geoscience and Remote Sensing Symposium (IGARSS), 2010 IEEE International, pages 2422–2425, July 2010. [6] R. Guida, A. Iodice, and D. Riccio. An application of the deterministic feature extraction approach to COSMO-SkyMed data. In Synthetic Aperture Radar (EUSAR), 2010 8th European Conference on, pages 1–4, June 2010. [7] R. Guida and P.T.B. Brett. A SAR image-based tool for prompt and effective earthquake response. In Urban Remote Sensing Event (JURSE), 2011 Joint, pages 213–216, Apr. 2011. [8] G. Franceschetti, A. Iodice, and D. Riccio. A canonical problem in electromagnetic backscattering from buildings. Geoscience and Remote Sensing, IEEE Transactions on, 40(8):1787–1801, Aug. 2002. [9] N.J. Redding. Estimating the parameters of the K distribution in the intensity domain. Technical report, DSTO Electronics and Surveillance Research Laboratory, South Australia, 1999. DSTO-TR-0839. [10] T. Lindeberg. Edge detection and ridge detection with automatic scale selection. International Journal of Computer Vision, 30(2):117–154, 1998. [11] P.T.B. Brett and R. Guida. Bright line detection in COSMO-SkyMed SAR images of urban areas. In Urban Remote Sensing Event (JURSE), 2011 Joint, pages 253–256, Apr. 2011. [12] A.C. Frery, H.-J. Muller, C.C.F. Yanasse, and S.J.S. Sant’Anna. A model for extremely heterogeneous clutter. Geoscience and Remote Sensing, IEEE Transactions on, 35(3):648–659, May 1997. [13] C. Forbes, M. Evans, N. Hastings, and B. Peacock. Statistical Distributions. John Wiley & Sons, 2011.