Bull. Soc. géol. Fr., 2006, t. 177, no 2, pp. 127-136
Volume thématique : Issues in landslide process monitoring and understanding
Geophysical data fusion by fuzzy logic for imaging the mechanical behaviour of mudslides GILLES GRANDJEAN1, JEAN-PHILIPPE MALET2, ADNAND BITRI1 and OMBELINE MÉRIC3
Key words. – Landslide, Geophysics, Tomography, Spectral analysis of surface waves, Data fusion, Fuzzy logic, Geomechanics
Abstract. – Geophysical methods such as seismic surveying or electrical resistivity imaging appear to be well adapted to investigate landslide structure and understand related mechanisms. They allow direct and non-intrusive measurements of acoustic (P), shear (S) waves velocity and electrical resistivity, three physical parameters considered as essential to define the properties of reworked moving materials. Both methods were applied at the “Super-Sauze” site, in the French South Alps, where a typical example of an intra-material mudslide can be observed. Measurements were taken simultaneously along a profile of 325 m in length, perpendicularly to the axis of the mudslide. The P and S-wave velocity fields, as well as the electrical resistivity field, were inverted from recorded data according to suitable algorithms. P and S-wave velocities as well as resistivity tomographies are presented and discussed in term of reliability. Preliminary interpreted results show a correlation between the seismic velocities and electrical resistivity data, confirming that the simultaneous use of both methods gives complementary information on the geomechanical behaviour of the landslide. The seismic data provide information on the variations of fissure density and on the presence of deformed material whereas the electrical resistivity data provide information on the variations of water content within the mudslide. In order to go deeper into the interpretation of the geomechanical behaviour of the mudslide from geophysical data, a data fusion strategy based on fuzzy subsets theory is developed. The computed fuzzy cross-sections show the possibility of geomechanical hypotheses to be realized in specific areas of the tomographic cross-sections highlighting the places where plastic or solid-body deformations could occur. This information is consistent with the geotechnical data and the borehole inclinometer measurements available for the mudslide.
Fusion de données géophysiques par logique floue pour imager le comportement géomécanique des glissements-coulées en roches argilo-marneuses
Mots clés. – Glissement de terrain, Géophysique, Tomographie, Analyse spectrale des ondes de surface, Fusion de données, Logique floue, Géomécanique
Résumé. – Les méthodes géophysiques, comme l’imagerie sismique ou électrique, sont bien adaptées à l’étude structurale des glissements de terrain et à la compréhension de leurs mécanismes internes. Elles permettent des mesures directes et non intrusives des vitesses des ondes acoustiques (P), des ondes de cisaillement (S) et de la résistivité électrique, trois paramètres considérés comme essentiels pour définir les propriétés des matériaux géologiques remobilisés. Ces deux techniques ont été appliquées sur le site de “Super-Sauze” (Alpes Françaises) qui comporte un exemple de glissement-coulée. Les mesures ont été effectuées sur un profil de 325 m de long, perpendiculaire à l’axe de la coulée. Les tomographies des champs de vitesse P et S, ainsi que la résistivité électrique, sont présentés et discutés en termes de fiabilité. Des résultats préliminaires montraient déjà des corrélations entres ces paramètres en fonction de la portion du site étudiée : les paramètres sismiques apportent des informations sur l’état de fracturation ou de déformation en cisaillement des matériaux ; la résistivité électrique apporte des informations sur l’état de saturation en eau du matériau. Afin d’aller plus loin dans les techniques d’interprétation géophysique, nous proposons une méthode de fusion des informations géophysiques basée sur la logique floue. Les nouvelles coupes, après fusion, montrent la possibilité que des hypothèses géomécaniques (déformation fragile ou plastique) se réalisent au sein de la coulée. Ces coupes restent au premier ordre en accord avec les études géotechniques réalisées sur le site. Les écarts observés pourraient être réduits par une meilleure connaissance des paramètres physiques du matériau, paramètres qui sont à la base de la construction des fonctions d’appartenance de chacune des hypothèses.
1. ‘Bureau de Recherches Géologiques et Minières’ (BRGM), Aménagement et Risques Naturels, BP 6009, F-45060 Orléans, France. Tel. + 33 (0)238 643 524 / Fax. +33 (0)238 643 361 / E-mail :
[email protected] 2. ‘Faculty of Geosciences’, UCEL, Utrecht University, Po.Box 80.115, NL-3508 TC Utrecht, Netherlands. 3. ‘Laboratoire Interdisciplinaire de Recherche Impliquant la Géologie et la Mécanique’ (LIRIGM), EA 3111 UJF, Maison des Géosciences, BP 53, F-38041 Grenoble cedex 9, France. Manuscrit déposé le 4 janvier 2006 ; accepté après révision le 20 juin 2006. Bull. Soc. géol. Fr., 2007, no 2
128
GRANDJEAN G. et al.
INTRODUCTION: STATE OF THE ART AND SCIENTIFIC ISSUES French Alps are affected by numerous active landslides located in clay-shales deposits. They are characterized by either movements occurring along discrete shearing surfaces [Brunsden and Ibsen, 1996; Hungr et al., 2001] or by continuous deformations depending on local constraints, slope gradient and subsurface material properties [Baum et al., 1998; Malet, 2003]. They are composed of heterogeneous clay-rich clastic materials, nearly saturated in water during the wet seasons. The objective of this work is to propose an original methodology for characterizing the geometry, the geomechanical behaviour and the water distribution of clay-rich landslides by analysing and combining several geophysical parameters with the Fuzzy Set theory. Non-intrusive and indirect geophysical methods such as seismic refraction and electrical resistivity imaging or electromagnetic sounding are well adapted for studying the mechanical behaviour of landslides [Jongmans and Garambois, 2007]. The interpretation of seismic travel times and electrical apparent resistivities can reveal the mechanical and hydrological properties of a terrain by the means of two physical models: the acoustic (P)-wave velocity (Vp) provides information on the state of the soil matrix; the electrical resistivity () gives indications on the porous media; the shear (S)-wave velocity (Vs) provides important information on geotechnical parameters when Spectral Analysis of Surface Waves (SASW) is used. According to previous studies [Reynolds, 2002; Godio et al., 2003; Cutlac, 2005; Grandjean, 2007], a multi-method approach is proposed to increase the level of information on the mudslide structure according the following statements: Vp and Vs are particularly sensitive to the nature of the material and to the density of fissures [Johnston and Ambos, 1994; Larsen, 1995; Brückl and Parotidis, 2000; Glade et al., 2005]; is dependent on the water content (saturation state) of the material [Lapenna et al., 2000; Park et al., 2005]. Grandjean et al. [2006] have studied the correlation between Vp and on the active “Super-Sauze” mudslide with the intention of determining whether a specific geomechanical behaviour can be characterized. The acoustic model showed a layered structure with velocities increasing with depth reflecting the increasing compaction of the strata downwards onto the marly bedrock. The electrical resistivity model showed a more complex structure with resistivity values increasing with depth but also varying laterally. This work also showed that a cross-plot between inverted Vp and values may distinguish several soil materials of different geomechanical behaviours. Referring to geomorphological observations, Grandjean et al. [2006] demonstrated also that one type of geomechanical behaviour was related to the amount of soil porosity induced by cracking and fracturing, and one another type was related to the water saturation state of the porous media. Indeed, the increase in the Vp values appeared to be related to a decrease in porosity with depth. Another noticeable variation was the high dispersion in the resistivity log data in the lowest range of velocity values corresponding to the top soil layer. This was interpreted as an effect of slope topography controlling lateral water flows in the direction of the gullies and away from the consequently dryer crests. Bull. Soc. géol. Fr., 2007, no 2
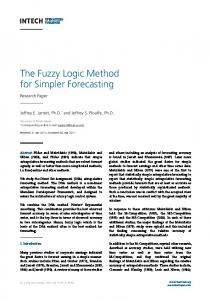
These results encouraged us to find a quantitative method able to reveal these behaviours in a more objective way. For a complete demonstration of the potentials of geophysical techniques to the understanding of clay-rich landslides, critical problems were assumed to be addressed: 1) to valorise as much as possible multi-parameters geophysical data, 2) to develop a data fusion methodology in order to define the probability that a specific type of geomechanical behaviour affects the mudslide, 3) to consider the inverted parameters’ reliability by integrating likelihood functions in the fusion process. The methodology has been applied at the “Super-Sauze” mudslide, one of the persistently active clay-rich landslides of the French South Alps. GEOMORPHOLOGY AND STRUCTURE OF THE “SUPER-SAUZE” MUDSLIDE Located in the Barcelonnette Basin (South-East French Alps) on the left bank of the River Ubaye, the “SuperSauze” mudslide (fig. 1) extends over a distance of 820 m from its highest point at an elevation of 2105 m, to its base at an elevation of 1740 m, with an average slope gradient of 25o. It covers an area of 17 hectares (fig. 1a, fig. 1b). The mudslide has developed in Callovian-Oxfordian black marls, known as “Terres Noires”, with shades varying from black to grey. The slope surface is highly irregular and affected by kinematical tension cracks and fissures of 0.5 to 1.0 m deep as well as surficial swelling/shrinking fissures. Several gullies in which weathered heterogeneous rocks and debris have accumulated (fig. 1b) incised also the mudslide. From a hydrological and geotechnical viewpoint, the mudslide is structured in two vertical units: the first unit (5 to 10 m thick) is a moderately stiff and semi-permeable material, while the second unit (with a maximum thickness of 10 m) is a stiff and impervious material [Malet and Maquaire, 2003]. Both materials involve low plasticity, intensely fissured reworked black marls with a sandy-silt matrix. The mudslide kinematics is controlled by the hydrology, and the velocities are comprised between 0.005 to 0.3 m.day-1. Deformation occurs as a consequence of the rise of a perennial groundwater table and hence the development of positive pore pressures in the moving material. Groundwater fluctuations are controlled by water infiltration both in the soil matrix and in large kinematical cracks and fractures as well as recharge from the torrents bordering the landslide [Malet et al., 2005; de Montety et al., 2007]. The “Super-Sauze” mudslide offers three scientific opportunities: 1) it is a particularly well-preserved natural site isolated from human activities; 2) it has been monitored for several years [Malet et al., 2005]; 3) it is representative of several slow-moving mudslides observed in the French Alps such as “La Valette”, “Poche”, “Boulc” or “Les Dourbes”. A multidisciplinary study, started in 1996, allowed significant advances in conceptual and hydro-mechanical analysis of the mudslide [Malet, 2003]. GEOPHYSICAL INVESTIGATIONS The studied geophysical profile was acquired along a 325 m transverse profile perpendicular to the displacement direction
GEOPHYSICAL DATA FUSION FOR IMAGING THE MECHANICAL BEHAVIOUR OF MUDSLIDES
129
FIG. 1. – Geomorphology of the “Super-Sauze” mudslide. a). Location and aerial photograph of the mudslide. The white line represents the studied geophysical profile; b). Morphology of the mudslide with gullies, cracks and topographic variations. FIG. 1. – Morphologie du glissement-coulée de “Super-Sauze”. a). Localisation et vue aérienne du glissement-coulée. La ligne blanche représente le profil géophysique étudié ; b). Morphologie de la coulée avec ravines, crevasses et variations topographiques.
of the mudslide (fig. 1a; white line). The topographic conditions have allowed to carry out geophysical measurements on the stable hillslopes bordering the mudslide. This conditioned the possibility to identify the mudslide material both in the lateral and in the vertical direction. The reliability of the geophysical tomographies representing geophysical parameters (Vp, Vs and ) was quantified by the mean of likelihood functions. The main advantage of applying such criteria for estimating the reliability of inverted models lies in the normalization of the functions. An error-model based was applied for each tomogram on Gaussian functions ranging asymptotically from 0 to 1. Some adaptations were necessary to homogenise the functions because several strategies for inverting the data were used. These adaptations are described below. Seismic P-wave tomography A total of 66 geophones (at a 5 m interval) were used for the profile. Shots were fired using a detonating cord at a 15 m interval. Data processing and inversion of the first arrival travel time were undertaken using the JaTS seismic tomography software [Grandjean and Sage, 2004]. This code uses Fresnel volumes to compute wavepaths and a Simultaneous Iterative Reconstruction Technique (SIRT), reformulated with a probabilistic approach, to estimate the P-wave velocity field. A L2 norm likelihood function is computed for each iteration to estimate the convergence of the process. Velocities in the mudslide inverted along the profile (fig. 2a) vary from 300 m.s.-1 to 2400 m.s.-1 with a three
layers model as already established from geotechnical boreholes [Malet, 2003]: a surficial layer with low velocities ranging from 300 m.s-1 to 600 m.s-1, a second layer with velocities ranging from 900 m.s-1 to 1200 m.s-1, and finally the black marl bedrock with high velocities ranging from 2100 m.s-1 to 2400 m.s-1. In order to focus the tomogram interpretations on interesting zones of the mudslide, a quantity equivalent to a correlation function has been estimated although a reliable correlation function is difficult to obtain with SIRT algorithms. The Fresnel wavepaths density plot was computed as the sum of elementary Fresnel wavepaths featuring each source-receivers pair. In addition to this spatial information, the reliability of the inverted model has been estimated by normalizing the Fresnel wavepaths density plot with the final likelihood value reached at the final iteration of the inversion process [Grandjean and Sage, 2004] and given by (Eq. 1):
L Vp
c o 2 − t − t ∑ σ N = exp 2
(Eq. 1)
where N is the number of Fresnel wavepaths, tC and t0 refer respectively to computed and observed travel times and is the a priori uncertainty on the observations. This likelihood function is supposed to represent the quantitative reliability featuring each place of the Vp tomogram (fig. 2b). Bull. Soc. géol. Fr., 2007, no 2
130
GRANDJEAN G. et al.
Electrical resistivity tomography The transverse electrical resistivity profile was obtained along the seismic profile using a Wenner array. The length of the profile reached 316 m with 80 electrodes at a 4 m interval for a total of 1026 measurements [Méric et al., 2007]. Data processing and inversion were carried out according to Loke [1994] implementing a damped least-squared GaussNewton algorithm. The inverted resistivity tomogram (fig. 2c) exhibits a strong contrast in the resistivity value at the 150 m mark corresponding to the transition between the stable eastern hillslope and the mudslide. Within the mudslide itself, the resistivity model shows a complex structure: a shallow resistive layer between 150 m and 200 m with contrasted resistivity values around 100 ⍀.m [Schmutz et al., 2000; Méric et al., 2007], a deeper punctual highly conductive anomaly located around 170m, and an underlying layer with higher resistivity values (> 100 ⍀.m). The reliability of the resistivity tomogram has been computed with the Loke’s software. The errors ε on inverted resistivity values was used to deduce the corresponding likelihood function L according to the Gauss error theory which expresses the density probability law as a function of the standard deviation of the error distribution (Eq. 2): −ε 2 1 (Eq. 2) L ρ = σ 2πϕ with ϕ( ε) = exp 2 2σ σ 2π The image of figure 2d allows to distinguish in the inverted resistivity model the parts featured with a high reliability (essentially the more conductive and surficial ones) from those poorly constrained. Due to the geometry of the array measurement, the decrease in measurements reliability with depth can be easily understood. The apparition of weak reliability zones in the conductive parts of the porous media can be explained by the possibility of the current paths to concentrate in highly conductive zones, thus increasing their density of information and consequently the reliability of the measurements. Spectral analysis of surface waves (SASW) SASW is of increasing interest in the geophysical community [Yaramanci, 2004] because it offers a non-invasive means of evaluating soil shear modulus with depth [O’Neill et al., 2003]. A large set of applications has demonstrated the potentiality of this method for geotechnical purposes [Rix et al., 2001] particularly for studying landslides or liquefaction processes [Stokoe et al., 2004]. This method can be easily implemented along linear sections to obtain a two-dimensional shear-wave velocity profile of shallow layers [Miller et al., 1999]. Before the inversion step, each seismic record needs to be transformed into a dispersion image [Park et al., 1998] from which the frequency-phase velocity curve (e.g. dispersion curve) is estimated. In laterally contrasted media, dispersion images have to be computed in a more local manner with respect to the 1D assumption required by the Levenberg-Marquardt inversion method proposed by Herrmann [2002]. To tackle this problem, the 2M-SASW technique (Multifold Multichannel SASW [Grandjean and Bitri, 2007]) has been used on the same seismic data used for (P)-wave tomography. To obtain a 2D section, the 1D shear-wave velocity profiles inverted from each local dispersion curves were interpolated along the seismic line (fig. 2e). Reliability of inverted Vs profiles Bull. Soc. géol. Fr., 2007, no 2
are directly given by the diagonal values of the correlation matrix [Herrmann, 2002] defined in the inverse problem by (Eq. 3): LVs = diag(R), with R = W-1 V (⌳2+2 I)-1 ⌳2 VT W (Eq. 3) where W is the weight matrix, V and ⌳ are defined by the singular value decomposition of the inverse generalised function G = U ⌳VT and refers to the damping factor used for the regularization. These values were at the basis of the likelihood distribution presented in figure 4b after interpolation as for the Vs profiles and represented on a 2D section. FUZZY THEORY AND PROPOSED MODELLING STRATEGY One of the particularities of geophysical data is their uncertainty and inaccuracy when they are interpreted for geological and geotechnical applications [Jongmans and Garambois, 2007]. To correctly deal with data fusion principles, correct descriptions of data and especially a quantification of their quality have to be taken into account. Useful terms to introduce the fuzzy set theory are therefore introduced below [Klir and Folger, 1988]: • uncertainty is the degree of conformity of the nature of data compared to the reality. This nature is a qualitative description related to the quantitative value and can be related to a concept that geomorphologists and geologists have identified from field observations; • inaccuracy measures the quantitative imperfection of a data value. This measure can be considered as the difference between a measurement and its prediction estimated from a probabilistic model; in that case, the imperfection is the standard deviation of the probability law; • ambiguity can be due to the above cited imperfections, and expresses the capacity of data to lead to different interpretations. The maximum of ambiguity between two solutions generally leads to a conflict that can only be reduced by adding external constraints. The typical example in the geophysical inverse problem is the non-uniqueness of the solution: from a single dataset, a ill-posed problem can generate two or more solutions with the same degree of confidence. Different mathematical tools allow data imperfection to be considered such as the probability, evidence and possibility theories. In this paper, probability theory is supposed to be known to analyze geophysical data. Therefore, only the basics of the possibility theory are exposed as a new approach to manipulate the uncertainty related to geological and geomechanical interpretations. The possibility theory has been introduced by Zadeh [1965] and fully presented by Dubois and Prade [1980] and Zimmermann [1991]. The possibility theory considers a reference space S defined in Rn, and a subset X of S defined by a belonging function (Eq. 4): 1 if x ∈ X (Eq. 4) µ( x) = 0 if x ∉ X To extend this definition for gradual belongings, the subset X is defined by (Eq. 5): (Eq. 5) {( x, µ( x)), x ∈X } and ᭙ x ∈ S, 0 ≤ µ( x) ≤ 1
GEOPHYSICAL DATA FUSION FOR IMAGING THE MECHANICAL BEHAVIOUR OF MUDSLIDES
The fuzzy sets theory indicates that intersection and union of two fuzzy sets can be defined by the minimum (min) and maximum (max) of belonging function and : (Eq. 6a) ᭙ x ∈ S, (µ ∩ ν)( x) = min[µ( x), ν( x)] and (Eq. 6b) ᭙ x ∈ S, (µ ∪ ν)( x) = max[µ( x), ν( x)] This summary is helpful to understand the possibility theory basically defined with these concepts. A possibility distribution is a function defining the belonging of each element of S for a given hypothesis, and is defined by (Eq. 7): (Eq. 7) π: S → [0,1] sup( π( x)) = 1 This condition states that at least one element of S is possible. If we consider C being a subset of S, the construction of a possibility measurement ⌸ from a possibility distribution (and the reverse) is therefore (Eq. 8): ᭙ X ∈C , Π( X ) = sup{π( x), x ∈ X} ⇔᭙ x ∈ S, π( x) = Π({x}) (Eq. 8) Finally, the combination of two possibility distributions is given by Eq. 9 where is the intersection operator:
π( x) = π 1 ⊕ π 2 =
π 1 ( x) ^ π 2 ( x) sup( π 1 ( x) ^ π 2 ( x) )
131
(Eq. 9)
In the “Super-Sauze” geophysical dataset, the problem consists in applying fusion theory to increase the amount of information from each tomography without overestimating the quality and reliability of the results. Therefore, datasets, hypotheses and meta-hypotheses are distinguished: • datasets: (P)-wave, (S)-wave velocity and the resistivity fields (fig. 2) are featured by likelihood distributions derived from the inversion codes. These likelihood data are quantitative and can be modelled by a probabilistic approach. For each point of the tomogram, the inaccuracy of inverted (P)-wave velocity, (S)-wave velocity and resistivity is described by a likelihood value; • hypotheses: hypotheses refer to several interpretations derived from the geophysical data. They are qualitative and define the possibility functions by the belonging of observed soil strata to several types of lithology or geomechanical behaviour; • meta-hypotheses: meta-hypotheses result from a fusion of the hypotheses and define the belonging of soil data to different geomechanical interpretations.
FIG. 2. – Interpretation of the geophysical tomographies. a). (P)-wave velocity tomography inverted from the seismic first arrivals; b). Vp likelihood function indicating the places where the inverted velocities are reliable (highest values); c). Electrical tomography inverted from apparent resisitivity values; d). ( likelihood function indicating the places where the inverted resistivity values are reliable (highest values); e). (S)-wave tomography inverted from SASW; f). Vs likelihood function indicating the places where the inverted velocity values are reliable (highest values). FIG. 2. – Interprétation des tomographies géophysiques. a). Tomogramme de la vitesse des ondes P inversé à partir des premières arrivées d’ondes sismiques;b). Fonction de vraisemblance associée indiquant les zones où l’estimation de la vitesse est fiable; c). Tomogramme électrique inversé à partir des valeurs de résistivité apparente; d). Fonction de vraisemblance associée indiquant les zones où l’estimation de la résistivité est fiable; e). Tomogramme de la vitesse des ondes S inversé à partir de la dispersion des ondes de surface; f). Fonction de vraisemblance associée indiquant les zones où l’estimation de la vitesse est fiable. Bull. Soc. géol. Fr., 2007, no 2
132
GRANDJEAN G. et al.
On the basis of geomorphological observations and according to the tomographies computed in the previous sections, the presence of soil strata characterized by various types of mechanical deformation or water saturation states is hypothesized. As these macro descriptions are related to the geomechanical behaviour of the mudslide, three hypotheses to describe the soil behaviour are defined. These hypotheses refer to the possibility functions expressed by Eq. 7 (fig. 3): – hypothesis h1 defines the possibility 1 of the soil strata to be densely affected by cracking due to the traction forces occurring during sliding. The density of cracking is correlated with variations of the (P)-wave velocity observed at the subsurface. From the geomorphological knowledge of the mudslide, the soil strata is respectively fissured and not fissured if the (P)-wave velocity is lower that 500 m.s-1 and greater than 1500 m.s-1. The uncertainty is assumed to be linear between these values; – hypothesis h2 defines the possibility 2 of the soil strata to be saturated by water according to the observed values of electrical resistivity. From the geomorphological knowledge of the mudslide, the soil strata is respectively
saturated and not saturated if the electrical resistivity is lower that 150 ⍀.m and greater than 300 ⍀.m. The uncertainty is assumed to be linear between these values; – hypothesis h3 defines the possibility 3 of the soil strata to be sheared due to the friction forces occurring at the slip surface. From the geomorphological knowledge of the mudslide, the soil strata is respectively sheared and not sheared if the (S)-wave velocity is lower that 500 m.s-1 and greater than 1000 m.s-1. The uncertainty is assumed to be linear between these values. The proposed strategy, based on the three above-cited hypotheses, is controlled by relationships between the geophysical parameters and the related geomechanical behaviours. These relationships were roughly estimated from petrophysical handbooks [Schön, 1996] and from correlations between tomogram values at the surface and field observations. The last information that has to be integrated are the likelihood functions. Nifle and Reynaud [2000] demonstrated that data fusion between possibility and probability functions has a mathematical sense only in the framework of evidence theory. In our case the fusion of a possibility function and a likelihood function is therefore expressed by a new function Eq. 10: (Eq. 10) π* ( x) = π(x) v(1 − L(x) ) = max( π( x),1 − L( x) ) where v is the union operator, (x) refers to possibility functions defined in Eq. 7 and L(x) refers to the distributions of the likelihood values computed for each inversion process. APPLICATION To illustrate this approach for the “Super-Sauze mudslide” a simple case is addressed for which the hypothesis h1 is estimated by computing the 1 function expressed in (Eq. 10). Reformulating the above equations according to the characteristics of the site lead to (Eq 11): π * (Vp( x, z) ) = π 1 (Vp( x, z) )v(1 − L vp ( x, z))
FIG. 3. – Possibility distributions 1, 2 and 3 corresponding to three hypotheses. a) h1:“Possibility for traction cracks”; b) h2:“Possibility for soil water saturation”; c) h3:“Possibility for soil shear bending”. FIG. 3. – Distributions de possibilité 1, 2 and 3 correspondantes à trois hypothèses. a) h1: “Possibilité de fissures de traction”; b) h2: “Possibilité de zones saturées en eau”; c) h3: “Possibilité de déformation par cisaillement”. Bull. Soc. géol. Fr., 2007, no 2
(Eq. 11) = max(π 1 (Vp( x, z) ),1 − L vp ( x, z)) where (x,z) refers to the spatial axes of the geophysical cross-sections. Figure 4 presents the results obtained after applying Eq. 11. On the one hand, figure 4c clearly shows that the possibility for the soil strata to be affected by cracks is strongly related to low Vp observations (z1). We can also note that high Vp observations on the stable hillslopes can also be considered as possibly cracked (0.4 < 1 < 0.6) in the places where the likelihood is low (LVp < 0.1; z2). On the other hand, the zone located at –20 m in the central part of the mudslide (π *1 < 0.2; z3) has a very low possibility to be cracked because Vp has increased (Vp > 2000 m.s-1) inversely to the related likelihood (LVp > 0.5). Applying Eq. 9 to the new possibility functions defined by Eq. 11 allows to fuse the three new quantities π *1 , π *2 and π *3 . These functions allow to deepen data interpretation by defining meta-hypotheses describing the geophysical crosssection in a more geotechnical way. The meta-hypotheses can be considered as arbitrary but give a connection between the quantitative approach of geophysics and the necessity for the engineering geologist to obtain an integrated diagnosis. Two meta-hypotheses have been computed:
GEOPHYSICAL DATA FUSION FOR IMAGING THE MECHANICAL BEHAVIOUR OF MUDSLIDES
133
In terms of possibility theory, this condition may be expressed by a function ⌸2 (Eq. 12b): (Eq. 12b) Π 2 = π *1 ⊕ π *2 ⊕ π *3 Figure 5 shows the results of the geophysical cross-section after computations of Eq. 12a (fig. 5a) and Eq. 12b (fig. 5b). This transformation may reveal the geomechanical behaviour of the mudslide. The H1* meta-hypothesis exclusively applies to places where cracks are present, e.g. on the surficial part of the mudslide and concerns the top layer of around 5 to 8 m thick. This geophysical layer may correspond to the topmost geotechnical unit (fig. 5a; fig. 6) subject to traction forces and characterized by a moderately stiff material; this geotechnical layer may be unsaturated in its upper part, is the most active zone of the landslide and is therefore characterized by a high density of cracks. Figure 6 represents the geotechnical profile of the mudslide deduced from extensive geotechnical investigation, geophysical H/V seismic noise measurements [Méric et al., 2007] and from an interpretation of the vertical velocity profile deduced from borehole inclinometer monitoring in the upper and medium parts of the landslide [Malet and Maquaire, 2003]. Interpretation of inclinometer measurements shows an internal slip surface separating the topmost active unit from the
FIG. 4. – Interpretation of the seismic tomography. a) P-wave velocity tomogram; b) likelihood function of P-wave velocity computed from Fresnel wavepath density plot and the likelihood value reached at the final iteration of the SIRT; c) result of the fusion (π*1 ) between a) and b): z1, z2 and z3 refer to the three items discussed in the text. FIG. 4. – Interprétation des tomogrammes sismiques. a) tomogramme de la vitesse des ondes P; b) vraisemblance de la vitesse des ondes P calculée à partir de la densité des volumes de Fresnel et de la valeur de vraisemblance à la dernière itération; c) résultat de la fusion (π*1 ) entre a) et b): z1, z2 et z3 font référence à la discussion détaillée dans le texte.
– meta-hypothesis H1* defines the possibility for the material to be characterized by a rigid mechanical behaviour. This case is ideally realized if the material is supposed to exhibit a low water saturation state and to be cracked by traction forces but not by shear forces. In terms of possibility theory, this condition may be expressed by a function ⌸2 (Eq. 12a): Π 1 = π *1 ⊕ π *2 ⊕ π *3
(Eq. 12a) H *2
– meta-hypothesis defines the possibility for the mudslide material to be characterized by a plastic mechanical behaviour. This case should be realized if the material is supposed to have been subjected to shear forces but not to traction forces and to have a high degree of water saturation.
FIG. 5 – Possibility distributions (⌸1 and ⌸2) for a) the meta-hypothesis ( H *1 ) “solid-state behaviour”; b) the meta-hypothesis (H *2 ) “plastic-state behaviour”. FIG. 5 – Distributions de possibilité ( 1 et 2) se référant a) à la méta-hypothèse (H *1 ) “comportement fragile” ; b) à la méta-hypothèse (H *2 )“comportement plastique”. Bull. Soc. géol. Fr., 2007, no 2
134
GRANDJEAN G. et al.
lowermost stable unit at a depth of around 8 to 10 m. This depth could correspond to the bottom of the cracked layer revealed by the geophysical ⌸1 cross-section. The H *2 meta-hypothesis concerns a layer of around 5 to 10 m thick and located at around 10 m depth. This zone may correspond to the lowermost geotechnical unit of stiff and impervious material; this geotechnical layer is densely compacted and therefore not affected by cracking. The relatively blurred shape of this geophysical anomaly may be in relation with the decreasing velocities of the mudslide measured from 5 to 10 m depth (fig. 6b). A place located on the eastern hillslope flank, at the surface, has also a high ⌸2 value. This does not seem to be correlated to any field observations since the hillslope flanks are generally composed of bedrock black marls exhibiting a solid-body mechanical behaviour. Unprocessed resistivity tomogram data indicate that this anomaly can be related to high (P)-wave velocities (1800 m.s-1), very high electrical resistivities (400 ⍀.m) and relatively low (S)-wave velocities (600 m.s-1) (fig. 2). Likelihood functions are important to understand this phenomenon because they modify the impacts of geophysical
parameters on the meta-hypothesis functions by conferring to the Vs a very high weight around this anomaly. Consequently, the main factor impacting H *2 at this place is the presence of supposed clay material, which has a strong influence on the ⌸2 values. This explanation shows how unconstrained data can favour unrealistic hypotheses leading to possible evidence of meta-hypotheses in places where they are not supposed to be.
CONCLUSION An approach based on seismic velocity and electrical resistivity measurements has been developed for revealing the mechanical properties of clay-rich landslides: the acoustic (P)-wave velocity (Vp) provides information on the state of compaction of the layers; the electrical resistivity () gives indications on the water content variations; the shear (S)-wave velocity (Vs) provides important information on the lithology by the mean of the Spectral Analysis of Surface Waves (SASW). Geophysical tomography techniques
FIG. 6. – Geomechanical behaviour of the mudslide a) Longitudinal geotechnical profile of the mudslide interpreted from borehole data, inclinometer measurements (EP8, F1 and IC1 boreholes) and seismic noise H/V measurements; b) Example of inclinometric measurements at F1 borehole. The velocity profile materializes respectively the potential solid–state (rigid body, active unit) and plastic-state behaviours (“dead body”) of the mudslide. FIG. 6. – Comportement géomécanique du glissement-coulée. a). Profil géotechnique longitudinal réalisé à partir des donnée de sondages, des données inclinomètriques EP8, F1 et IC1 et des sondages H/V. b). Exemple de mesure inclinomètrique au sondage F1. Le profil de vitesse matérialise les possibilités de déformation rigide de l’unité active et plastique du “corps mort”. Bull. Soc. géol. Fr., 2007, no 2
GEOPHYSICAL DATA FUSION FOR IMAGING THE MECHANICAL BEHAVIOUR OF MUDSLIDES
are used to represent these parameters on a 2D cross-section. To valorise as much as possible the field data, a data fusion process of the three geophysical parameters is proposed in order to verify the possibility of some geomechanical hypotheses on the behaviour of the mudslide. Inverted parameters reliability is taken into account by integrating likelihood functions in the fusion process. The H1* meta- hypothesis exclusively applies in places where tension cracks are present, e.g. on the topmost part of the mudslide and concerns a layer from around 5 to 10 m thick and characterized by a rigid behaviour; the H *2 meta-hypothesis occurs below this subsurface zone and concerns a layer of around 5 to 10 m thick located at around 10 m depth and characterized by a plastic behaviour. Data fusion and fuzzy set theory are efficient tools for interpreting geophysical tomograms and for proposing hypotheses on the geomechanical behaviour of materials as well as on the mechanisms of deformation. Especially, Fuzzy Set theory constitutes a more objective multi-parameter interpretation method than the methods classically used in geophysical interpretation. The integration of likelihood functions in the fusion guarantees that only reliable data are considered. However, the different inversion and reconstruction algorithms used for computing geophysical tomograms gives different ways (resolution matrix, error distribution, wavepaths density) for considering the reliability of the inverted model. Efforts have to be made for homogenising these different
135
quantities. Implementing a unique inversion method to estimate the geophysical parameters constitutes a perspective. Another perspective consists in finding more constrained belonging functions to affine the relationship between geophysical parameters and the geomechanical state of the soil material. In particular, recent results obtained in petroleum industry for inverting rock properties from seismic attributes have to be taken into account. This kind of studies [Chen et al., 1998] shows for example that the presence of fluids in the porous space can alter the (S)-wave velocity or the Vp/Vs ratio [Castagna et al., 1985]. Other studies present interesting results where the high density of cracks can decreases the (P)-wave but also the (S)-wave velocity. This could explain for example that the algorithm went into a pitfall on the stable hillslopes and found a plastic-state behaviour where it is not supposed to be. Our approach constitutes a first demonstration and needs some improvements on this topic. This issue will be tackled by considering additional works in the petrophysic of clastic clay-rich rocks and will constitute the next step in our developments. Acknowledgements. – Support of this work was partially provided by the French National Institute for Universe Sciences (INSU) in the framework of the ‘ACI – Prévention des Catastrophes Naturelles’ Program (Project SAMOA) and by the Research Direction of ‘Bureau de Recherches Géologiques et Minières’ (BRGM). The authors are grateful to two anonymous reviewers for their improvements of the manuscript.
References
AMITRANO D., GAFFET S., MALET J.P. & MAQUAIRE O. – Understanding mudslides through micro-seismic monitoring: the Super-Sauze (southeast French Alps) case study. – Bull. Soc. géol. Fr., 178, 2, 149-157. BAUM R.L., MESSERICH J. & FLEMING R.W. (1998). – Surface deformation of slow-moving, clay-rich landslides, Honolulu, Hawaii. – Env. Eng. Geoscience, 4, 283-306. BRÜCKL E. & PAROTIDIS M. (2000). – Seismic velocities of large rockslide masses. In: Proc. 62nd Europ. Ass. Geoscientists & Eng Conf. & Tech. Exhibition., Glasgow, Scotland. BRUNSDEN D. & IBSEN M.-L. (1996). – Mudslide. In: Landslide recognition: identification, movement and causes. – Wiley, Chichester, United Kingdom, 103-119. CASTAGNA J. P., BATZLE M. L. & EASTWOOD R. L. (1985). – Relationships between compressional-wave and shear-wave velocities in elastic silicate rocks. – Geophysics, 50, 571-581. CHEN T., GOODWAY W., ZHANG W., POTOCKI D., USWAK G., CALOW B. & GRAY D. (1998). – Integrating geophysics, geology and petrophysics: A 3D seismic AVO and borehole/logging case study. – Ann. Int. Mtg., SEG. Ext. Abstr., 615-618. CUTLAC O. (2005). – Multi-method geophysical surveys for the study of Holocene landslide deposits. In: Proc. EGS-AGU-EUG Joint Assembly, New Orleans, USA. – Ext. Abstr. NS23B-08. DE MONTETY V., MARC V., EMBLANCH C., MALET J.-P., BERTRAND C., MAQUAIRE O. & B OGAARD T.A. (2007). – Identifying origin of groundwater and flow processes in complex landslides affecting black marls: insights from an hydrochemistry survey. – Earth Surf. Proc. and Landforms (in press). DUBOIS D. & PRADE H. (1980). – Fuzzy sets and systems: theory and applications. – Academic Press, New York, 224 p.
GLADE T., STARK P. & DIKAU R. (2005). – Determination of potential landslide shear plane depth using seismic refraction. A case study in Rheinhessen, Germany. – Bull. Eng. Geol. Environ., 64, 151-158. GODIO A., DE BACCO G. & STROBBIA C. (2003). – Geophysical characterisation of a rockslide in an alpine region. – Proc. EGS-AGU-EUG Joint Assembly, Nice, France, Vol. 5, 12480. GRANDJEAN G. & BITRI A. (2007). – 2M-SASW: multifold multichannels seismic inversion of local dispersion of Rayleigh wave in laterally heterogeneous subsurfaces: application to the Super-Sauze mudslide (France). – Near Surf. Geophys. (submitted). GRANDJEAN G. (2007). – A seismic multi-approach method for characterizing contaminated sites. – J. Applied Geophys. (in press). GRANDJEAN G., BITRI A, PENNETIER C., MERIC O. & MALET J.-P. (2006). – Caractérisation de la structure interne et de l’état hydrique de glissements argilo-marneux par tomographie géophysique : l’exemple du glissement-coulée de Super-Sauze. – C. R. Acad. Sci., 338, 587-595. GRANDJEAN G. & SAGE S. (2004). – JaTS: a fully portable seismic tomography software based on Fresnel wavepaths and a probabilistic reconstruction approach. – Comp. & Geosciences, 30, 925-935. HERRMANN R.B. (2002). – Computer programs in seismology. – Department of Earth and Atmospheric Sciences, Saint Louis University, USA. HUNGR O., EVANS S.G., BOVIS M.J. & HUTCHINSON J.N. (2001). – A review of the classification of landslides of the flow type. – Environ. Eng. Geoscience, 7, 221-238. JOHNSTON J.J. & AMBOS E.L. (1994). – Three-dimensional landslide structure from seismic refraction data analysis: A case study from Blind Canyon, northern Santa Ana Mountains, California. – SEG, Tech. Program, Ext. Abstr., 799-801. Bull. Soc. géol. Fr., 2007, no 2
136
GRANDJEAN G. et al.
JONGMANS D. & GARAMBOIS S. (2007). – Geophysical investigation of landslides: a review. – Bull. Soc. géol. Fr., 178, 2, 101-112. KLIR G.J. & FOLGER T.A. (1988). – Fuzzy sets, uncertainty and information. – Prentice Hall, Englewood, Cliffs, USA, 257 p. LAPENNA V., PERRONE A., PIETRO L., PISCITELLI S., RIZZO E. & SDAO F. (2000). – 2D resistivity and 3D self-potential tomographies in the study of the Giarrossa landslide (southern Italy). – Proc. EEGS-ES, Bochum, Germany, EL-0314. LARSEN M.C. (1995). – Use of seismic refraction techniques for investigating recent landslides in a tropical rain forest in Puerto Rico. In: Energy and mineral potential of the Central American-Caribbean regions. – Springer-Verlag, Berlin, 411-414. LOKE M.H. (1994). – The inversion of two-dimensional resistivity data. – PhD Thesis, Univ. of Birmingham, Birmingham, United Kingdom, 122 p. MALET J.-P. (2003). – Les “glissements de type écoulement” dans les marnes noires des Alpes du Sud. Morphologie, fonctionnement et modélisation hydro-mécanique. – Thèse de Doctorat, Univ. Louis Pasteur, Strasbourg I, France, 394 p. MALET J.-P. & MAQUAIRE O. (2003). – Black marl earthflows mobility and long-term seasonal dynamic in southeastern France. In: Proc.1st Int. Conf. on Fast Slope Movements, Naples, Italy. – Patron Editore, Bologna, 333-340. MALET J.-P., VAN ASCH TH.W.J., VAN BEEK L.P.H. & MAQUAIRE O. (2005). – Forecasting the behavior of complex landslides with a 2-5D spatially distributed hydrological model. – Nat. Haz. and Earth Sys. Sc., 5, 1-15. MAQUAIRE O., MALET J.-P., REMAÎTRE A., LOCAT J., KLOTZ S. & GUILLON, J. (2003). – Instability conditions of marly hillslopes, towards landsliding or gullying? The case of the Barcelonnette Basin, southeast France. – Eng. Geol., 70, 109-130. MÉRIC O., GARAMBOIS S., MALET J.-P., CADET H., GUÉGUEN P. & JONGMANS , D. (2007). – Seismic noise-based methods for soft-rock landslide characterization. – Bull. Soc. géol. Fr., 178, 2, 137-148. MILLER R.D., XIA J., PARK C.B. & IVANOV J. (1999). – Multichannel analysis of surfaces waves to map bedrock. – Leading Edge, 18, 1392-1396. NIFLE A. & REYNAUD R. (2000). – Double representation of information and hybrid combination for identification systems. – Proc. 3rd Int. Conf. on Information Fusion, Paris France, Vol. 1, 23-30.
Bull. Soc. géol. Fr., 2007, no 2
O’NEILL A., DENTITH M. & LIST R. (2003). – Full-waveform P-SV reflectivity inversion of surface waves for shallow engineering applications. – Expl. Geophys., 34, 158–173. PARK C.B., MILLER R.D. & XIA J. (1998). – Imaging dispersion curves of surface waves on multi-channel record. – SEG Ext. Abstr., New Orleans, USA, SEG Ed., 1377-1380. PARK S.G., ASANO S., MATSUURA S., OKAMOTO T. & KIM J.H. (2005). – Geoelectrical laboratory and field studies of groundwater occurrence in a landslide area: a case study from Japan. – Expl. Geophys., 36, 86-91. REYNOLDS J.M. (2002). – Application of geophysics to landslide investigations. – In: Landslides and landslide management in North Wales. – The National Museums and Galleries of Wales, Cardiff, 28-30. RIX G.J., LAI C.G. & FOTI S. (2001). – Simultaneous measurement of surface wave dispersion and attenuation curves. – Geotech. Test. J., 24, 350-358. SCHMUTZ M., ALBOUY Y., GUÉRIN R., MAQUAIRE O., VASSAL J., SCHOTT J.-J. & DESCLOÎTRES M. (2000). – Joint electrical and time domain electromagnetism (TDEM) data inversion applied to the Super-Sauze mudslide (France). – Surveys in Geophys., 21, 371-390. SCHÖN J.H. (1996). – Physical properties of rocks. Fundamentals and principles of petrophysics. – Handbook of geophysical exploration: Seismic exploration, 18. – Pergamon, Oxford, United Kingdom, 583 p. STOKOE K.H., RATHJE E.M., WILSON C.R., ROSENBLAD B.L. & MENQ F.-Y. (2004). – Development of the NEES large-scale mobile shakers and associated instrumentation for in situ evaluation of nonlinear characteristics and liquefaction resistance of soils. – Proc. 13th World Conf. on Earth. Eng., Vancouver, Canada, Univ. Vancouver, 331-335. YARAMANCI U. (2004). – Seismic surface waves in near surface geophysics. – First Break, Nov. 2004, 4-6. ZADEH L.A. (1965). – Fuzzy sets. – Inform. and Control, 8, 338-353. ZIMMERMANN H.J. (1991). – Fuzzy sets and its applications. – Kluwer, Boston, USA, 544 p.