Geosocial Search: Finding Places based on Geotagged Social-Media Posts Barak Pat
Yaron Kanza
Mor Naaman
Technion – Israel Institute of Technology, Haifa Israel
Jacobs Institute, Cornell Tech, New York, USA
Jacobs Institute, Cornell Tech, New York, USA
[email protected]
[email protected]
ABSTRACT Geographic search—where the user provides keywords and receives relevant locations depicted on a map—is a popular web application. Typically, such search is based on static geographic data. However, the abundant geotagged posts in microblogs such as Twitter and in social networks like Instagram, provide contemporary information that can be used to support geosocial search—geographic search based on user activities in social media. Such search can point out where people talk (or tweet) about different topics. For example, the search results may show where people refer to “jogging”, to indicate popular jogging places. The difficulty in implementing such search is that there is no natural partition of the space into “documents” as in ordinary web search. Thus, it is not always clear how to present results and how to rank and filter results effectively. In this paper, we demonstrate a two-step process of first, quickly finding the relevant areas by using an arbitrary indexed partition of the space, and secondly, applying clustering on discovered areas, to present more accurate results. We introduce a system that utilizes geotagged posts in geographic search and illustrate how different ranking methods can be used, based on the proposed two-step search process. The system demonstrates the effectiveness and usefulness of the approach.
Categories and Subject Descriptors H.3.5 [Information Storage and Retrieval]: Online Information Services—Web-based services
Keywords Geographic search, geosocial, socio-spatial, geo-tagged tweets, social media, microblog, local search
1.
INTRODUCTION
In online social networks and microblogging applications, such as Instagram and Twitter, users frequently publish geotagged posts. In such posts, textual content is associated
Copyright is held by the International World Wide Web Conference Committee (IW3C2). IW3C2 reserves the right to provide a hyperlink to the author’s site if the Material is used in electronic media. WWW ’15, May 18–22, 2015, Florence, Italy. ACM 978-1-4503-3473-0/15/05. http://dx.doi.org/10.1145/2740908.2742847
[email protected]
with a location, hence, large sets of geotagged posts provide up-to-date information regarding where specific terms are commonly mentioned. Such data can be used for geosocial search, to find locations with associated search terms. The results of a geosocial search reflect term usage in different locations. For well known geographical entities with a distinct name, such as “Highline” (see Fig. 1) or “Bryant Park”, in New York City, there are many posts containing these terms in the location of the entity. Thus, such searches can accurately indicate the entity on a map, and they provide indication to the validity of the approach. There are, however, other types of search that do not refer to a specific entity. A search for “jogging”, for example, can indicate good jogging places (see Fig. 2). A search for “sunset” helps finding popular sunset viewpoints (see Fig. 3). A search for “Empire State Building” indicates not just the location of the building but also popular locations from which there is a good view of the building. Some searches are essentially abstract, e.g. a search for “romantic walk”, in the sense that the search is about how people feel in a place or what they say about the place and not about a geographical property of the entity. Another example is of a search for “overpriced” and it is interesting to see not only where this term is being used but also with which other terms it appears, to know what is overpriced. The examples above demonstrate that a geosocial search is different from traditional geographical search and it has a merit of its own—not as a replacement of ordinary search but as a tool for researchers, tourists and even for local residents who want to discover places associated with given terms. In a search it is essential to provide results instantly. Thus, to deal with large amounts of data, an index should be used. This causes one of the difficulties in implementing a geosocial search—there are no “documents” or other natural logical atomic units to be indexed and ranked. On the one hand, without such units, we cannot build and use an inverted index. On the other hand, defining such units by partitioning the indexed area arbitrarily raises the concern that the partition will affect the result in an unpredicted way by returning areas that are too big or too small. In this paper we present a search system that copes with the lack of documents by partitioning the area into cells and indexing the cells. In a search, relevant cells are retrieved. Then, posts in these cells and their surrounding are clustered, and the boundaries of the clusters are presented, to provide more accurate results. Our system demonstrates that this approach is effective—results are retrieved fast over millions of messages, with good accuracy.
Figure 1: The user interface, in a search for “highline”
Figure 2: “Jogging” places
Figure 3: “Sunset” viewpoints
how to visualize representative tags on a map. The Livehoods project [3] used geo-tagged posts to find boundaries between neighborhoods. Neighborhoodbuzz1 presents popular terms in specified locations. Note that they find popular terms for given locations while we search for locations for given terms. For a study of the correlation between locations and content in microblogs see [6]. The MapD 2 system and TweetMap3 (which is built on top of MapD) provide search capabilities over geotagged tweets, however, these systems employ a “brute-force approach” and require a huge computation power while our system can run on an ordinary computer. Furthermore, they only present relevant tweets on a map and do not apply ranking or a search for relevant areas.
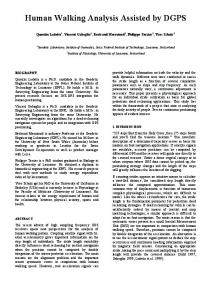
3. Figure 4: The top 10 most frequent keywords in a search for “lion”, in different areas
Another challenging issue is how to rank and filter results. A common approach is to use a heat map [9]. However, a heat map is different from ranking and it does not find relevant places—it mainly shows the activity level in different places and not the percentage of relevant posts in these places. We, in comparison, implemented three different ranking methods and our system allows users to examine the effect of these different ranking methods on the result.
2.
RELATED WORK
Recently, there has been a growing interest in search based on social-media data. Some systems used only the textual content of posts, e.g. [8]. Other systems utilized only locations of posts in their search. Ferrari et al. [5] and Xia et al. [10] showed how to detect hotspots and hyper-local events in a city, based on Twitter posts. A data model for combining social data and spatial data was proposed in [4]. Several projects considered locations and textual content combined. Kling et al. [7] showed how to classify posts into urban topics related to various activities. Ahern et al. [1] analyzed textual tags of geo-referenced photos and showed
GEOSOCIAL SEARCH
We elaborate now on geosocial search. In geosocial search, the user inserts search terms and sees the results depicted on a map. In our system, the search area is partitioned into cells and there are two retrieval steps—a step of retrieving relevant cells and a step of presenting more precise polygonal areas, as search results. The system provides the ability to see the cells discovered in the first step of the retrieval, depicted in red, the areas discovered in the second step, depicted in blue, or both the cells and the polygonal areas. See a screenshot of the system in Fig. 1. The system provides the capability of advanced search where the user can limit the search to return only posts sent during hours of the day, e.g. to compare good jogging places during daylight time with good jogging places during the night. The system also provides the capability of limiting the search to certain days of the week, e.g., to limit the search to posts sent during weekends. The system employs three ranking methods, namely Global Ratio, Local Ratio and Harmonic Mean. The user interface allows changing the upper and lower thresholds, for each ranking method, to control the presentation by adding or discarding results. 1
http://neighborhoodbuzz.knightlab.com/ http://mapd.csail.mit.edu 3 http://worldmap.harvard.edu/tweetmap/ 2
We now elaborate on these ranking scores. Consider posts where each post has a location and a textual content. The area of the search is partitioned into cells and each post is associated with the cell containing it. A search query q is a list of search terms. We refer to a post that contains the search terms q as relevant post. • Global ratio: To each cell we assign a score which is the ratio of the number of relevant posts in the cell to the total number of relevant posts in the repository. • Local ratio: To each cell we assign a score which is the ratio of the relevant posts in the cell to the number of all posts in the cell. • Harmonic mean: To each cell we assign the harmonic mean of the local ratio and the global ratio. The global ratio gives high scores to places with many relevant posts, and thus it prefers places in which there is high activity. This may be desired in some cases, but may fail to find relevant places with low activity. The local ratio finds places in which the percentage of relevant posts is high. This approach is useful to find relevant placed even if their activity level is low, but it may give low scores to highly popular places. We, thus, also apply a ranking which is the harmonic mean of the local ratio and the global ratio. Our system allows changing the upper threshold and the lower threshold, for each one of the ranking methods, to test the effect of the ranking on the result. When viewing the results, the user can click on the presented areas to see the ten most frequent terms, in relevant posts, in the clicked area. The user can also view a small sample of ten relevant tweets in that area. For example, Fig. 4 presents the frequent keywords in places returned by a search query “Lion”. In one place the frequent words are “King” and “Broadway” so this place relates to the Lion King Broadway show. In the other place the frequent terms are “Sea” and “Zoo” so this place relates to sea lions in a zoo. Evidently, the frequent words may help users understand the nature of the discovered places.
4.
SYSTEM ARCHITECTURE
The system is designed as a client-server web application. The client (front-end) is an interactive web application that allows users to pose queries and define constraints. It visually presents the results on a map. We use the Google Maps API for presenting discovered places on a map, and by using Ajax, the client can present results gradually. See an illustration of the front end in Fig. 1. The back-end tier is responsible for the indexing of posts and for processing search queries. The system architecture is presented in Fig. 5. Next we elaborate on the components of the system.
4.1
Dataset
The dataset currently indexed by the system comprises 45 million geotagged tweets and Instagram posts. These posts are all in the area of New York City and were collected as part of the CityBeat project [10]. In our system, indexing the data took about 2 hours, hence, indexing can be done frequently, say every several days, to reflect recent changes.
Figure 5: System architecture
4.2
Back End
Given a search query, the back-end module finds the relevant areas and sends the results to the client, in GeoJSON format (see http://geojson.org/). The back-end is built on top of an Apache Tomcat server and it uses the Apache Lucene engine. Lucene provides an inverted index that is used for efficient retrieval of relevant posts. Thus, our contribution is of showing how to use the inverted index effectively for geosocial search. Before indexing the posts, the system partitions the entire search area into cells, to form a grid. Each cell has height of 350 meters and width of 250 meters, however, this is configurable and can be changed. The cells are numbered. Each post is associated with the cell in which its geotag is located, and has a unique identifier (post-id) that comprises the cell number and its number within the cell. Hence, when given a post-id we can immediately know in which cell this post is. There is an additional index that allows retrieving posts by their post-id. In the inverted index there is an entry for each term with a pointer to a list of posts containing that term. The lists are sorted by post-id, so based on the way post-ids were defined, the posts in each list are sorted according to the cell number. Within a cell, the posts are sorted by their number in the cell. Thus, we can process a query cell by cell. The system also stores for each cell the number of posts in the cell, for the computation of the local ratio. Given a search query, the retrieval process is by computing the local ratio and global ratio for the cells. The initial step is to determine which posts are relevant, for the given query. Note, however, that our goal is to find relevant areas, not to retrieve the most relevant posts.
4.2.1
Computing Relevant Cells
Using the inverted index, the system counts for each cell the relevant posts, by intersecting the lists of posts of the
query terms. For example, given a query “Central Park”, the index is used to get to the list of “Central” and the list of “Park”. It gets the posts with “Central”, from the first list, and the posts of “Park” from the second list. The intersection of these lists provides a list L of posts referring to “Central” and “Park”. Note that L is sorted by post-id and hence sorted by cells. A naive approach to find how many posts of L there are in each cell is by a linear scan over L. However, L can be a long list. So, we apply a more efficient search, as follows. The system conducts a binary search over L to find where in L end the posts of Cell 1 and start the posts of Cell 2. Then, it applies a binary search to find where in L end the posts of Cell 2 and start the posts of Cell 3, and so on. In each search, it uses the information from the previous searches. For L of size N and k cells, the complexity of such ), instead of the O(N ) complexity of a search is O(k log N k linear scan of L. This allows the system to know how many relevant posts there are in each cell, to compute the local ratio and the global ratio of each cell. To support selection of posts according to time constraints, we apply the specified time constraints as filtering conditions when traversing the lists. The times of posts and the constraints are translated to numerical values, to improve the efficiency of the filtering action. In the retrieval, cells with less than 5 relevant posts are ignored to reduce noise (this is a configurable parameter of the system). After computing the global ratio, local ratio and harmonic mean for the cells, the system needs to choose which cells to initially present to the user. (The user can view additional results by changing the sliders, afterwords.) To do so, the set T of 10 cells with the highest score is selected, for each one of the three measures. However, there may be big differences in the scores among these 10 selected cells. So, we apply the following approach. We compute the sum of scores of the 10 selected cells of T . Then, we select the top cells among the cells of T whose sum exceeds 80% of the sum of scores. For example, suppose the sum of scores is 100 and the first cell has a score of 82. Then we return just this cell because by itself its score already exceeds 80% of the sum of scores. If the 4 top scores are 35, 28, 22, 10 then the cells with scores 35, 28, 22 are selected because their scores exceed 80% of the sum of scores. This reduces “noise” caused by cells with relatively low scores. Note that by combining selected cells from all three methods we present results from areas with different levels of activity.
4.2.2
Computing Relevant Areas
After finding the relevant cells, the next task is the clustering of messages to present results with higher accuracy and finer granularity than that of the grid. Intuitively, the result area should be as small as possible but with as many relevant posts as possible. The computation is by applying the following steps. First, adjacent cells are merged to create cell groups. This is somewhat similar to bottom-up hierarchical clustering of cells. Secondly, for each group of cells, the system applies the OPTICS clustering algorithm [2] over the posts of these cells. If there are much too many posts in the cells, the algorithm is applied over a uniform repeatable sample of the messages. The algorithm receives two parameters—MinPts, which we set to 4, and ε which we took to be the length of a cell divided by the square root of the number of posts in the most dense cell in the group
(to reflect the relative distance between points in this cell). OPTICS creates a hierarchy of clusters, so the third step is to choose among the clusters of the hierarchy the set of of messages in clusters . (Clusclusters that maximize √Number Area·(log number of clusters+1) ters whose area is too small are ignored, to prevent noise.) By that, we try to maximize the total number of clustered messages, while minimizing the overall area of the clusters and the number of clusters.
5.
DEMONSTRATION
Our demonstration illustrates geosocial search over 45 million posts in the area of New York City. A video of different searches using the system is available via the following link: https://www.youtube.com/watch?v=LZJeLhZ3h90. In this video, the search system (the back-end) is deployed on an Amazon Web Service (AWS) server with 15GB of main memory and 8 cores, using a Linux 14.04 Ubuntu operating system. We show how the system can provide relevant information easily, efficiently and accurately. We demonstrate different types of search, the effect of temporal filters and the effect of different ranking methods on the search results.
6.
ACKNOWLEDGMENTS
This research was supported in part by the Israel Science Foundation (Grant 1467/13), by the Israeli Ministry of Science and Technology (Grant 3-9617) and by the National Science Foundation CAREER award 1446374.
7.
REFERENCES
[1] S. Ahern, M. Naaman, R. Nair, and J. H.-I. Yang. World explorer: Visualizing aggregate data from unstructured text in geo-referenced collections. In Proc. of JCDL, 2007. [2] M. Ankerst, M. M. Breunig, H.-P. Kriegel, and J. Sander. Optics: Ordering points to identify the clustering structure. ACM Sigmod Record, 28(2), 1999. [3] J. Cranshaw, R. Schwartz, J. I. Hong, and N. M. Sadeh. The livehoods project: Utilizing social media to understand the dynamics of a city. In ICWSM, 2012. [4] Y. Doytsher, B. Galon, and Y. Kanza. Querying geo-social data by bridging spatial networks and social networks. In Proc. of 2nd ACM LBSN, 2010. [5] L. Ferrari, A. Rosi, M. Mamei, and F. Zambonelli. Extracting urban patterns from location-based social networks. In Proc. of the 3rd ACM LBSN, 2011. [6] I. Grabovitch-Zuyev, Y. Kanza, E. Kravi, and B. Pat. On the correlation between textual content and geospatial locations in microblogs. In GeoRich, 2014. [7] F. Kling and A. Pozdnoukhov. When a city tells a story: Urban topic analysis. In SIGSPATIAL, 2012. [8] B. O’Connor, M. Krieger, and D. Ahn. Tweetmotif: Exploratory search and topic summarization for twitter. In ICWSM, 2010. [9] I. Weber and V. R. K. Garimella. Visualizing user-defined, discriminative geo-temporal twitter activity. In ICWSM, 2014. [10] C. Xia, R. Schwartz, K. E. Xie, A. Krebs, A. Langdon, J. Ting, and M. Naaman. CityBeat: real-time social media visualization of hyper-local city data. In Proc. of WWW Conference, 2014.