3D motion capture data: motion analysis and mapping to music Frédéric Bevilacqua
Jeff Ridenour
David J. Cuccia
Beckman Laser Institute, University of California, Irvine + 1-949-824 4104
Information and Computer Science University of California, Irvine +1-949-854-7473
Beckman Laser Institute, University of California, Irvine
[email protected]
[email protected]
ABSTRACT We report research performed on gesture analysis and mapping to music. Various movements were recorded using 3D optical motion capture. Using this system, we produced animations from movements/dance, and generate in parallel the soundtrack from the dancer's movements. Prior to the actual sound mapping process, we performed various motion analyses. We present here two methods, both independent of specific orientation or location of the subject. The first deals with gestural segmentation, while the second uses pattern recognition.
Keywords motion capture, mapping sound to gesture, gesture recognition
[email protected]
designing the interface between gesture and/or touch and sound is a fascinating feature of digital music. Such an approach is re-gaining interest partially because of the availability of cost effective software and hardware. Nevertheless, the mapping of sound to gesture remains a challenging problem [9]. Our approach here was to assess various methods of motion analysis and sound mapping in a post-processing mode (The Vicon motion capture system we used does not allow for realtime processing, but an upgrade to a real-time system is possible). We found this approach interesting in two ways. First, we believe that this research guide us in the design of real-time systems for music expression. Second, this work allows us to build interactive installations where the animations and the mapping “gesture to sound” are controlled in real-time. In such a case, the control is therefore shifted from the performer to the viewer [2] (this approach is in some ways similar to a video game).
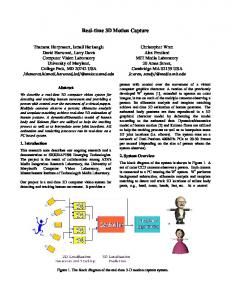
1. INTRODUCTION The digital encoding of human motion in general and motion capture systems specifically present a powerful potential for creative expression and human computer interaction. Particularly interesting is the possibility of a person using their entire body as controller, whether they are applied to visuals, audio, or even other purposes such as data exploration. Motion capture facilities at the Claire Trevor School of the Arts, University of California Irvine, include a state-of-the-art Vicon system, designed for full body 3D motion capture. We report here on-going research using this motion capture system [1]. This Vicon system is primarily designed for animation. Our intention is nevertheless to use it for more general purposes such as an interface for music control (see Fig.1). The challenges are twofold. First, motion analysis has to be performed to transform the raw motion capture data to a set of parameters that contains a particular expression. Two different approaches, that complement each other, are presented here: extraction of gestural segments (section 3.1) and pattern recognition (section 3.2). Second, the set of parameters derived from the motion analysis is mapped to sonic parameters. Mapping sounds to gesture using technology is an old idea. Several types of interfaces have been developed over the years to control digital media, and electronic music in particular (References[3] to[8]). As a matter of fact, the possibility of
3D virtual environment
motion capture movement analysis
mapping to sound
animation software
sound track
video track
Figure 1. Diagram of the animation and music production.
Figure 1. Animation production, including video and sound track generated from the motion capture data.
2. 3D OPTICAL MOTION CAPTURE We are using a commercial 3D motion capture system (Vicon 8), primary designed for animation purposes or biomechanics studies. We summarize here only the basic principles of this system. Comprehensive information about the system can be found at the Vicon website.[10] The Vicon system at the University of California, Irvine School of the Arts, is based on the simultaneous recording by 8 video cameras of small reflective balls, “markers”, attached to a dancer, at 120 Hz. The balls are lightweight and interfere
Figure 2. Left: Dancer with the various markers. One of the 8 camera (with LED lighting) can be seen on the upper left corner of the picture. Right:
The Interface of the Vicon System, illustrating the layout of the motion capture camera
minimally with the dancer's movements. The 8 video cameras are placed around the subject to create a capture volume. Because each ball is simultaneously imaged by several video cameras, the 3D coordinates of each ball can be computed using triangulation (a calibration being performed first). The standard Vicon system does not process the data in real-time. However, this system can be upgraded for real-time processing. Once the Vicon system has processed the data, it outputs them as a list of 3D coordinates for each reflective marker, frame by frame. If the balls are placed at chosen points of the "skeleton", the data can then also be expressed in term of angles between various human joints. For animation purposes, a minimal set of 30 markers is normally used. The data can be imported in animation software to be transformed in 3D animation (3DStudioMax, Maya). The final product can be either rendered as a 2D movie or kept in 3D format using, for example, VRML.
3. MOTION ANALYSIS A general problem with using a motion capture system as a controller for musical processes is that at 900 events/second (~30 points at 30 Hz), there are simply far too many to translate directly into a coherent musical process. The frame rate is itself an artificial construct, not inherent within the
motion, and the human ear does not perceive as separate events which occur closer than 20-50 ms apart. The elements that are perceived as indivisible within a motion are made up of multiple points and multiple frames. A process is needed, similar to the process of motion capture itself, in order to reduce the data into a number of events that are translated into a musical process, while keeping the salient features of the motion intact. One problem of many attempts to deal with this issue is the rather simplistic mappings from gestures to the processes that are often used. Most often these deal with purely positional mappings, i.e. high location produces a high pitch etc. Our research is an attempt to find a gestural mapping which is more robust and expressive than this simple mapping, yet still just as intuitive. We present two approaches to motion analysis both of which have the advantage that the analysis is independent of any specific axes or origin point, so a performer does not have to worry about a particular orientation, only the qualities of the gesture.
3.1. Method 1: mapping motion capture data to gestural segments The main idea of this method is that significant changes in the trajectory of a gesture can be indicated by significant changes in the acceleration of a body part. A change in acceleration of a
body part can be used as a threshold to parse the motion of the body part into different segments. This will then create a way for interpreting gestures that is tied more to the quality of the gesture, rather than to the spatial location of the body part. The method focuses on data from the motion of a single marker observed using the Vicon system (in our example, this is the right finger marker). The first step is to try to find transition points, where the point begins to move, stops, or significantly changes direction (Fig.3). These transitions points can be used to break long sequence of continuous data into shorter gestural segments, each of which can be used to generate a single event to control a musical process.
motions made by the dancer. Although these do not seem to be initially very significant, calculating the velocity and acceleration from these slightly noisy functions greatly increases the noise, as can be seen from the figure below. The filtering was accomplished by simply calculating a running average with the last few frames of the data (we used around 10). We found the most effective way to remove this noise was to both preprocess the position information, as well as filter the subsequent function prior to edge detection. The coefficients of these functions are very important for the effectiveness of the edge detection, and can be found through either careful tuning, or through machine learning, if transition points have been previously determined by hand.
Figure 3. An example of a transition point. Time Þ The raw data is in the form of three floating point coordinates (x, y, z) for each frame of the motion capture data. This data delineates a 3-dimensional vector function of time. In order to use standard edge detection techniques, and in order to remove bias toward particular directions (we want a motion parallel to an axis to have the same effect as one askew to the axes), we needed to reduce this function into a single scalar function of time. We first calculated the first derivatives with respect to time of each data point, obtaining the velocities along the three axes. A fringe benefit of this transformation was also the removal of a preference to a particular location or point of origin in the data. Through experimentation, we found that there was a strong correlation between the transition points we were looking for and an increase in the acceleration of the point (intuitively, this is related to the kinesthetic muscle response by the dancer to change the trajectory of the marker). Although it is possible to generate points from sudden increases in velocity, we found it more useful to base our points on increases in acceleration. This way sudden halts and abrupt changes in direction could be also interpreted as transition points, along with the beginnings of a motion. A single scalar function was then generated by taking the second derivative of the position and obtaining the scalar magnitude by taking the dot product of the vector with itself. A crucial step in the processing of this function is the use of low pass filtering to eliminate jitter. A good deal of small variation in the data is found due to both small inaccuracies in acquiring the measurements, as well as "haptic noise" in the
Figure 4. 1D analysis from motion capture data: Low Pass Filtered x component of position (Upper Left), Magnitude of 3D Velocity (Upper Right), Magnitude of 3D Acceleration (Lower Left), Acceleration Low Pass Filtered with leading edges marked (Lower Right). Once we had obtained a single function vs. time, we could then use standard edge detection techniques to parse the transition points. The two standard methods for finding edges are either 1) to calculate the Laplacian (in 1 dimension, just the second derivative of time) and find the zero points, or 2) find local maxima and minima by looking at increases and decreases in the first derivative with respect to time [11]. We found the second method to be the most expedient, and found that the transition point we were looking for corresponded to troughs in the function. We then found the leading edge of each peak by looking for the first significant increase in the function subsequent to a significant decrease. Once the transition points have been found, and the motion has been parsed into gestural segments, a number of parameters that characterize the segments can be very easily extracted from them. A non-exhaustive list of these include: the time taken to traverse the segment, the total distance traversed over the segment, the average speed while traveling along the segment, and the "curviness" of the path (the relation of the total distance traveled divided by the direct distance between the end points). These parameters can then be augmented, if
one chooses, by the more axis specific parameters normally used (i.e. the height of a gesture).
graph corresponds to the correlation to “right left jump”. The peaks in Fig5 correspond to each jump.
Both through the use of low pass filtering as well as the extra frames needed to determine that a leading edge does indeed exist after a trough, some latency is introduced into the system. However, this is alleviated to a large extent by the fact that an increase in acceleration occurs significantly before what is perceived visually as a transition point. As a result the system can designate a transition point just a few frames after it has appeared to occur (3-5 frames or 100-150 ms). This allows the system to both look and feel quite responsive. A more serious issue is the fact that the response to a single gesture segment does not occur until the end of a gesture. However this can be compensated for, and certainly the character of several gestures together will be accurately portrayed.
PCA can be applied in the case where the training set is composed of many different types of training movements at once. PCA can define small set of movements (eigenvectors) that can be used to describe all of the motions within a certain degree of accuracy. The eigenvectors can be called eigenmoves, similarly to eigenfaces which are defined for face recognition. Interestingly, these eigenmoves can be rendered in animations but do not correspond to any actual movements. We are currently investigating such a procedure to generate new movements.
The benefit that this method has over alternative approaches is that no specific patterns or gestures are searched for, so the system may be used quite expressively and intuitively, without the need for learning specific gestures. Once the performer has a general sense of how the analysis responds, they are free to use any vocabulary of gestures that they choose and the system will respond to them in a predictable way.
-5.5 right jumps
-6 -6.5
3.2. Method 2. Pattern recognition and Principal component analysis (PCA).
-7
We consider a movement as an ordered sequence of states, defined by the position of the markers. We considered only the relative distances of the markers to the pelvis (which is roughly the mass center of the body). Thus, the position and orientation of the figure in the space is irrelevant. For proof of concept, we selected a series of two short movements, “left jumps ” and “right jumps”. Each jumps are approximately 94 frames long (recorded at 120 frames/s) and correspond to a vector of 90×94 numbers. Principal component analysis (PCA) is used to derive the most important common feature between all jumps. PCA is used in many fields such as medical imaging or face recognition [12]. Any other sequence of movements (test movement) can be correlated to the basic movements derived from PCA (training set), by simply computing the Euclidean distance between the training set of movements (jumping left or right) and the test movement. Since the test movement is usually longer than the training movements (here 94 frames), the test movements are analyzed by translating a time window. An example of correlations is shown in Fig. 5. The top graph shows to the correlation of a “right jump”, whereas the bottom
correlation [a.u.]
-7.5 In the previous method, no prior knowledge of the gesture is necessary. In the following section we are describing the implementation of pattern recognition procedures. In such a case, the movements are analyzed based on a priori set of movements (training set). A new movement can then be classified by calculating its similitude (or difference) with the training set of movements. In this approach, the movement of the whole body (as defined by the set of markers) can be easily taken into consideration.
-8 -8.5 -5.5 left jumps
-6 -6.5 -7 -7.5 -8 -8.5
0
2000
4000 6000 frame number
8000
Figure 5. Top: correlation between a long sequence with a training set composed of right jumps Bottom: correlation between a long sequence with a training set composed of left jumps.
4. MAPPING MUSIC TO GESTURE We developed a program to map aspects of motion to sound in the Max/MSP environment [13]. The program reads the motion capture data and transforms it into either MIDI parameters or parameters controlling signal processing. A video rendering of the animation can be played simultaneously to the music generation. The mapping gesture-sound can be modified in real-time. Various mappings, from triggering discrete musical events to continuous control of sonic parameters, are currently the subject of experiments: 1) Triggering. Sample sounds can be triggered based on events defined by the procedures described in sections 3.1 and 3.2. 2) Sound synthesis and signal processing. In this case, continuous parameters are used to control for example the sound's timbre. These parameters can be the position, velocity or acceleration of any tracker, or the global parameters derived from the gesture analysis we described previously.
5. CONCLUSIONS AND FUTURE WORK We have presented two methods of gesture analysis. The first one corresponds to segmenting a movement in several parts, while the second corresponds to gesture recognition. The experiments conducted with the first method of course deal with only a single marker in the motion capture. Although we feel that using all the points would be both overly complex and redundant, increasing the number of points analyzed could be very fruitful. Points on different parts of the body could be used to control separate processes, while a more complex translation to a musical process could be based segments from multiple points on the same body part. In the future we will also look at integrating the two methods of analysis. A crucial step in increasing the utility of these methods of course is to implement them with a real time motion capture system. The expressiveness that can be found in this system can only be truly exploited if there is simultaneous feedback between the dancer and the music. In this way the dancer is not just a performer of dance and data source for the accompanying music, but becomes a performer and interpreter of both the dance and the music. We hope to achieve this in the new future by upgrading the current motion capture system used, and/or implementing the analysis on other systems. Video processing or machine vision systems are just two examples.
We also thank Isabel Valverde, Alexia BonvinBevilacqua and Christopher Dobrian.
7. REFERENCES [1] F. Bevilacqua, L. Naugle and I. Valverde, “Virtual dance and music environment using motion capture” Proc. of the IEEE - Multimedia Technology And Applications Conference, Irvine CA, 2001 [2] Part of this work will be used in an installation at the Museum of Photography-University of California Riverside, by Lisa Naugle, John Crawford, Frederic Bevilacqua, Isabel Valverde and Alexia BonvinBevilacqua. [3] "Trends in Gestural Control of Music", edited by: Marcelo Wanderley and Marc Battier, Ircam - Centre Pompidou 2000. [4] J.A.Paradiso, "The Brain Opera Technology: New Instruments and Gestural Sensors for Musical Interaction and Performance", Journal of New Music Research Vol.28 No.2, pp.30-149, 1999. [5] A. Mulder, S. Fels and K. Mase . “Design of Virtual 3D Instruments for Musical Interaction”, Proceedings Graphics Interface '99, S. Mackenzie and J. Stewart Eds., 76-83, 1999. [6] J. Paradiso, "Electronic Music Interfaces: New Ways to Play," IEEE Spectrum, 34(12), 18-30, 1997 [7] A. Camurri, S. Hashimoto, M. Ricchetti, A. Ricci, K. Suzuki, R. Trocca, and G. Volpe "EyesWeb: Toward Gesture and Affect Recognition in Interactive Dance and Music Systems", Computer Music Journal, Vol.24 No.1, pp. 57-69, 2000, or see http://musart.dist.unige.it/ [8] F.Paracino, G.Davenport, and A.Pentland "Media in performance: Interactive spaces for dance, theater, circus, and museum exhibits", IBM Systems Journal, Vol 39, No 3&4, 2000. [9] Interactive Systems and Instrument, Design in Music Working Group, www.notam.uio.no/icma/interactivesystems/wg.html [10] Vicon, www.vicon.com. [11] Laplacian Edge Detection, Roger Claypoole, Jim Lewis, Srikrishna Bhashyam, and Kevin Kelly, www-ece.rice.edu/~kkelly/elec539/laplacian.html [12] M. Turk, “A random walk through eigenspace,” IEICE Trans Information and Systems, Vol.E84-D, No.12, pp.1586-1595, 2001. [13] Max/MSP, www.cycling74.com.
6. ACKNOWLEDGMENTS We acknowledge the Claire Trevor School for the Art, and we particularly thank Prof. Lisa Naugle, director of the Motion Capture facilities.
.