Gesture Recognition on Few Training Data using Slow Feature. Analysis and Parametric Bootstrap. Patrick Koch, Wolfgang Konen, and Kristine Hein. Abstractâ ...
Gesture Recognition on Few Training Data using Slow Feature Analysis and Parametric Bootstrap Patrick Koch, Wolfgang Konen, and Kristine Hein
Abstract— Slow Feature Analysis (SFA) has been established as a robust and versatile technique from the neurosciences to learn slowly varying functions from quickly changing signals. Recently, the method has been also applied to classification tasks. Here we apply SFA for the first time to a time series classification problem originating from gesture recognition. The gestures used in our experiments are based on acceleration signals of the Bluetooth Wiimote controller (Nintendo). We show that SFA achieves results comparable to the well-known Random Forest predictor in shorter computation time, given a sufficient number of training patterns. However – and this is a novelty to SFA classification – we discovered that SFA requires the number of training patterns to be strictly greater than the dimension of the nonlinear function space. If too few patterns are available, we find that the model constructed by SFA severely overfits and leads to high test set errors. We analyze the reasons for overfitting and present a new solution based on parametric bootstrap to overcome this problem.
I. I NTRODUCTION Slow Feature Analysis (SFA) is a new learning algorithm emerging from neuroscience which is capable of learning unsupervised new features or ’concepts’ from multidimensional time signals. SFA has been originally developed in context of an abstract model of unsupervised learning of invariances in the visual system of vertebrates [Wis98] and is described in detail in [WS02], [Wis03]. Although SFA is inspired from neuroscience, it does not have the drawbacks of conventional ANNs such as long training times or strong dependencies on initial conditions. Instead, SFA is fast in training and it has the potential to find hidden features out of multidimensional signals, as has been shown impressively by [Ber05] for handwritten-digit recognition. For these reasons we apply SFA for the first time to a complex time series classification problem originating from gesture recognition, namely acceleration signals of the Nintendo Bluetooth Wiimote controller and observe several interesting facts when applying this method to small data sets. The inclusion of accelerometers in electronic devices such as mobile phones or game controllers for gesture recognition has become more and more popular in consumer electronics. While in the nineties, the recognition of gestures placed a high demand on hardware and was only present in the labs of research institutes, gesture recognition has now made its way into the homes. With over 50 million units sold [Shi09] the reason for the success of the Nintendo Wii console can be connected to the novel type of controller handling, which
clearly differs from traditional game controllers. But even though there exist a large number of games for the Nintendo Wii, recognition of complex gestures is still a challenging task. In spite of the large number of classification approaches using the Wiimote controller with the infrared device, e.g. the work from Lee [Lee08], we focus here on approaches where no infrared device is used. Although the task becomes more difficult then, we are not so dependent on the Wii structure and can easily transfer our approach to other applications. This can be of high importance when the use of infrared is not possible for any reason and only acceleration based sensors are available. Similar works exist, e.g., a recent study by Schl¨omer et al. [SPHB08], who present a classification tool based on a Hidden Markov Chain approach and Liu et al. [LW+ 09] who apply personalized gesture recognition to a user authentication problem. Rehm et al. [RBA08] describe classification of Wii gestures with different methods and expose the influence of cultural behaviours in gestures. Malmestig and Sundberg [MS08] use the Wiimote to recognize gestures for sign language recognition with good results. The commercial product LiveMove2 [Inc09] integrates features of the Nintendo Motion Plus addon but no benchmark results are available for publicity. The Slow Feature Analysis and Random Forest algorithms are briefly introduced in the next section. We also give detailed information about the acquisition and preparation of the gathered data. The experimental results are described in Sec. 3 and discussed in Sec. 4. We finish with a conclusion of the results and give an outlook of our future work in Sec. 5. II. M ETHODS A. Slow Feature Analysis Slow Feature Analysis has been invented by Wiskott and Sejnowski [WS02], [Wis03] and later extended by Berkes [Ber05] for classification. The original SFA approach for time series analysis is defined as follows: For a multivariate time series signal ~x(t) where t indicates time, find the set of real-valued output functions g1 (~x), g2 (~x), ..., gM (~x), such that each output function yj (t) = gj (~x(t))
(1)
1
minimally changes in time : ∆yj (t) = hy˙j 2 it is minimal
(2)
To exclude trivial solutions we add some constraints: Patrick Koch, Wolfgang Konen, and Kristine Hein are with the Department of Computer Sciences and Engineering Science, Cologne University of Applied Sciences, 51643 Gummersbach, Germany (email: {patrick.koch, wolfgang.konen, kristine.hein}@fh-koeln.de)
hyj it = 0 (zero mean) 1 h·i
t
means average over time and y˙ indicates the time derivative.
(3)
TABLE I
hyj2 it
= 1 (unit variance)
(4)
hyk yj it = 0 (decorrelation for k > j)
(5)
The third equation is only relevant from the second slow signal on and higher ones to prevent higher signals from learning features already represented by slower signals. For arbitrary functions this problem is difficult to solve, but SFA finds a solution by expanding the input signal into a nonlinear function space by applying certain basis functions, e.g. monomials of degree d. This expanded signal is sphered to fulfill the constraints of equations (3), (4) and (5). Then SFA calculates the time derivative of the sphered expanded signal and determines from its covariance matrix the normalized eigenvector with the smallest eigenvalue. Finally the sphered expanded signal is projected onto this eigenvector to obtain the slowest output signal y1 (t). Berkes [Ber05] has extended this approach to classify a set of handwritten digits. The main idea of this extension is to create many small time series out of the class patterns. Let us assume that for a K-class problem each class cm ∈ {c1 , ..., cK } has got Nm patterns. We then reformulate the ∆-objective function (2) for SFA with distinct indices k and l as the mean of the difference over all possible pairs:
∆(yj ) =
1 npair
·
Nm � K X X
(m)
(m)
gj (pk ) − gj (pl
)
�2
(6)
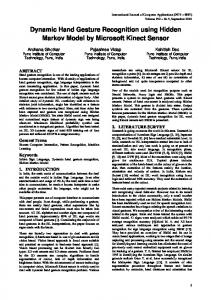
m=1 k,l=1, k 120 training patterns). However, with less training patterns especially the SFA detection rates become quite unsatisfying. The error rate increases immensely for < 90 training patterns, while the error on the training set constantly stays at zero level. The random forest predictor is not so largely affected by this problem, because the subspaces determined during classification should still be correct, though the results are not so accurate any longer. But as a peculiarity of the RF classifier the error rates on training and test set
0.8
SFA Error on Training Set SFA Error on Test Set
0.7
0.7
0.6
0.6 Classification Error
Classification Error
0.8
0.5 0.4 0.3
0.5 0.4 0.3
0.2
0.2
0.1
0.1
0
RF Error on Training Set RF Error on Test Set
0 40
60
80
100 120 140 # Training Patterns
160
180
200
40
60
(a) SFA error rates
80
100 120 140 # Training Patterns
160
180
200
(b) RF error rates
Fig. 5. (a) Error rates achieved with SFA in the interval of [40, 200] training patterns (parameter setting: npp = 12). The test set error suddenly increases when the number of patterns is too small for a sufficient rank of the covariance matrix (< 90 patterns), while the error on the training set stays constantly near zero. (b) The RF error rates also increase with fewer training patterns, but do not rise to an unnatural high level in contrast to SFA. Additionally, the training set error is a good predictor for the test set error on unseen data.
N ≥ Dxp + K
(7)
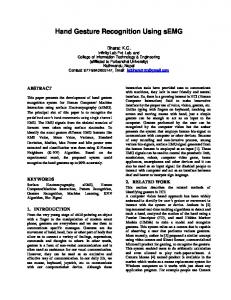
where N is the number of patterns available for training and K is the number of classes and Dxp is the dimension of the nonlinear expanded function space used by SFA. Fig. 6(a) shows the results from SFA on a sufficient number of training records with 121 training records (from two persons) which is enough for Dxp = 77. There is some intra-class variation and a sharp inter-class separation, at least for the slower signals. A Gaussian classifier trained on y1 , . . . , y4 can learn quite robustly to separate the 5 classes. In contrast, Fig. 6(b) shows the results from SFA when there are too few training records. Here the number of 46 training records is much smaller than Dxp + K = 82 as required by Eq. (7). Consequently we get rank(Cov(~v )) = rank(Cov(~v˙ )) = 46 − 1, i. e. the matrices are rank deficient and the SFA ouput signals show absolutely no intra-class variation. The SFA model will select any of the 77 − 45 dimensions not within the eigenvector basis of Cov(~v˙ ), and almost surely this dimension will be meaningless for the test data. As a result we get high error rates (60%-100%) on independent test data.
90 80
CV test error rate [%]
correlate with each other. This observation is an indicator for the robustness against overfitting and is well supported by the almost linear decreasing classification error in Fig. 5(b) when adding more training data. Why is this not the case for the classification with SFA? The answer to this question becomes obvious when we look into SFA’s computation of the output signal. The algorithm computes the covariance matrix of the expanded input signal and determines its eigenvalues. We show in the Appendix that a certain covariance matrix becomes rank deficient if too few training examples are available. This leads to an underdetermined linear system to be solved by the algorithm. As a necessary precondition to avoid rank deficiency in SFA, the following constraint has to be met (see Appendix):
90 SFA+Gauss Gauss only RF
Dxp
80
70
70
60
60
50
50
40
40
30
30
20
20
10
10
0 2
4
6 8 PCA dimension npp
10
0 12
Fig. 7. SFA with marginal data: Too high npp yield unsatisfactory error rates. Experimental settings: 74 gestures from one person (ID 122), cross validation with 10 folds. Shown is the average out of 5 runs with different seeds for the fold generation.
IV. D ISCUSSION While SFA works well in classification experiments with sufficient training data, where it achieves results comparable to the well-known Random Forest classifier, it shows severe limitations on cases with marginal training data. Are there possibilities to overcome these limitations? There are two options: 1) Small npp : We have shown that N ≥ Dxp + K (see Appendix or Eq. (7)) is a necessary condition to get a full-rank covariance matrix from N training records. For monomials of degree 2 the relation Dxp = npp +
npp (npp + 1) 2
(8)
output of slow varying function y1(t)
output of slow varying function y2(t)
output of slow varying function y1(t)
output of slow varying function y2(t)
1.5 1
−0.5
−0.5
0
50 index
0 −0.5
0 −0.5
−1
−1
−1
−1.5
−1.5
−1.5
−1 −1.5
0.5
0.5
0
y1(t)
0
1
1
0.5
0.5
y2(t)
1
y (t)
1
y2(t)
1.5
100
0
50 index
100
0
20
40
0
index
output of slow varying function y3(t)
output of slow varying function y4(t) (a) Rank sufficient
20
40 index
output of slow varying function y3(t) 1.5
output of slow varying function y4(t) (b) Rank too small 1.5
−0.5
−0.5
−1
−0.5
−1 −1.5 0
CV with 66 train records/fold, −2 n = 12, D = 90 pp xp 50 index
100
0
50 index
80 70
100
SFA+Gauss Gauss only RF
CV test error rate
σnc=0.8
50
−1
−1
60
40
−1.5
2) SFA+PB: Another option is to keep npp at its desired 0 20 40 0 20 40 value, but index to enrich the training index data by parametric bootstrap [HTF01, pp. 264]: This method increases the number of training instances by adding Ncopies new records which are ’noisy copies’ of original training ~ Here we estimate first the centroid µ(m) for records X: i each class m and the standard deviation σ(Xi ) for each ~ Then we form component Xi of the data records X. new patterns whose ith component is given by (nc)
Xi
30 20 10 0 0
y4(t)
y3(t)
y4(t)
3
y (t)
1.5 1 Fig. 6. Training data output of the two slowest SFA signals for Dxp = 77 on the 5-class gesture classification problem when there are (a) sufficient 1 1 training data 1(121 records) The x-axis shows the training record index. For better visualization the training records are ordered: first 35 class-1 records 0.5 0.5 0.5 area), then 14 class-2 records (grey area) and so on up to class 5 (rightmost white area). (b) Too few training data (only 46 records, where (leftmost white 0 0 at least Dxp 0+ K = 82 records are required). The output on the training data shows severe overfitting. 0
50
100
150 200 Ncopies
250
300
350
Fig. 8. Bootstrapping SFA in the case of marginal data: SFA with too few training data (ntrain = 66, Ncopies = 0) gets very high test set errors (approx. 80%). By applying a statistical bootstrap, which adds Ncopies noisy replica to the 66 training data, we decrease the SFA test set error dramatically to values around 2% (thick line ”SFA+Gauss”). This is by a factor of 3 smaller than the test set error from a Gaussian classifier (thin line ”Gauss only”). Experimental settings: Same as Fig. 7, additionally npp = 12 (hence Dxp = 90) and σnc = 0.8.
holds. Therefore, one option is to decrease npp until the constraint of Eq. (7) is fulfilled. An example is shown in Fig. 7, where the task was to classify the gestures of one person: For each cross validation run we have 66 or 67 training data (90% of 74 gesture records in 10-fold cross validation). This leads to the necessary condition Dxp ≤ 66 − 5 = 59 or npp ≤ 9 acc. to Eq. (8), which is confirmed by the steep incline of the red curve between npp = 9 and 10 in Fig. 7. Best results are obtained with npp ∈ {5, 6}. – This option works, but it has the drawback that the number of information transferable to the classification algorithm is quite severely limited to 5 or 6 input dimensions.
(m)
= µi
+ σnc Zi
(9)
where Zi is a random number drawn from the normal distribution N (0, σ(Xi )2 ) and σnc is a free strength parameter. Fig. 8 shows the resulting CV error rates as a function of Ncopies . We expect to need at least Ncopies = 90 + 5 − 66 = 29 additional records and we find from Fig. 8 that the steepest decline of the red curve is exactly at this value. However, to get a low error rate, Ncopies should be higher, between 150 and 300. Note that the parametric bootstrap affects only the training data, and no changes to the test data are made. Therefore the CV test error rate remains realistic. – The option parametric bootstrap allows to put more of the original training information into the SFA model since we can work with npp =12 or higher and are not restricted to npp =6. We name this enhanced algorithm SFA+PB. Parameter sensitivity We ran several tests with other values of parameter σnc . The algorithm is not very sensitive to this parameter, since we get nearly identical results if we halve or double the value, i.e. σnc = 0.4 or σnc = 1.6. But the right order of maginitude is important: With too small values, e.g. σnc = 0.1, the convergence as a function of Ncopies is very slow, while with too large values, e.g. σnc = 3.2, the error rates rise after a small dip quickly to unsatisfactory high error rates of 25% and above. Best results As a summary we show in Tab. III for the three tasks A), B) and C) (cf. Sec. III) and for our three algorithms the best error rates. (SFA-settings: npp = 12, σnc = 0.8 plus Ncopies = {0, 200, 200} in cases {A),
TABLE III B EST CROSS VALIDATION TEST SET ERROR RATES FOR THE THREE ALGORITHMS
SFA+PB, RF AND G AUSSIAN CLASSIFIER .
Settings SFA+PB A) random sampling (716 records) B) unseen persons (716 records) C) marginal data (74 records, 1 person)
CV test set error RF Gaussian
(2.9±0.3)%
(2.1±0.3)%
(14.0±0.6)%
(15.3±14.9)%
(14.8±15.3)%
(19.6±11.3)%
(1.3±1.1)%
(2.8±0.4)%
(5.0±1.7)%
TABLE IV CPU TIMES FOR SFA+PB, RF AND H IDDEN M ARKOV [P OP 07 A ]. N IS THE NUMBER OF RECORDS FOR EACH TASK . Task
N RF
train train apply
74 716 64500
0.55 5.60 6.61
CPU time [sec] SFA+PB npp =12 npp =15 0.52 0.82 5.16 8.00 1.09 1.89
[Pop07a] 60 – –
B), C)}, resp. RF settings: 500 trees, mtry=3). The shown results are averages and standard deviations from 10 runs with randomly different cross validation sets in cases A) and C). With the enhancement of parametric bootstrap the resulting CV test set errors from SFA+PB and RF are similar. They are in cases A) and C) considerably better than a Gaussian classifier (by a factor of 2-6). Case B) has only one cross validation index (defined by the person ID). The standard deviation is in this case taken with respect to the different persons. It is very large (approximately as large as the CV error itself), because there is a large inter-person variation as already described in connection with Fig. 4. As a surprise we found that case B) also benefits from the parametric bootstrap enhancement which was originally designed only for case C). If we run case B) without bootstrap (Ncopies = 0 instead of 200) we get a CV error rate of 17.7% instead of 15.3%. We assume that the variation introduced by the noisy copies of the parametric bootstrap is beneficial for the generalization to unseen persons. Other approaches We compared our results to another gesture recognition engine in order to exclude that our gesture set is perhaps ’easier’ than others. The Hidden Markov model [SPHB08] is available as software library Wiigee [Pop07a] and we used it on a small set of our gestures (74 patterns). The error rate on this training set was 26% which has to be compared with the RF training set error of about 17% from Fig. 5(b) for the same training patterns (and with 15% for SFA+PB). Wiigee tests with larger training sets or on unseen test patterns were currently not possible due to memory and time restrictions. We conclude however that our gestures do not seem to be fundamentally ’easier’ for other classifiers. – As another comparision we performed the ”same-person CV error”-task of [SPHB08] on our data and with our SFA+PB model and got a (2.3 ± 1.5)% CV
error rate where [SPHB08] reports 10%. Performance In Tab. IV we show the CPU times for SFA and RF. Both, RF and SFA, are quite fast algorithms, since the training takes only about 0.5 seconds for 74 records and 5 seconds for 716 records on a standard laptop processor2 . This is faster by a factor of 100 compared to the Hidden Markov recognition engine Wiigee [Pop07a], which we tested with the same 74 patterns. The training time for the Gaussian classifier is negligible, actually it is contained in the reported SFA time. The times for SFA include the extra 200 parametric bootstrap records. They are based on an unoptimized MATLAB-implementation, so there may be some room for improvements. Since a trained SFA model has a very simple structure, we found that applying a trained model to new gestures (last line in Tab. IV) is for SFA 3–6 times faster than for RF. Importance of Data Preparation We finally investigated the impact of the preliminary normalization steps described in Sec. II-C on the overall accuracy. As an example we skipped the amplitude normalization and repeated the experiments of Tab. III. The results of SFA+PB were 6.8% in case A and 3.2% in case C, i.e. they got considerably worse, roughly by a factor of 2. We conclude that data preparation is important, even if visually the difference between column 2 and column 3 in Fig. 2 appears small. V. C ONCLUSION AND O UTLOOK In this paper we applied Slow Feature Analysis (SFA) to a time series classification problem originating from gesture recognition. SFA has proven to be considerably better (by a factor of 2-6) than a simple Gaussian classifier. Surprisingly we experienced that small problems are more difficult for SFA than larger problems. More precisely, the number of training records has a large impact on the classification performance for independent test records. If a sufficient number of data is available to train the classifier, the results of SFA are comparable to other state-of-the-art methods like the Random Forest (RF) predictor. But for marginal training data – more precisely: if the number of training patterns is lower than the dimension of the expanded function space of SFA – the algorithm severely overfits, which causes a high classification error on the test set. We proposed here an enhancement to SFA for the case of marginal data, which is based on parametric bootstrapping. With that we got SFA results comparable or better than RF results on the same data. The parametric bootstrap was found to be beneficial for generalization to unseen persons, too. We used here a very simple – however broadly applicable – parametric model for the bootstrap, namely a model based on a Gaussian noise distribution. For the gesture classification task we plan to investigate as future work a more specific parametric model where the creation of virtual patterns is based on gesture-specific geometric operators, e.g. rotations of real class patterns, or timeline operators like shift of start and stop point. We expect that with such virtual patterns R 2 Intel
Core2 Duo CPU T7700, 2.4GHz.
the generalization capabilities, especially towards unseen persons, can be enhanced. A strength of SFA is its capability to analyze unsupervisedly continuous time streams. Therefore, a future application for SFA in gesture analysis is the automatic separation of gesture- and non-gesture-periods on the continuous timeline. At the moment, most gesture-recording devices require an additional button to be pressed while the gesture is performed. If SFA were able to distinguish gesture and nongesture-periods this would permit continuous online gesture recognition inside applications. – A third line of research is to analyze in more detail, why some gestures / some persons are harder to classify than others. In summary, the neuro-inspired algorithm SFA has shown to be fast and precise on classification tasks and it needs only few parameters. Due to its simple projection approach, the application of the trained model is 3–6 times faster than the already fast RF method. With SFA+PB, our new parametricbootstrap extension, the algorithm can also deal with few training data, which was not possible for plain SFA. ACKNOWLEDGEMENT This work has been supported by the Bundesministerium f¨ur Bildung und Forschung (BMBF) under the grant SOMA (AIF FKZ 17N1009, ”Ingenieurnachwuchs”) and by the Cologne University of Applied Sciences under the research focus grant COSA. We are grateful to J. Piesk and M. Polak (Nurogames GmbH) as well as to P. Wagner for fruitful discussions and technical support. A PPENDIX : L OWER BOUND ON THE NUMBER OF TRAINING PATTERNS
Given a classification problem with N patterns ~x(m) from K classes m = 1, . . . , K: After SFA-expansion each pattern ~x(m) is transformed to a point ~v (m) in the nonlinear expanded function space of SFA with dimension Dxp . The SFA matrix C := Cov(∆~v ) is formed from all intra-class difference (m) (m) (m) (m) vectors ∆~v = ~vi −~vj , where ~vi and ~vj are patterns belonging to the same class m. We show here that matrix C is rank deficient as soon as N − K < Dxp . Lemma: rank(C) ≤ min(Dxp , N − K)
(10)
Proof: Each of the N patterns belongs to one class m. If Nm is the number of patterns belonging to class m = 1, . . . , K, we have N1 + N2 + . . . + NK = N. (m)
(m)
The difference vectors ∆~v = ~vi − ~vj for class m will span at most an (Nm − 1)-dimensional subspace, since the (m) Nm points ~vi can not span more than Nm − 1 dimensions. The matrix C is formed from these subspaces and thus can not have a rank larger than the direct sum of these subspaces: rank(C) ≤ N1 − 1 + N2 − 1 + . . . + NK − 1 = N − K.
Since on the other hand C is a square matrix with Dxp rows and columns, it can not have a rank larger than Dxp . In combination this proves the Lemma above. Similarly, it is easy to see by spezializing to K = 1 that rank(Cov(~v )) ≤ N − 1. If rank(C) = N − K < Dxp then C is rank deficient. There remain at least Dxp − (N − K) dimensions perpendicular to all difference vectors. One of the directions in this perpendicular subspace is arbitrarily picked by SFA but it is almost surely not the best direction for slow variation. Therefore we will get 0% training set error (by construction), but with high probability a large test set error. In other words, N = Dxp + K
(11)
is the minimum number of training records required to avoid rank deficiency and overfitting. R EFERENCES [Ber05]
P. Berkes. Pattern recognition with slow feature analysis. Cognitive Sciences EPrint Archive (CogPrint) 4104, http: //cogprints.org/4104/, 2005. [BFSO84] L. Breiman, J. Friedman, C. J. Stone, and R. A. Olshen. Classification and Regression Trees. Chapman & Hall/CRC, January 1984. [Bre01] L. Breiman. Random forests. In Machine Learning, pages 5–32, 2001. [HTF01] T. Hastie, R. Tibshirani, and J. Friedman. The Elements of Statistical Learning. Springer, 2001. [Inc09] AiLive Inc. Livemove2: Motion recognition and tracking. http://www.ailive.net/lm2.html, 2009. [Kon09] W. Konen. On the numeric stability of the SFA implementation sfa-tk. arXiv.org e-Print archive, http://arxiv.org/ abs/0912.1064, December 2009. [Lee08] J. C. Lee. Hacking the Nintendo Wii remote. Pervasive Computing, IEEE, 7(3):39–45, 2008. [LW02] A. Liaw and M. Wiener. Classification and regression by randomForest. R News, 2(3):18–22, 2002. [LW+ 09] J. Liu, Z. Wang, et al. uWave: Accelerometer-based personalized gesture recognition and its applications. IEEE Int. Conf. on Pervasive Computing and Communications, 0:1–9, 2009. [MS08] P. Malmestig and S. Sundberg. SignWiiver - implementation of sign language technology, 2008. [Pop07a] B. Poppinga. Beschleunigungsbasierte 3D-Gestenerkennung mit dem Wii-Controller. Carl von Ossietzky Universit¨at Oldenburg, Germany, Internal Reports, 2007. [Pop07b] B. Poppinga. Wiigee, a Java-based gesture recognition library for the Wii remote. http://www.wiigee.org/, 2007. [RBA08] M. Rehm, N. Bee, and E. Andr´e. Wave like an egyptian – accelerometer based gesture recognition for culture specific interactions. In Procedings of HCI 2008 Culture, Creativity, Interaction, 2008. [Shi09] M. Shiels. Nintendo Wii sales hit 50 million. BBC News website, San Francisco, 2009. [SPHB08] T. Schl¨omer, B. Poppinga, N. Henze, and S. Boll. Gesture recognition with a Wii controller. In Proc. of TEI’08 Conference Tangible and Embedded Interaction, pages 11–14, 2008. [Wis98] L. Wiskott. Learning invariance manifolds. In Proc. of the 5th Joint Symp. on Neural Computation, volume 8, pages 196–203, San Diego, CA, 1998. Univ. of California. [Wis03] L. Wiskott. Estimating driving forces of nonstationary time series with slow feature analysis. arXiv.org e-Print archive, http://arxiv.org/abs/cond-mat/0312317/, December 2003. [WS02] L. Wiskott and T. Sejnowski. Slow feature analysis: Unsupervised learning of invariances. Neural Computation, 14(4):715– 770, 2002.