infographics on a popular infographic sharing website in an effort to better ... popular infographics, lessons learned about what makes a good infographic, recommendations ..... In your own words, why do you think people like this infographic?
Getting Graphic About Infographics 1
Preprint: “Getting graphic about infographics: Design lessons learned from popular infographics” to appear in the Journal of Visual Literacy Dunlap, J. C., & Lowenthal, P. R. (in press). Getting graphic about infographics: Design lessons learned from popular infographics. Journal of Visual Literacy.
Getting graphic About Infographics: Design Lessons Learned From Popular Infographics Joanna C. Dunlap Associate Professor University of Colorado Denver Patrick R. Lowenthal Assistant Professor Boise State University Abstract People learn and remember more efficiently and effectively through the use of text and visuals than through text alone. Infographics are one way of presenting complex and dense informational content in a way that supports cognitive processing, learning, and future recognition and recollection. But the power of infographics is that they are a way of delivering the maximum amount of content in the least amount of space while still being precise and clear; because they are visual presentations as opposed to oral or text presentations, they can quickly tell a story, show relationships, and reveal structure. The following paper reports on an exploration of top 20 “liked” infographics on a popular infographic sharing website in an effort to better understand what makes an effective infographic in order to better prepare graduate students as consumers and designers of infographics. The paper concludes with recommendations and strategies on how educators might leverage the power of infographics in their classrooms.
Introduction We see with our brains. ~ John Medina
The field of Instructional Design and Technology (IDT) largely focuses on designing instructionally effective learning experiences, environments, and visual- and media-based messages (Januszewski & Molenda, 2008; Koszalka, Russ-Eft, & Reiser, 2013; Reiser, 2001a, 2001b). Thus, IDT courses and programs strive to prepare students to be proficient at completing such tasks. One important component to being able to accomplish tasks like these successfully
Getting Graphic About Infographics 2 involves becoming visually literate. While there are many definitions of visual literacy (Braden, 1996; Moore & Dwyer, 1994), IDT professionals tend to think of visual literacy as the ability to interpret and create visual messages for learning and performance (Heinich, Molenda, & Russell, 1982). Focusing on visual literacy, though, is not new (Pettersson, 2009); visual literacy has been a focus of IDT since the 1970s (Bishop, 2014; Braden, 1996; Fransecky & Debes, 1972). Over the years, though, visual literacy increasingly has become a skill that IDT professionals need in order to be successful at their jobs (Sugar, Brown, Daniels, & Hoard, 2011; Sugar, Hoard, Brown, & Daniels, 2012). As a result, faculty in IDT courses and programs strive to use authentic and relevant assignments and projects to involve students in the design and assessment of instructional visuals. Infographics have emerged as a popular visual approach to deliver abstract, complex, and dense messages (Lamb, Polman, Newman, & Smith, 2014; Smiciklas, 2012; Vanichvasin, 2013). While we have all likely seen an infographic before (which is short for information graphic), an infographic, according to Krum (2014), is “a larger graphic design that combines data visualizations, illustrations, text, and images together into a format that tells a complete story” (p. 6). Infographics are widely used in newspapers and newscasts (Lamb et al., 2014; Smiciklas, 2012) because they are efficient with encapsulating several details in one visual while still being clear and precise. Because of their wide acceptance and use as a device for delivering complicated content to a wide audience, infographics have considerable potential as a way of efficiently, precisely, and clearly delivering abstract, complex, and dense instructional content— and thus supporting student learning. Because of this potential, we contend that IDT professionals need experience interpreting and evaluating infographics as well as creating them for instructional and performances needs. However, there is limited scholarly literature that focuses on infographic use in education or on the effective design of infographics specifically for educational settings. Therefore, we set out to investigate popular infographics to learn more about what makes an infographic “good.” In this paper we present the results of our analysis of popular infographics, lessons learned about what makes a good infographic, recommendations for teaching people to be better consumers and designers of infographics, and strategies on how educators might leverage the power of infographics in their classrooms. Literature Review Visual literacy stems from the notion of images and symbols that can be read. Meaning is communicated through image more readily than print, which makes visual literacy a powerful teaching tool. ~ Patricia Edwards
Visual literacy is an important skill for 21st century workers (see Felten, 2008). The following sections highlight some of the pertinent literature on the power of vision, the power of visuals, and, specifically, the power of infographics to help ground our inquiry. Power of vision
Getting Graphic About Infographics 3 Vision is our most powerful sense (Avgerinou & Ericson, 1997). In Brain Rules, John Medina (2008) described how vision trumps all other senses because human brains are designed to—are evolutionarily wired to—understand images. Medina even argued that “...vision is probably the best single tool we have for learning anything” (p. 233). The power of vision is likely what makes so many people self-identify as “visual learners.” While researchers are (correctly) quick to point out that there is little research to support the concept of learning styles—that is, specifically, that people learn in different ways and that educators should cater to these differences (Kirschner & van Merriënboer, 2013; Pashler, McDaniel, Rohrer, & Bjork, 2008), something resonates with many teachers and learners about the importance of “seeing” something to understand it and remember it (see Wallace, 2011). As powerful as vision is, it is important to note that vision is not perfect. In fact, research shows that we see with our brains and not with our eyes (Chabris & Simons, 2009; Sacks, 1996, 1998) and that our brains can control what we see and how we see it (Jensen, 1998; Hawkins & Blakeslee, 2004). These are important concepts for educators to recognize and leverage when possible. Power of visuals Visuals are powerful tools for learning. First, visuals help improve memory and recall. Research has shown that people are capable of recalling hundreds to thousands of pictures, even when having seen the pictures for only a few seconds (Zull, 2002). Thus, the more visual an instructional or informational message is, the more likely it is to be recognized and recalled (Medina, 2008). As a result, visuals have the potential to be an efficient, precise, and clearer way to communicate than oral and text alone. Visuals also can assist with cognitive processing by providing a context or metaphor. When visuals are used effectively, they serve to help people understand abstract, complicated, and complex information, especially when people are unfamiliar with the concept and do not have a pre-existing mental model to assist with the comprehension of new information. Therefore, we are all visual learners. Because visuals vary in their purpose, organization, and aesthetic value, the effectiveness of a visual—such as an infographic—may be influenced by how well it achieves its desired goal, how easy it is to review, and/or how pleasing it is to view. Similarly, whether a visual is effective may come down to a mismatch between the type of information a visual displays and its form (Lohr, 2007; Tufte, 1983; Williams, 2004). Effective visuals apply visual organization and structure to reflect relationships, describe how parts of a whole interact, and/or reveal an underlying story. Duarte (2008) described six types of visual representations that are useful in communicating content to an audience, specifically (a) flow (e.g., linear, circular, divergent/convergent, multidirectional); (b) structure (e.g., matrices, trees, layers); (c) cluster (e.g., overlapping, closure, enclosed, linked); (d) radiate (e.g., from a point, with a core, without a core); (e) pictorial (e.g., process, reveal, direction, location, influence); and (f) display (e.g., comparison, trend, distribution). These types of visual representations—especially when used together as building blocks for communication—can help efficiently, precisely, and clearly convey abstract ideas and complex and dense content that would otherwise require a lengthy
Getting Graphic About Infographics 4 narrative. As Duarte (2008) argued, “rather than oversimplifying the complexities…[the use of these types of visual representations] can often incorporate multiple parameters, telling a richer story of cause and effect [or any other relationship] than data points alone” (p 57). Power of infographics Infographics are an increasingly popular approach to presenting content in a visual way. Despite this increased popularity, though, infographics are not new. Data visualization has been around for centuries in the form of maps and other illustrations (Marcel, 2014). And while a number of different types of infographics exist today, Marcel(2014) and others argued that there is “no threshold at which something ‘becomes’ an infographic” (Lankow, Ritchie, & Crooks, 2012, p. 20). Nevertheless, a genre of visuals appears to be clearly recognized as infographics, which typically include a number of the visual representations discussed in the previous section. Infographics can be a powerful visual approach to conveying information and supporting conceptual understanding because people see with their brains (Oetting, 2015; Smiciklas, 2012). The more visual the input is, the more likely the visual will be recognized and recalled, thus making vision a powerful tool for learning (Medina, 2008). Many learning and message design theories support this idea. For example, Nelson’s picture superiority theory describes how people learn concepts more easily by viewing pictures than by reading text alone because human brains are essentially hard-wired for visuals—the very architecture of the visual cortex provides direct access to human consciousness (Clark & Mayer, 2011). Further, Pavio’s (1971) dual coding theory hypothesizes that when people view an image, they encode the information with both a verbal and image code, activating multiple neural pathways to support memory. From an instructional perspective, infographics support attention, minimize cognitive load, create aesthetically appealing artifacts, activate or build schema by using objects and information known to learners, and motivate (Clark & Lyons, 2010). In an educational setting, effective infographics may be used as job aids, advance organizers, mind maps, content summaries, and study tools. An effective infographic communicates the essence or fundamentals of a message without requiring someone to read the associated text thoroughly (EDUCAUSE Learning Initiative, 2013; Ware, 2012); a reader or viewer can determine the subject of an infographic at a glance. Infographics are often used when tables, charts, or text alone cannot convey a clear, complete message (see Centers for Disease Control and Prevention, 2012). Methods Design is an opportunity to continue telling the story, not just to sum everything up. ~ Tate Linden
Given the potential of infographics for learning and the overall lack of literature on effective infographic design in educational settings, we set forth to explore what makes an infographic good. In other words, what qualities constitute an effective infographic? By exploring this question, we aimed to be better consumers and designers of infographics, and to develop a set of recommendations for designing and teaching others how to design effective infographics for educational settings. To bound our inquiry, we identified the top 20 “liked”
Getting Graphic About Infographics 5 infographics on Visual.ly—a reputable source for infographics (Melson, 2012)—to use for the sample of the study (see Table 1 and Figure 1). We decided to use the most “liked” infographics, instead of the most viewed, because one might view an infographic but not actually “like” it. Each infographic in our sample can be viewed online; see Table 1 for a list of the infographics and the corresponding URLs. Table 1 Top 20 “Liked” Infographics on Visual.ly Infographic & URL 1. 2. 3. 4. 5. 6. 7. 8. 9. 10. 11. 12. 13. 14. 15. 16. 17. 18. 19. 20.
How Much You Can Trust a Bearded Man? http://visual.ly/how-much-you-can-trust-bearded-man New World Marketing http://visual.ly/new-world-marketing The Evolution of the Geek http://visual.ly/evolution-geek The World of Beer http://visual.ly/world-beer Anatomy of the Mobile Market http://visual.ly/anatomy-mobile-market What Are The Odds? http://visual.ly/what-are-odds Social Media Yearbook http://visual.ly/social-media-yearbook Should I Text Him? Flowchart http://visual.ly/should-i-text-him-flowchart 11 Untranslatable Words From Other Cultures http://visual.ly/11-untranslatable-words-other-cultures Why Startups Fail http://visual.ly/why-startups-fail The Evolution of Typography http://visual.ly/evolution-typography Are You Happy? http://visual.ly/are-you-happy-0 What Does Your Handwriting Say About You? http://visual.ly/what-does-your-handwriting-say-about-you Social Media Spec Guide http://visual.ly/social-media-spec-guide A Tale of Two Cows http://visual.ly/tale-two-cows Mac Person vs. PC Person http://visual.ly/mac-person-vs-pc-person Mission(s) to Mars http://visual.ly/missions-mars Diagrams Rule: A Satirical Look at Infographics http://visual.ly/diagrams-rule-satirical-look-infographics Chief Marketing Officers and Social Media http://visual.ly/chief-marketing-officers-and-social-media Kitchen Cheat Sheet http://visual.ly/kitchen-cheat-sheet
Getting Graphic About Infographics 6
Infographic 1. How Much You Can Trust a Bearded Man? 2. New World Marketing 3. The Evolution of the Geek 4. The World of Beer 5. Anatomy of the Mobile Market 6. What Are The Odds? 7. Social Media Yearbook 8. Should I Text Him? Flowchart 9. 11 Untranslatable Words From Other Cultures 10. Why Startups Fail 11. The Evolution of Typography 12. Are You Happy? 13. What Does Your Handwriting Say About You? 14. Social Media Spec Guide 15. A Tale of Two Cows 16. Mac Person vs. PC Person 17. Mission(s) to Mars 18. Diagrams Rule: A Satirical Look at Infographics 19. Chief Marketing Officers and Social Media 20. Kitchen Cheat Sheet
Total views
Total likes
Total comments
Facebook
Tweets
Stumble Upon
Pin it
150.2 K
302
58
3.6K
1381
23
1022
73.4K 103.8K
254 224
21 36
445 1.5K
535 2635
25 8623
593 3166
93.6K 86.2K
226 199
25 29
2.1 235
1663 328
137 19
3249 537
1.7M 39.1K 1.4M
193 187 169
248 15 80
26K 253 20K
7154 769 6083
261K 180 208K
1606 1296 3375
119.9K
180
103
19K
3444
4402
7331
111.6K 39.5
150 150
25 11
1.1K 36
3079 83
1897 5
464 251
38.9K 281.1K
145 141
17 31
465 2.2K
292 2024
29 234K
247 3797
22.9K 170.1K 67.7K
139 136 131
13 81 50
1.1K 19K 348
1853 5888 207
94 85 8491
749 630 117
41K 41.9K
125 121
18 17
21 178
27 398
17 4
46 98
29.2K
117
11
196
261
13
829
293.6K
115
70
1.7K
1070
178K
29.7K
Figure 1. Descriptive Data About Top 20 “Liked” Infographics Analyzed in This Study. In the absence of a validated instrument, we turned to the aesthetic learning experience framework (Parrish, 2009; see also Author) to structure and frame our exploration of what constitutes a good infographic. Aesthetic learning experiences involve learners in the right level of challenge (just beyond what learners perceive as easily achievable) and heightened engagement (such as what is achieved in a well-executed film, novel, or symphony). Aesthetic learning experiences are memorable and often transformative, leaving learners with enhanced confidence and capabilities (see Parrish, 2009; Author). Aesthetic learning experiences are influenced by both the qualities of individual learners (e.g., intent, trust, presence) and situational
Getting Graphic About Infographics 7 qualities. The situational qualities are those that designers and educators can affect by making appropriate design decisions (Author). We will briefly describe these situational qualities below and explain how they might be related to infographics to provide some context in how we used them to create an instrument to explore popular infographics. ● Immediacy: To establish immediacy, a designer or educator needs to involve learners directly and instantly with the content in order to create a sense of urgency or excitement. Storytelling, for example, is one way of establishing immediacy because it captures the emotional authenticity of the situation. An infographic’s structure and layout can likely support immediacy through the sharing of emotional and sensual details, including clear examples and visual representations of complex ideas. ● Malleability: Malleability allows learners to determine personal meaning and relevance, and to be co-owner/co-creator of the experience. To be malleable, an infographic needs enough pliability so learners can influence their own experience of the infographic and the outcomes associated with influenced actions taken due to exposure to the infographic. An infographic can establish malleability by encouraging learners to interact with the content (e.g., asking learners questions that encourage reflection, allowing learners to peruse the infographic in more than one way, providing content pathways based on decision trees). ● Compellingness: A compelling infographic is one that is so powerfully irresistible that it evokes learners’ interest, attention, and admiration. One way infographics can be compelling is by sharing provocative or novel ideas or problems; the unexpected can make a message memorable and sticky (Heath & Heath, 2007). An infographic’s structure and sequence can help make it compelling, propelling the learner through the content via a succession of related ideas. Another way to make an infographic compelling is to use a narrative structure that compels the learner through the content in order to find out what happens next. ● Resonance: Resonance is about reverberation, a sensory experience that leads to a lasting relevant effect. When an infographic is resonant, it likely kindles images, emotions, and memories. At its core, resonance is about connection, and when an infographic helps viewers establish connections, the infographic is more resonant for them. Storytelling, as well as using visual representations that illustrate connections and relationships, can help an infographic resonate for learners. ● Coherence: Coherence refers logic, clarity, and consistency. A coherent infographic is one that shares a complete and well-formed message that is credible and believable (Heath & Heath, 2007). Without coherence, an infographic can be disjointed, which then negatively affects learners’ ability to engage and derive meaning from the infographic. Based on these situational qualities, we rated each of the top 20 "liked" infographics with an instrument we developed that allowed us to use a content-analysis approach for the coding. The instrument consisted of 24 questions. The first question asked raters: “In your own words, why do you think people like this infographic?” The next 22 questions were then based on the
Getting Graphic About Infographics 8 situational qualities of the aesthetic learning experience, to which raters answered yes or no based on their analysis of the infographic and then provided a justification for their answer in an open-ended format. The instrument concluded with one final open-ended question asking for additional comments or insights about the infographic (see Figure 2). In your own words, why do you think people like this infographic? Related to immediacy component: 1. The infographic creates a sense of urgency. [Yes or No] How does this infographic create a sense of urgency? Or how does it not? 2. The infographic creates a sense of excitement. [Yes or No] How does this infographic create a sense of excitement? Or how does it not? 3. The infographic encourages users to take action. [Yes or No] How does this infographic encourage users to take action? Or how does it not?
● ●
● ● ● ● ●
● ● ●
● ● ● ●
Related to malleability component: 4. The infographic enables users to apply the content in various ways. [Yes or No] How does this infographic enable users to apply the content in various ways? Or how does it not? 5. The infographic allows users to determine their own personal meaning and relevance. [Yes or No] How does this infographic allow users to determine their own personal meaning and relevance? Or how does it not? 6. The infographic allows users to explore the content. [Yes or No] How does this infographic allow users to explore the content? Or how does it not? Related to compellingness component: 7. The infographic grabs users' attention. [Yes or No] How does this infographic grab users’ attention? Or how does it not? 8. The infographic holds users' attention. [Yes or No] How does this infographic hold users’ attention? Or how does it not? 9. The infographic shares a provocative idea or problem. [Yes or No] How does this infographic share a provocative idea or problem? Or how does it not? 10. The infographic shares a novel idea or problem. [Yes or No] How does this infographic share a novel idea or problem? Or how does it not? 11. The infographic uses storytelling to deliver the message. [Yes or No] How does this infographic use storytelling to deliver the message? Or how does it not? 12. The infographic uses unexpected design elements. [Yes or No] How does this infographic use unexpected design elements? Or how does it now? Related to resonance component: 13. The infographic helps users see how the content is relevant to them. [Yes or No] How does this infographic help users see how the content is relevant to them? Or how does it not? 14. The infographic helps users see connections (e.g., past, present, and future; existing and new ideas and perspectives; theory and practice). [Yes or No] How does this infographic help users see connections? Or how does it not? 15. The infographic evokes users' emotions and memories. [Yes or No] How does this infographic evoke users’ emotions and memories? Or how does it not? 16. The infographic is credible (e.g., includes reliable content from trusted sources). [Yes or No] How is this infographic credible? Or how is it not? Related to coherence component: 17. The infographic presents a complete message. [Yes or No] How does this infographic present a complete message? Or how does it not? 18. The infographic presents a well-formed message. [Yes or No] How does this infographic present a wellformed message? Or how does it not? 19. The infographic is logically structured. [Yes or No] How is this infographic logically structured? Or how is it not? 20. The infographic's message is clear. [Yes or No] How is this infographic’s message clear? How is it not?
Getting Graphic About Infographics 9 ● ●
21. The infographic includes relevant text and images. [Yes or No] How does this infographic include relevant text and images? Or how does it not? 22. The infographic includes consistent design elements. [Yes or No] How does this infographic include consistent design elements? Or how does it not? Additional comments or insights about this infographic?
Figure 2. Aesthetic Learning Experiences Analysis Instrument. Four different reviewers took part in the analysis using the aforementioned instrument (see Figure 2). We approached our analysis similar to a Quality Matter’s online course review by randomly assigning three reviewers to analyze and review each of the 20 infographics. Three of the four reviewers had doctorates in education and experience teaching instructional message design at the college level; the fourth reviewer was a doctoral student with a background in graphic design. The reviewers were geographically dispersed. Therefore, the reviews were conducted using Qualtrics—a Web-based survey application. Once each infographic had been reviewed by three different reviewers, the results were downloaded from Qualtrics, compiled, and analyzed. If two of the three reviewers answered yes for a specific question—that is, identified a part of the aesthetic learning framework (see Figure 2)—an infographic received a point, for a total possible score of 22 points. The open-ended justifications were analyzed for themes and used to support and further elucidate each question. The infographics were ranked according to their final score. Results As students develop their visual literacy, they begin to understand that every visual choice the artist has made, every detail regarding subject and color and composition, conveys information that informs the reader. ~ Beth Olshansky
Some of the infographics scored well on the instrument. For instance, both the “Bearded Men” (see http://goo.gl/qnSKvJ) and the “What Are the Odds?”(see http://goo.gl/4tt5f7) received 20 out of 22 possible points (see Table 2), which means that reviewers identified 90.91% of the aesthetic learning experience situational qualities (listed in Figure 2) in these two infographics. Other infographics, like “The Evolution of Typology,” did not score as well (see Table 2). A low score simply means that, even though the infographics are popular and well “liked,” reviewers did not see many of the situational qualities exhibited in them. As a whole, though, 14 of the 20 infographics were rated as having more than half of the situational qualities.
Getting Graphic About Infographics 10 Table 2 Total Points for Each Infographic Infographic Bearded men What are the odds? The evolution of geek The world of beer Should I text him? Are you happy? Your handwriting Diagrams Rule The Mobile Market Untranslatable Words Mac vs. PC Mission(s) to Mars Kitchen Cheat Sheet Tale of Two Cows Marketing & Social Media Social Media Specs Why Startups Fail New World Marketing Social Media Yearbook The Evolution of Typography
Points*
Percent
20 20 18 17 17 15 15 15 14 14 13 13 13 12 11 10 9 8 8 5
90.91% 90.91% 81.82% 77.27% 77.27% 68.18% 68.18% 68.18% 63.64% 63.64% 59.09% 59.09% 59.09% 54.55% 50.00% 45.45% 40.91% 36.36% 36.36% 22.73%
*There were 22 points possible The reviewers found, however, that certain components of the Aesthetic Learning Experience Framework were identified more frequently in popular infographics than others (see Table 3, Table 4, and Table 5). For instance, coherence was identified in 81% of the infographics, followed next by resonance. But immediacy, compellingness, and malleability were all identified in less than half of the infographics (see Table 3). Table 3 Situational Qualities Present Across All of the Top 20 “Liked” Infographics Total Points
% of Infographics
Per Situational Quality
With This Situational Quality
Immediacy (3 questions)
32 points (out of 60)
53%
Malleability (3 questions)
26 points (out of 60)
43%
Compellingness (6 questions)
62 points (out of 120)
52%
Resonance (4 questions)
55 points (out of 80)
69%
Coherence (6 questions)
97 points (out of 120)
81%
Situational Quality
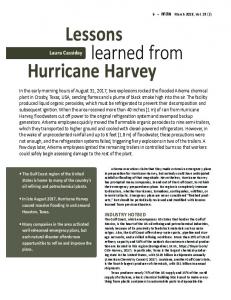
Getting Graphic About Infographics 11 To visualize the findings, a chart was created (see Figure 3). The shaded regions are those that were identified by the reviewers as elements present in each infographic reviewed. The chart made it possible to easily determine which situational qualities were present across all or most of the reviewed infographics, specifically relevant text/images and consistent design (both related to the coherence component), grabs attention and holds attention (both related to the compellingness component), and users see connections (related to the resonance component). The chart also made it easy to see which situational qualities were absent from many of the reviewed infographics, such as uses storytelling (4 out of 20), apply content (5 out of 20), and novel idea/problem (7 out of 20); uses storytelling and novel idea/problem are related to the compellingness component, and apply content is related to the malleability component (see Figure 3 and Table 5). Another way to think about the data is to focus on the percentages. When looking at immediacy, one can see that the results ranged from 40% − 55% (see Table 4). There was more variability, though, in malleability. For instance, only 23% of the infographics in this sample enabled users to apply the content in various ways. Compellingness also had a lot of variance. While 86% of the infographics grabbed users’ attention, only 18% used storytelling to deliver the message (see Table 4). Resonance, on the other hand, had an outlier with helps the user see connections showing up in 86% of the infographics, whereas the other questions ranged from 45% to 50%. Coherence, the last of the situational qualities, scored higher than the others. This finding revealed that the majority of infographics reviewed included relevant text and images, consistent design elements, a complete message, and were logically structured (see Table 5).
New world marketing
The evolution of geek
The world of beer
The mobile market
What are the odds?
Social media yearbook
Should I text him?
Untranslatable words
Why startups fail
The evolution of typography
Are you happy?
Your handwriting
Social media specs
Tale of two cows
Mac vs. PC
Mission(s) to Mars
Diagrams Rule
Marketing & social media
Kitchen Cheat Sheet
Sense of urgency Sense of excitement Encourages to take action Apply content in ways Determine personal meaning Explore the content Grabs attention Holds attention Provocative idea / problem Novel idea / problem Uses storytelling Unexpected design Users see relevance Users see connections Evokes emotions / memories Credible Complete message. Well-formed message Logically structured Message is clear Relevant text / images Consistent design
Bearded men
Getting 12 Graphic About Infographics
1 1 1 -1 1 1 1 1 1 -1 1 1 1 1 1 1 1 1 1 1 20
1 -1 ---1 ------1 --1 -1 -1 1 8
1 1 --1 -1 1 1 -1 1 1 1 1 1 1 1 1 1 1 1 18
-1 1 1 1 1 1 1 -1 --1 1 1 -1 1 1 1 1 1 17
1 1 -1 1 1 1 -1 ----1 1 1 1 --1 1 1 14
1 1 1 --1 1 1 1 1 1 1 1 1 1 1 1 1 1 1 1 1 20
----1 -1 1 ---1 -1 1 -----1 1 8
-1 1 1 -1 1 1 1 1 1 -1 1 1 -1 1 1 -1 1 17
1 1 1 ---1 1 -1 ---1 1 -1 1 1 1 1 1 14
-----1 1 -1 1 -1 -1 -1 ----1 1 9
------1 ----1 -1 ------1 1 5
1 -1 -1 -1 1 1 ---1 1 1 -1 1 1 1 1 1 15
-1 --1 1 1 1 1 ---1 1 1 -1 1 1 1 1 1 15
--1 --1 -1 -----1 --1 1 1 1 1 1 10
------1 1 --1 -1 1 -1 1 1 1 1 1 1 12
-1 --1 1 1 1 1 ---1 1 -1 1 -1 -1 1 13
1 1 ---1 1 1 -----1 -1 1 1 1 1 1 1 13
1 1 1 -1 1 1 1 1 1 -1 -1 1 ----1 1 1 15
--1 1 --1 ------1 -1 1 1 1 1 1 1 11
-1 1 1 -1 1 1 ----1 --1 -1 1 1 1 1 13
Figure 3. Visual Illustration of the Rating Results.
Getting Graphic About Infographics 13 Table 4 Total Points for Top 20 “Liked” Infographics per Situational Quality of the Aesthetic Framework Immediacy The infographic creates a sense of excitement. The infographic encourages users to take action. The infographic creates a sense of urgency.
32 points 12 11 9
48% 55% 50% 40%
Malleability The infographic allows users to explore the content. The infographic enables users to apply the content in various ways. The infographic allows users to determine their own personal meaning and relevance.
26 points 12 5 9
39% 55% 23% 41%
Compellingness The infographic grabs users' attention. The infographic holds users' attention. The infographic shares a provocative idea or problem. The infographic uses unexpected design elements. The infographic shares a novel idea or problem. The infographic uses storytelling to deliver the message.
62 points 19 15 10 7 7 4
47% 86% 68% 45% 32% 32% 18%
Resonance The infographic helps users see how the content is relevant to them. The infographic helps users see connections. The infographic evokes users' emotions and memories. The infographic is credible.
55 points 10 19 11 10
64% 45% 86% 50% 45%
Coherence The infographic includes relevant text and images. The infographic includes consistent design elements. The infographic presents a complete message. The infographic is logically structured. The infographic's message is clear. The infographic presents a well-formed message.
97 points 20 20 15 15 14 13
73% 91% 91% 68% 68% 64% 59%
Getting Graphic About Infographics 14 Table 5 Ranking of Points Per Question for the Top 20 “Liked” Infographics
Questions Based on the Aesthetic Framework The infographic includes relevant text and images. (Coherence) The infographic includes consistent design elements. (Coherence) The infographic grabs users' attention. (Compellingness) The infographic helps users see connections. (Resonance) The infographic holds users' attention. (Compellingness) The infographic presents a complete message. (Coherence) The infographic is logically structured. (Coherence) The infographic's message is clear. (Coherence) The infographic presents a well-formed message. (Coherence) The infographic allows users to explore the content. (Malleability) The infographic creates a sense of excitement. (Immediacy) The infographic encourages users to take action. (Immediacy) The infographic evokes users' emotions and memories. (Resonance) The infographic shares a provocative idea or problem. (Compellingness) The infographic helps users see how the content is relevant to them. (Resonance) The infographic is credible. (Resonance) The infographic allows users to determine their own personal meaning and relevance. (Malleability) The infographic creates a sense of urgency. (Immediacy) The infographic uses unexpected design elements. (Compellingness) The infographic shares a novel idea or problem. (Compellingness) The infographic enables users to apply the content in various ways. (Malleability) The infographic uses storytelling to deliver the message. (Compellingness)
Total Points
%
20 20 19 19 15 15 15 14 13 12 12 11 11 10 10 10
91% 91% 86% 86% 68% 68% 68% 64% 59% 55% 55% 50% 50% 45% 45% 45%
9
41%
9 7 7 5 4
40% 32% 32% 23% 18%
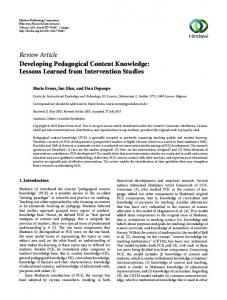
The reviewers also responded to prompts associated with each question on the Aesthetic Learning Experiences Analysis Questionnaire, such as How does the infographic create a sense of urgency? Or how does it not? Reviewers also answered the following general question for each reviewed infographic: In your own words, why do you think people like this infographic? Figure 4 illustrates some of the themes that emerged from these comments. The design aspects of the reviewed infographics most frequently mentioned by reviewers as influencing infographic effectiveness were funny, amusing, [engaging, relevant] topic, interesting, easy, simple, and [use of] colors (see Figure 4).
Getting Graphic About Infographics 15
Figure 4. Word Cloud of Reviewers’ Comments. Discussion and Implications The best design gets out of the way between the viewer’s brain and the content. ~ Edward Tufte
The situational qualities defined in the aesthetic learning experience framework as a whole were well reflected in several of the most “liked” infographics. Each of the most “liked” infographics tended to have coherence and resonance and almost half of them had a sense of compellingness and immediacy. However, very few of them had a sense of malleability. While the fourth question about “applying content in various ways” (see Figure 2) could be amended and, therefore, result in a better malleable rating, it could simply suggest that likeable infographics are not meant to be malleable. Thinking of infographics in terms of an aesthetic learning experience is just one way to focus on the elements of good infographics. As the popularity of infographics increases, researchers and educators are bound to find new ways to analyze and conceptualize what makes an effective infographic. However, our results suggest, that these situational qualities can serve as useful guidelines for designing effective infographics for use in educational settings. Throughout the rest of the paper, we will highlight some practical implications of our exploration of popular infographics. General design recommendations Throughout our own investigation of popular infographics, it became clear that an infographic approach is not appropriate for all messages. However, an effective infographic may be a valuable component of a multi-strategy approach to fulfilling instructional goals. To avoid using an infographic approach when another approach would be more effective, educators, specifically instructional designers, should first conduct a front-end analysis to collect necessary information about the content, learning objectives, learners, and context, and then select the instructional approach that best helps achieve the defined instructional goals.
Getting Graphic About Infographics 16 Once an educator has determined that using an infographic makes instructional sense (given one’s context and learners), he or she must keep in mind that infographics are not simply information plus graphics. The design of an infographic is a narrative process that involves representation and interpretation to develop and convey an idea (Franchi, 2012). Effective infographics rely primarily on visual elements and structure, as opposed to text, to convey content/messages. An infographic’s visual elements are not decorative in nature, but used instead to deliver content vital to the representation and interpretation of the instructional message/narrative. It is necessary, therefore, to spend considerable time on the design and evaluation of visual elements to make sure they accurately convey the instructional message to the learning audience. Our inquiry highlights that effective infographics often have an unexpected element, such as the use of humor, metaphor, storytelling, or even personal anecdotes. A front-end analysis— even if abbreviated given time and resource constraints—will provide information about the content and learners that can help in determining what unexpected element might be an effective aspect of the infographic. Certain aspects of the situational qualities are challenging to represent in the relatively static infographic format, specifically those aspects associated with malleability. To achieve malleability, incorporating reflection prompts and questions encourage learners to tie the visual to their own personal meaning and relevance. In addition, when appropriate, given the content and learning objectives, educators should avoid using a visual structure that drives learners sequentially through the content; instead, they should design the infographic to allow multiple pathways so learners can be immersed in what is relevant to them. Structure and form design recommendations We also found that effective infographics concisely stick to the equivalent of 1-2 pages. In other words, an effective infographic is not a multi-page handout. While infographics traditionally are not designed to be printed, an educator should strive whenever possible to keep an infographic to one page so that that all elements of an effective infographic contribute to the delivery of the message. When designing an infographic, one should continuously examine the infographic to make sure that only essential content is clearly, precisely and concisely conveyed. Frequent formative evaluations with learners who represent the learning audience can provide invaluable feedback to inform the editing process. Effective infographics also have clear titles and quickly establish their focus and purpose (via concise text and the overall visual structure). Finally, effective infographics should include a title that quickly establishes what the infographic is about, and, if needed, provide orienting text that helps learners understand the relevance of the infographic. Content design recommendations Our inquiry also demonstrated that effective infographics have a clear focus and purpose. When creating an infographic, educators should focus on only one learning objective (or 1-3
Getting Graphic About Infographics 17 associated learning objectives). When multiple learning objectives need to be addressed, one should consider using a different instructional approach such as a multi-page handout. While an infographic must be efficient and succinct, educators need to be careful not to leave out important content or mislead the learner. As Tufte (2006) pointed out, “cosmetic decoration...will never salvage an underlying lack of content” (p. 34). In other words, the visual appeal of an infographic will not make up for “bad” content. Educators should ensure that the content conveyed by the infographic is accurate, complete, and relevant. This verification can be provided by conducting formative evaluations to confirm that the content conveyed is appropriate (and accurate) given the learning objective and instructional goals. Visual design recommendations We also found that effective infographics use relevant images, whereas less effective infographics include decorative visuals that serve as distractions to the message (see Levin, 1981; Tufte 2006). Educators need to ensure that all visual elements are contributing to the conveyance of the instructional message and eliminate those that only function as decoration. Effective infographics employ visual representations of relationships to convey content within context. For example, if the message of the infographic describes a sequential progression such as change over time, a linear structure is used to lay out visual elements. Educators, therefore, could use a visual that illustrates (a) flow (e.g., flowchart) if they want to show process, (b) structure (e.g., hierarchical chart) if they want to show classification, (c) cluster (e.g., Venn diagram) if they want to show grouping relationships, (d) radiate (e.g., concept map) if they want to show connections between links and nodes, (e) pictorial (e.g., road map) if they want to show realistic concepts, and (f) display (e.g., bar chart) if they want to show comparison and contrast or cause and effect (Duarte 2008). At the same time, related, effective infographics often use simple visuals as opposed to high fidelity visuals to maintain focus on important aspects of the message. Thus, infographic designers should focus on creating efficient, precise, and clear visuals that support the instructional goals of the message and eliminating details that serve as distractions from the primary goals of the infographic,thus taking responsibility for the total message. Conclusion We now live in a world where information is potentially unlimited. Information is cheap, but meaning is expensive. Where is the meaning? Only human beings can tell you where it is. We’re extracting meaning from our minds and our own lives. ~ George Dyson
Visual literacy has emerged as an important educational outcome (Avgerinou & Ericson, 1997; Davidson, 2014; Metros, 2008), especially in educational programs and courses that emphasize instructional message design. Due to the increase of visuals and, specifically, infographics, educators have begun exploring how to use infographics in the classroom (see Davidson, 2014; Lamb et al., 2014; Marcel, 2014; Vanichvasin, 2013). Despite this increased interest and the volumes of general visual-design literature on the benefits of visuals and how best to convey data to support engagement, cognitive processing, and conceptual understanding
Getting Graphic About Infographics 18 (e.g., Fleming & Levie, 1993; Tufte 1983, 2006), there is little research about the benefits and effectiveness of infographics used for educational purposes (Kos & Sims, 2014). Effective infographics can support learning objectives and instructional goals because they involve a type of reading and/or viewing experience that encourages critical thinking and processing. Franchi (2012), a renowned information designer, referred to this as infographic thinking—the cognitive processing of content or a narrative represented and interpreted visually. We set forth to explore what makes an infographic good. In the absence of a validated instrument, we turned to the Aesthetic Learning Experience Framework to create an instrument to explore popular infographics. Our inquiry was meant to be exploratory in nature, to serve as a starting place for other researchers and practitioners to begin systematically exploring the power of infographics and how they can or should be used in the classroom. While additional research needs to be conducted to further support our findings, we found that popular infographics lacked consistency across infographics qualities and characteristics. For instance, some of the infographics included in the list of the 20 most popular infographics would more accurately be labelled as multi-page handouts. We also found that while there might not be one set of guidelines that make all infographics “good,” there are some strategies educators can follow, especially in the early stages of infographic development, to create a good infographic. Based on the results of our inquiry, we have redesigned instructional activities in our own courses to help students develop the knowledge and skills needed to be better consumers and designers of infographics.
Getting Graphic About Infographics 19 References Avgerinou, M., & Ericson, J. (1997). A review of the concept of visual literacy. British Journal of Educational Technology, 28(4), 280-291. Bishop, M. J. (2014). Instructional message design: Past, present, and future relevance. In J. M., Spector, M. D. Merrill, J. Elen, & M. J. Bishop (Eds.), Handbook of research on educational communications and technology (pp. 373-383). New York, NY: Springer. Braden, R. A. (1996). Visual literacy. In D. H. Jonassen (Ed.), Handbook of research for educational communications and technology (pp. 491-520). New York, NY: Simon & Schuster Macmillan. Centers for Disease Control and Prevention (2012, May). Infographics. Retrieved from http://www.cdc.gov/socialmedia/tools/infographics.html Chabris, C. F., & Simons, D. (2009). The invisible gorilla: And other ways our intuitions deceive us. New York, NY: Broadway Books. Clark, R. C., & Lyons, C. (2010). Graphics for learning: Proven guidelines for planning, designing and evaluating visuals in training materials. San Francisco, CA: Pfeiffer. Clark, R. C, & Mayer, R. E. (2011). e-Learning and the science of instruction: Proven guidelines for consumers (3rd ed.). San Francisco, CA: John Wiley & Sons. Davidson, R. (2014). Using infographics in the science classroom. The Science Teacher, 81(3), 34-39. Duarte, N. (2008). Slideology: The art and science of creating great presentations. Sebastopol, CA: O’Reilly. Author Educause Learning Initiative (2013). Seven things you should know about infographic creation tools. Boulder, CO: EDUCAUSE. http://net.educause.edu/ir/library/pdf/ELI7093.pdf Edwards, P. A. (2010). Reconceptualizing literacy. Reading Today, 27(6), 22. Felten, P. (2008). Visual literacy. Change: The magazine of higher learning, 40(6), 60-64. Fleming, M., & Levie, W. H. (1993). Instructional message design: Principles from the behavioral sciences (2nd ed.). Englewood Cliffs, NJ: Educational Technology. Franchi, F. (2012). On visual storytelling and new languages in journalism [video podcast]. Retrieved from http://vimeo.com/35951116 Fransecky, R. B., & Debes, J. L. (1972). Visual literacy: A way to learn—A way to teach. Washington, DC: Association for Educational Communications and Technology. Hawkins, J., & Blakeslee, S. (2004). On intelligence. New York, NY: St. Martin’s Griffin. Heath, C., & Heath, D. (2007). Made to stick: Why some ideas survive and others die. New York, NY: Random House. Heinich, R., Molenda, M., & Russell, J. (1982). Instructional media and the new technologies of instruction. New York, NY: Macmillan. Januszewski, A., & Molenda, M. (Eds.). (2008). Educational technology: A definition with commentary. New York, NY: Routledge. Jensen, E. (1998). Teaching with the brain in mind. Alexandria, VA: ASCD. Kos, B. A., & Sims, E. (2014). Infographics: The new 5-paragraph essay. Paper presented at the Rocky Mountain Celebration of Women in Computing 2014. Retrieved from http://scholar.colorado.edu/cgi/viewcontent.cgi?article=1001&context=atlas_gradpapers Koszalka, T. A., Russ-Eft, D. F., & Reiser, R. (2013). Instructional designer competencies: The standards (4th ed.). Charlotte, NC: Information Age. Kirschner, P. A., & van Merriënboer, J. J. (2013). Do learners really know best? Urban legends in education. Educational Psychologist, 48(3), 169-183. Krum, R. (2014). Cool infographics: effective communication with data visualization and design. Indianapolis, IN: Wiley. Lamb, G. R., Polman, J. L., Newman, A., & Smith, C. G. (2014). Science news infographics: Teaching students to gather, interpret, and present information graphically. The Science Teacher, 81(3), 25-30. Lankow, J., Ritchie, J., & Crooks, R. (2012). Infographics: The power of visual storytelling. Hoboken, NJ: John Wiley & Sons. Levin, J. R. (1981). On the functions of pictures in prose. In F. J. Pirozzolo & M. C. Wittrock (Eds.), Neuropsychological and cognitive processes in reading (pp. 203-228). San Diego, CA: Academic Press.
Getting Graphic About Infographics 20 Lohr, L. (2007). Creating graphics for learning and performance: Lessons in visual literacy (2nd ed.). Upper Saddle River, NJ: Pearson. Marcel, F. (2014). Infographics and data visualization tools to engage your language learners. Contact, 40(1), 44-50. Medina, J. (2008). Brain rules: 12 principles for surviving and thriving at work, home, and school. Seattle, WA: Pear Press. Melson, A. (2012, July). Infographic submission sites: The good, mediocre and ones to avoid. Seerinteractive.com Blog. Retrieved from http://www.seerinteractive.com/blog/ infographic-submission-sites-the-good-mediocre-ones-to-avoid Metros, S. E. (2008). The educator’s role in preparing visually literate learners. Theory into Practice, 47, 102109. Moore, D. M., & Dwyer, F. M. (Eds.) (1994). Visual literacy: A spectrum of visual learning. Englewood Cliffs, NJ: Educational Technology Publications. Oetting, J. (2015, February). The science behind why our brains crave infographics (In an Infographic). Agency Post. Retrieved from http://blog.hubspot.com/agency/science-brains-crave-infographics Parrish, P. (2009). Aesthetic principles for instructional design. Educational Technology Research & Development, 57, 511-528. Author Pashler, H., McDaniel, M., Rohrer, D., & Bjork, R. (2008). Learning styles concepts and evidence. Psychological Science in the Public Interest, 9(3), 105-119. Pavio, A. (1971). Imagery and verbal processes. Hillsdale, NJ: Lawrence Erlbaum Associates. Pettersson, R. (2009). Visual literacy and message design. TechTrends, 52(2), 38-40 Reiser, R. A. (2001a). A history of instructional design and technology: Part I: A history of instructional media. Educational Technology Research and Development, 49(1), 53-64. Reiser, R. A. (2001b). A history of instructional design and technology: Part II: A history of instructional design. Educational Technology Research and Development, 49(2), 57-67. Sacks, O. (1996). An anthropologist on Mars. New York, NY: Alfred A. Knopf. Sacks, O. (1998). The man who mistook his wife for a hat: And other clinical tales. New York, NY: Simon and Schuster. Smiciklas, M. (2012). The power of infographics: Using pictures to communicate and connect with your audiences. Indianapolis, IN: Que. Sugar, W., Brown, A., Daniels, L, & Hoard, B. (2011). Instructional design and technology professionals in higher education: Multimedia production knowledge and skills identified from a Delphi study. The Journal of Applied Instructional Design, 1(2), 30-46. Sugar, W., Hoard, B., Brown, A., & Daniels, L. (2012). Identifying multimedia production competencies and skills of instructional design and technology professionals: An analysis of recent job postings. Journal of Educational Technology Systems, 40(3), 227-249. Tufte, E. R. (2006). Beautiful evidence. Cheshire, CT: Graphics Press. Tufte, E. R. (1983). The visual display of quantitative information. Cheshire, CT: Graphics Press. Vanichvasin, P. (2013). Enhancing the quality of learning through the use of infographics as visual communication tool and learning tool. In the Proceedings ICQA 2013: The International Conference on QA Culture: Cooperation or Competition 2013 (pp. 135-142). Tung Phayathai, Ratchathewi, Bangkok: Offset Plus. Retrieved from http://www.icqa2014.com/downloads/Proceeding_29.pdf Ware, C. (2012). Information visualization: Perception for design. Waltham, MA: Elsevier. Wallace, G. W. (2011). Why is the research on learning styles still being dismissed by some learning leaders and practitioners? eLearn Magazine. Retrieved from http://elearnmag.acm.org/featured.cfm?aid=2070611 Williams, R. (2004). The non-designer’s design book. Berkeley, CA: Peachpit Press. Zull, J. E. (2002). The art of changing the brain. Sterling, VA: Stylus.