Hydrobiologia 422/423: 465–475, 2000. M. Jungwirth, S. Muhar & S. Schmutz (eds), Assessing the Ecological Integrity of Running Waters. © 2000 Kluwer Academic Publishers. Printed in the Netherlands.
465
GIBSI – An integrated modelling system prototype for river basin management A. N. Rousseau1 , A. Mailhot1, R. Turcotte1 , M. Duchemin1, C. Blanchette1 , M. Roux1 , N. Etong1, J. Dupont2 & J.-P. Villeneuve1 1 INRS-Eau,
2800 rue Einstein C.P. 7500, Sainte-Foy, Qu´ebec, Canada G1V 4C7 E-mail:
[email protected] 2 Minist`ere de l’Environnement et de la Faune du Qu´ebec, 675, Boul. Ren´e-L´ ´ evesque Est, 7i`eme Etage, Qu´ebec, Canada G1R 5V7 Key words: integrated modelling system, river basin management, hydrology, soil erosion, agricultural-chemical transport, water quality
Abstract This paper introduces GIBSI, an integrated modelling system prototype designed to assist decision makers in their assessment of various river basin management scenarios in terms of standard water physical and chemical parameters and standards for various uses of the water. GIBSI runs on a personal computer and provides a userfriendly framework to examine the impacts of agricultural, industrial, and municipal management scenarios on water quality and yield. A database (including spatial and attribute data) and physically-based hydrological, soil erosion, agricultural-chemical transport and water quality models comprise the basic components of the system. A geographical information system and a relational database management system are also included for data management and system maintenance. This paper illustrates potential uses of GIBSI by presenting two sample applications applied to a 6680 km2 complex river basin (63.2% forest, 17.2% agricultural land, 15.3% bush, 3.1% urban development and 1.2% surface water; population: 180 000) located in Québec, Canada: (i) a timber harvest scenario and (ii) a municipal clean water program scenario. Simulation results of the timber harvest scenario showed how clear-cut activities could lead to earlier and larger spring runoff than in the investigated reference state. Results of the municipal clean water scenario revealed that substantial reduction in coliform counts and total phosphorus could be made by constructing and operating wastewater treatment plants. These applications provide a framework of how GIBSI can be used as a decision support system and ultimately as a means of incorporating sound science into political decisions involving river basin management. Introduction In Québec, surface water accounts for more than 80% of the drinking water supply and, not surprisingly, plays an important role in the economy. Over the course of the last 40 years, the natural state of these waters, as well as those in the rest of Canada, has been affected by acid rain, surface runoff, and waste water discharges from urban, industrial, agricultural and rural sources. In certain regions of the country, these inputs have caused important changes to some aquatic ecosystems and, consequently, seriously impacted some traditional surface water uses such as sport fishing and swimming. On the other hand, dur-
ing the same period, Canada experienced economic growth so that the population now enjoys one of the highest standards of living in the world. Unfortunately, as these facts indicate, industrial development and economic growth are almost always accompanied by a depreciation in the quality of natural water resources. The above ecological-economic paradox is a motivation for river basin management. Because of this, project feasibility studies for industrial, forestry, urban, and agricultural developments need to balance economic growth with the preservation of ecological integrity, biological diversity, and social equity of all community members, as well as, future generations. Consequently, in addition to economic projections,
466 such studies should include a complete investigation of the total impact of a project on the water quality and yield of a river basin. The present state of the art of hydrological modelling and software engineering has reached a point where it is now possible to construct integrated modelling systems capable of simulating the impacts of various management practices (i.e. industrial, municipal and agricultural) on the water quality and yield of a river basin. These systems, which ought to be user-friendly for decision makers, must be based on sound hydrological modelling systems and efficient data management systems to better understand the processes causing changes and to predict the impacts of specific actions before problems occur. The integrated modelling system GIBSI (Gestion Intégrée des Bassins versants à l’aide d’un Système Informatisé) is a prototype designed to incorporate the above aspects (Villeneuve et al., 1998). For the decision maker, GIBSI offers the ability to predict the impacts of industrial, forestry, urban, and agricultural projects with respect to targeted water quality and yield standards for various uses of the water (i.e. agricultural, fish and wildlife, industrial, recreational). The scope of this paper is to present: (i) the basic features of GIBSI, and (ii) two sample applications on a complex Québec river basin: a timber harvest scenario and a municipal clean water program scenario.
The integrated modelling system GIBSI proposes a scenario approach to evaluate the impacts of municipal, industrial, forestry, and agricultural projects on the water quality and yield of a river basin. Two types of users have been identified: the technical expert and the water resources manager. The former is responsible for setting up the system on a study river basin, while the latter elaborates scenarios and performs simulations. Basic components of the system GIBSI is comprised of a database, a Relational DataBase Management System (RDBMS), physicallybased simulation models (hydrology, soil erosion, agricultural-chemical transport, and water quality), management models (point source, agricultural nonpoint source and reservoir management models) and a Geographic Information System (GIS). The GIS used is GRASSLAND (L.A.S., 1996), an open GIS built
around GRASS (U.S. Army Corps of Engineers – CERL, 1988). MicrosoftAccessTM (Simpson, 1994) is the RDBMS of all relevant attribute data. The database includes spatial and attribute data (e.g. digital elevation model, meteorological data, soil database, gauge station locations, simulation results, quantitative and qualitative data associated with administrative units such as municipalities: livestock production, crop management, etc.) required for constructing a scenario and running a simulation. A complete description of the database is presented by Villeneuve et al. (1998). From a software engineering standpoint, GIBSI is modular; this structure allows, if necessary, for integration of new system components or replacement of existing ones (e.g. simulation models, RDBMS, GIS) with other commercial software. Interactions between users and system components are made through a single interface. Finally, GIBSI runs on a personal computer and does not require extensive computing equipment. Simulation models, computational domains, and output variables The hydrological model is HYDROTEL (Fortin et al., 1995), a distributed physically-based model compatible with remote sensing and GIS. Revised algorithms of the USLE (Wischmeier & Smith, 1978) and Yalin’s (1963) sediment transport equation are used to model soil erosion and the inherent sediment transport. Modelling of agricultural-chemical transport and transformations are based on the nitrogen, phosphorus and pesticide transport algorithms of SWAT (Arnold & Williams, 1995) and EPIC (Williams, 1995). Finally, the water quality model is built around QUAL2E (Brown & Barnwell, 1987), a standard water quality model which simulates: (i) dispersion and advection of water contaminants; (ii) algal growth; (iii) nitrogen and phosphorus cycles; (iv) coliform decay; (v) re-aeration; and (vi) water temperature. Also, the sediment routing algorithm of SWAT (Arnold & Williams, 1995), which accounts for stream deposition and bed degradation, has been added to QUAL2E. A detailed description of the simulation models is presented by Villeneuve et al. (1998). The hydrological simulation unit is an elementary drainage basin unit (i.e. area comprised of three soil layers of varying depths and drained by one reach). One-dimensional reaches of uniform hydraulics and biochemical characteristics are used for river flow routing and water quality modelling. The spa-
467 tial simulation unit for modelling soil erosion and agricultural-chemical transport processes is the classified agricultural land use obtained from remote sensing information. The elementary basin units are traced using the basin’s river network and the direction of flow from cell to cell obtained from a digital elevation model. The computational time step is the day. This time scale corresponds to the measurement frequency of meteorological data and is often associated with the application time scale of various agricultural management scenarios (e.g. fertilization dates). From a modelling point of view, the day represents the upper time scale limit for adequate forecasting of flooding events. The list of output variables includes: river flows, sediment loads, coliform counts, water temperature, as well as loads and concentrations of dissolved oxygen, chlorophyll a, dissolved phosphorus and particulate organic phosphorus, particulate organic nitrogen, nitrate-nitrogen, nitrite-nitrogen, ammonia-nitrogen, BOD, and pesticides. Note that in GIBSI the absolute values of these variables may be interpreted in terms of various water quality and yield standards for various uses of the water (i.e. agricultural, fish and wildlife, industrial, recreational). Scenarios, simulations, and interpretation of results GIBSI offers three river basin management models: (i) a point source management model, (ii) an agricultural nonpoint source management model, (iii) and a reservoir management model. These management models, which are described in Villeneuve et al. (1998), allow users to implement various river basin management scenarios. Typical scenarios can be built by modifying: (i) point sources, that is, waste water treatment plant discharge points (e.g., location, connected population, treatment type, load characteristics) and industrial discharge points (e.g. location, load characteristics); (ii) agricultural production systems (e.g. number and type of livestock per administrative units, crop management practices and crop rotation systems, application dates and rates of chemical fertilizers, manure, and pesticides); (iii) land use classes (e.g. global or discrete land use reclassification within a delineated area, that is, from one or several land use categories into another); and
(iv) hydraulics (e.g. addition or removal of reservoirs, hydraulic characteristics of dams). Note that a scenario characterizes a specific state of the study river basin and that any states of the basin can be defined as a reference state. Once a management scenario is defined, the user must select a meteorological series before running a simulation (i.e. coupling of a scenario and meteorological data). Selection of meteorological data usually implies a simple statistical analysis of the selected data set so the simulation results can be linked to specific conditions (e.g. wet and dry periods, seasons or years). It is noteworthy that the simulation period corresponds to the time span of the selected meteorological data set. Simulation results are saved in the database along with a text file containing a complete description of the simulation context (e.g. comment lines describing the scenario and meteorological series). A particular value of GIBSI over other integrated modeling systems such as NELUP (O’Callaghan, 1995), WaterWare (Jamieson & Fedra, 1996), PÉGASE (Smitz et al., 1997), and BASINS (US EPA, 1997) is that it provides a user-friendly framework to examine the impacts of various agricultural, industrial, and municipal management scenarios on water quality and yield in terms of specific meteorological conditions, as simulation during wet versus dry periods can yield very different results. Interpretation of results, using thematic maps and graphs, is based on comparing the reference state with results obtained either from combinations of different scenarios and one meteorological series or from combinations of one scenario and different meteorological series. A prototype for connecting river water quality and flow regime to the ecological assessment of running waters The simulated values of the physical and chemical parameters of water produced by GIBSI may be interpreted in terms of various water use standards. In this way, GIBSI provides a means to identify the river segments which may be suitable for specific water uses (e.g. source of drinking water, recreational boating or swimming, etc.). Additionally, if an in situ appraisal of the ecological integrity of several river segments is known, the simulated values of the physico-chemical parameters may be used to complement the ecological assessment of a watercourse. Following this line of reasoning, if there exists a reliable watershed database
468 documenting the evolution of riparian vegetation, biotic community, land use, and hydrographic network (including identification of straightened out meanders and artificial river banks and floodplains), the prototype may be used to investigate the impact of anthropogenic disturbances on the natural state of relevant aquatic habitats. For example, for a given reference state and a given scenario characterizing two different time horizons of a watershed (baseline state and any other states), GIBSI could be used to estimate the river flow regime and the river water quality associated with the relevant aquatic ecosystems. In that sense GIBSI represents a valuable prototype for connecting water quality and flow regime of running waters to the in situ watershed assessments of the ecological integrity of running waters.
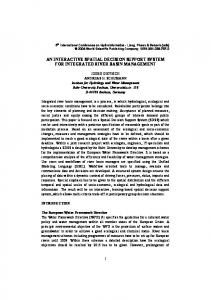
Sample applications The Chaudière River basin was selected as the pilot basin for the development of GIBSI. It is located south of Québec City and covers an area of 6680 km2. It has a population of around 180 000 and is characterized by various land use, agricultural, and industrial activities. This river basin has been designated by the Québec Government as the pilot river basin for a new administrative water management authority. The river basin is representative of most Québec basins, with around 63.2% forest, 17.2% agricultural land, 15.3% bush, 3.1% urban development and 1.2% surface water. Figure 1 presents the principal sub-basins of the Chaudière River basin. In order to illustrate some of the analytical functions of GIBSI, this section presents the results of two sample applications: (i) a timber harvest scenario and (ii) an implementation of a municipal clean water program scenario. In the developmental framework of GIBSI, these scenarios, although fictitious, were used to validate the hydrological and water quality models. Model calibration For this study, model calibration involved calibration of the hydrological and the water quality models. In the case of the latter model, only point sources of pollution were considered and several simplifications and assumptions were made since testing of the erosion and agricultural-chemical models is not completed at this point. Some such simplifications were that contaminant loads from combined sewer overflows,
untreated industrial effluents, as well as leaking septic tanks and surface runoff in rural areas were neglected. In the case of the former model, default management parameters were assumed for reservoir operations. It is beyond the scope of this paper to present this calibration; a description of this exercise has been reported elsewhere (Turcotte et al., 1999). Hydrological model Because there is no gauge station at the Chaudière River basin outlet, calibration of the hydrological model was performed using two years of measured streamflows from the St. Lambert station, which covers 85% of the studied basin. Temporal validation was performed using data from two other years. Spatio-temporal validations were done as well on two different 700 km2 sub-basins: a primarily forested basin, the Famine River basin, and a mostly agricultural basin, the Beaurivage River basin (see Figure 1). Nash-Sutcliffe coefficient values between 0.71 and 0.89 were obtained for all calibration and validation simulations (Turcotte et al., 1999). Moreover, simulated annual water yields were always within 15% of those observed, for both the calibration and validation periods. Water quality model Calibration of the water quality model was done using a year’s worth of measured data obtained from 12 water quality monitoring stations located throughout the studied river basin for a total of 116 data points. The average absolute error between simulated and observed coliform counts (lumped in space) was centred around zero and close to 45% of the errors were less than 150 coliforms per 100 ml, which is quite acceptable considering that the standard for potability of untreated water is 1000 coliforms/100ml. For cases where simulated coliform counts were less than those measured, Turcotte et al. (1999) reported that the errors were most likely linked to the aforementioned assumptions on non-point and point sources of coliforms. For cases where simulated coliform counts were greater than those observed, larger than actual coliform loads and/or smaller than actual streamflows probably explain some of the observed errors (Turcotte et al., 1999). Timber harvest scenario This scenario examines the potential impact of a substantial timber harvest (covering nearly 200 km2 of the
Figure 1. Principal sub-basins of the Chaudi`ere River basin.
469
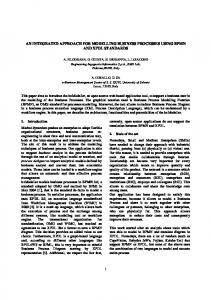
470 6680 km2 Chaudière River basin) on the Famine River sub-basin (see Figure 2). For this scenario, the potential impacts were analysed in terms of two simulated responses at the sub-basin outlet: (i) the annual water yield and (ii) the spring runoff hydrograph. As shown on Figure 2, coniferous forests, deciduous forests and bushes characterizing the reference state, and located in the northern portion of the Famine River sub-basin, were reclassified as clear-cut land (bare soil) – affecting 180 km2 or 27% of the sub-basin area. Since GIBSI does not simulate forest growth, timber harvest was assumed to have taken place in the summer and the simulation period was that of the following year which extended from the current fall season to that of the following year (i.e. November of year 1 to November of year 2). To obtain a representative sample of potential impacts, eight meteorological series were used to generate eight sets of simulation results – where a set was made up of results from the current land use (the reference state) and those from the above clear-cut scenario (the timber harvest scenario). The one-year-long meteorological series were independent of one another and covered the period of November 1985 to November 1995. Figure 3 depicts a set of daily flows simulated with the 12-month meteorological series of November 1986 to November 1987. Only the simulated flows between March 15 and July 15, 1987, are considered for this sample application. Results and discussion Annual water yield Table 1 introduces the results of these simulations. On average (eight sets of simulation results), the timber harvest produced a 72 million m3 increase in annual water yield when compared with the reference state (293 million m3 ). Note that the annual increase in water yield varied between 66 and 76 million m3 with a 3 million m3 standard deviation. In terms of relative increase, the former corresponds to a 16% to 34% increase when compared with the reference state. This timber-harvest-related increase can be partly attributed to a drop in evapotranspiration, which increased the stored water volume and consequently storm runoff. Spring runoff hydrograph Figure 3 shows for the year following timber harvest an earlier spring runoff than that observed for the reference state. Moreover, not only was spring runoff early, but a faster time to peak, a larger spring runoff, and a shorter recession time were predicted. This
Table 1. Simulated annual water yields for the reference state and the timber harvest scenario Simulation period (November to November)
Reference state [106 m3 ]
Timber harvest [106 m3 ]
1984–1985 1985–1986 1986–1987 1987–1988 1988–1989 1989–1990 1990–1991 1991–1992
248 370 226 233 218 483 319 249
315 440 298 307 293 559 392 321
behaviour characterized all sets of simulation results. Lack of tree shading partly explained the aforementioned changes in the spring runoff of the reference state. Consequently, clear-cut areas contributed to faster snowmelt and earlier spring runoff than those observed before timber harvesting. Municipal clean water program scenario Over the course of the last twenty years, the ‘Programme d’assainissement des eaux du Québec’ and the ‘Programme d’assainissement des eaux municipales’ have targeted treatment of municipal wastewater, treatment of effluents from pulp and paper production, and construction of manure storage (Gouvernement du Québec, 1997). With these programs, close to 98% of the Québec population connected to a sewer system will have their wastewater treated by year 2000 (compared with 2% in 1978 and 81% in 1995). One way of partially assessing the impact of these programs on surface water quality is to simulate the implementation of municipal wastewater treatment plants on the Chaudière River basin. This was accomplished by performing one set of simulations involving the following scenarios: (i) a first scenario depicting the 1997 conditions (the reference state) which is referred to as the ‘post municipal clean water program (MCWP) scenario’ and (ii) a second scenario illustrating the initial conditions – before implementation of municipal wastewater treatment plants – which is referred to as the ‘pre-MCWP scenario’. These simulations did not consider contaminant loads from agricultural runoff, combined sewer overflows, or any industries not directly connected to a sewer system. Contaminant loads from septic systems in rural areas were neglected as well. The simulated river flows between March 15 and
Figure 2. Distributed land use: (a) reference state and (b) timber harvest scenario.
471
472
Figure 3. Daily simulated flows for the timber harvest scenario and the reference state at the outlet of the Famine River sub-basin for the 4-month period of March 15 to July 15, 1987.
July 15, 1987, are considered for this sample application. These flows correspond to those of the reference state defined in the above timber harvest application. Figure 4 shows all surveyed municipal and industrial discharge points within the boundaries of the Chaudière River basin. In 1997, 66% of the Chaudière River basin’s population was connected to a sewer system. Out of the 45 surveyed municipal discharge points, only seven did not have their effluent conveyed to a wastewater treatment plant. These points discharged the effluents of about 2% of the population connected to a sewer system. Table 2 presents the types of wastewater treatment plants in operation in the study river basin, their numbers, and the percentage of the population connected to these plants. All municipal loads (before and after plant operation) were estimated from statistical data compiled by the Québec Ministry of Environment and Wildlife (QMEW). The water quality variables considered for this application were concentrations of nitrogen, phosphorus, suspended solids and coliforms. However, for this presentation only total phosphorus and coliform concentrations are introduced and compared with their respective water quality standards set by the QMEW. Results and discussion Coliforms Figure 5 presents simulated coliform concentrations along the Chaudière River between the outlet of Lake Mégantic and the river basin outlet. These concentrations were those for June 25, 1987 – the day associated with the lowest simulated flow at the outlet of the Chaudière River basin. This Figure clearly out-
Figure 4. Surveyed municipal and industrial discharge points within the boundaries of the Chaudi`ere River basin.
lines all municipal discharge points located along this stretch of the Chaudière River. For the post-MCWP scenario, all concentrations are of the order of 10 coliform counts per 100 ml. This represents a major reduction in coliform concentrations compared with the pre-MCWP scenario. This Figure also shows that pre-MCWP concentrations rarely met the threshold concentration, less than 1000 coliform counts per 100 ml (Ministère de l’Environnement du Québec,
473 Table 2. Types of wastewater treatment plants in operation in the Chaudi`ere River basin, their numbers, and the percentage of the population connected to these plants Types of wastewater treatment plants Activated sludge Aerated lagoon Lagoon Biodisk Settling basin
Number of treatment plants
Percentage of the population connected
5 26 4 1 2
54.5 43.5 1 0.5 0.5
1993), for using raw water as drinking water without requiring unconventional treatment. Finally, the postMCWP coliform concentrations were in general lower than those measured and compiled by the QMEW (Simoneau et al., 1998). This is in line with the aforementioned assumptions. Moreover, it suggests that current water quality problems may be partially or totally attributed to agricultural runoff, combined sewer overflows, septic systems of rural housings, and/or inadequately treated discharges from industries not directly connected to a sewer system.
Total phosphorus Figure 6 introduces the evolution of total phosphorus concentration at the river basin outlet. Similar to the above results for coliform counts, the post-MCWP concentrations for total phosphorus were below those for the pre-MCWP scenario. For the post-MCWP scenario, however, the total phosphorus concentration exceeded, for about 30 days of the 65-day simulation period, the threshold concentration for lake eutrophication, less than 0.02 and 0.03 mg/l for lakes and rivers, respectively (Ministère de l’Environnement du Québec, 1993). This finding indicates that there is still room for improvement and hence a need to reduce phosphorus load from the effluents of municipal wastewater treatment plants. Note that the post-MCWP total phosphorus concentrations were in general lower than those measured and compiled by the QMEW (Simoneau et al., 1998). Consequently, this does not exclude the probability that current water quality problems may be caused by agricultural runoff, combined sewer overflows, inefficient septic systems of rural housings, and/or any untreated effluents from industries not directly connected to a sewer system.
Conclusion The sample applications presented in this paper have outlined the simulation and analytical capabilities of the integrated modelling system prototype GIBSI. In the timber harvest application, simulations showed how substantial clear-cut activities could lead to earlier and larger spring runoff than in the investigated reference state. Meanwhile, preliminary results of the municipal clean water scenario revealed that substantial gains in terms of reducing coliform counts and total phosphorus concentrations could be made by constructing and operating wastewater treatment plants. Furthermore, this application suggested that even if all other sources of pollution were controlled, total phosphorus loads from municipal plants could still represent a eutrophication threat to surface water during much of the summer. Most importantly, this paper has demonstrated how an integrated modelling system prototype such as GIBSI can be used to incorporate sound science into the political decisions involving municipal clean water programs and timber harvest scenarios. Other scenarios, particularly those concerned with agricultural runoff, are already in place and being tested on the Chaudière River basin. Finally, future work will involve addition of an economic module for assessing the economic impact of different management scenarios. In a sustainable river basin management context, the use of GIBSI will thus provide decision makers with a complete tool for exploring a variety of integrated management programs. More importantly, the use of GIBSI may help answer issues such as: (i) How should all currently available regulatory and nonregulatory programs involving landowners and governing bodies (i.e. municipal, provincial and federal) be brought together to achieve effective river basin management? (ii) Who should pay for river basin management? and (iii) What should be done to meet clean water objectives?
Acknowledgements The authors wish to thank J. Beauchemin, P. Bolduc, J.-F. Gagnon, D. Maheux, J.-F. Tremblay, and S. Trépanier, all of INRS-Eau, for their important contributions to the development of GIBSI. This work is largely funded by the Ministry of the Environment and Wildlife of Québec.
474
Figure 5. Simulated coliform concentrations along the Chaudi`ere River between the outlet of Lake M´egantic and the river basin outlet for the post- and pre-MCWP scenarios and for June 25, 1987. N.B. Threshold concentration standard or criteria (less than 1000 coliform counts per 100 ml) for using raw water as drinking water without requiring unconventional treatments set by Qu´ebec Ministry of Environment and Wildlife (Minist`ere de l’Environnement du Qu´ebec, 1993).
Figure 6. Evolution of simulated total phosphorus concentrations at the Chaudi`ere River basin outlet for the post- and pre-MCWP scenarios and for the simulation period of March 15 to July 15, 1987. N.B. Threshold concentration standard or criteria (less than 0.02 and 0.03 mg/l for lakes and rivers, respectively) for preventing eutrophication set by Qu´ebec Ministry of Environment and Wildlife (Minist`ere de l’Environnement du Qu´ebec, 1993).
475 References Arnold, J. G. & J. R. Williams, 1995. The EPIC model. In Singh, V. P. (ed.), Computer Models of Watershed Hydrology. Water Resources Publications, Highlands Ranch (CO): 847–908. Brown, L. C. & T. O. Barnwell Jr., 1987. The Enhanced Stream Water Quality Models QUAL2 and QUAL2E-UNCAS: Documentation and User Manual. Athens, Georgia, U.S., Environmental Protection Agency, 189 pp. Fortin, J.-P., R. Moussa, C. Bocquillon & J.-P. Villeneuve, 1995. HYDROTEL, un Modèle Hydrologique Distribué Pouvant Bénéficier des Données Fournies par la Télédétection et les Systèmes d’Information Géographique. Revue des Sciences de l’Eau, 8: 97–124. Gouvernement du Québec, 1997. Symposium sur la Gestion de l’Eau au Québec, Document de Référence. Bibliothèque nationale du Québec, 59 pp. Jamieson, D. G. & K. Fedra, 1996. The WaterWare decision-support system for river-basin planning. 1. Conceptual design. J. Hydrol., 177: 163–175. L.A.S., 1996. Grassland User’s guide for Windows95 and Windows NT, Version 1.0. Logiciels et Applications Scientifiques (L.A.S.) Inc., Montréal. Ministère de l’Environnement du Québec, 1993. Critères de Qualité de l’Eau, 1990 (revised 1992). Service d’évaluation des rejets toxiques et Direction de la qualité des cours d’eau, ministère de l’Environnement du Québec, Québec, 425 pp. O’Callaghan, J. R., 1995. NELUP: an introduction. J. Environ. Planning Manage. 38(1): 5–20. Simoneau, M., L. Pelletier & N. Martel, 1998. Le bassin de la rivière Chaudière: profil géographique, sources de pollution et interventions d’assainisssement. In Ministère de l’Environnement et de la Faune (ed.), Le Bassin de la Rivière Chaudière: l’État
de l’Écosystème Aquatique – 1996, Direction des Écosystèmes Aquatiques, Québec, envirodoq noEN980022. Simpson, A, 1994. Microsoft Access 2. Sybex Inc., San Francisco. Smitz, J., E. Everbecq, J. F. Deliège, J. P. Descy, R. Wollast & J. P. Vanderborght„ 1997. PÉGASE, une méthodologie et un outil de simulation prévisionnelle pour la gestion de la qualité des eaux de surface. Tribune de l’eau, No. 588 (4): 73. Turcotte, R., A. N. Rousseau, A. Mailhot, J.-P. Villeneuve & J. Dupont (1999). GIBSI: an integrated modelling system for sustainable watershed management. In Proceedings of the Environmental Permitting Symposium, Air & Waste Management Association (AWMA) Symposium & Courses, Research Triangle Park, NC, February 17–19, 1999. AWMA, One Gateway Center, Third Floor, Pittsburgh, PA 15222. U.S. Army Corps of Engineers – CERL, 1988. GRASS Reference Manual. Champaign, Ill.: U.S. Army Corps of Engineers – CERL. US EPA, 1997. Basins Fact Sheet. United States Environmental Protection Agency, Office of Water (4505), Washington, DC 20460, EPA-823-F-97-0/0, October 1997. Villeneuve, J.-P., C. Blanchette, M. Duchemin, J.-F. Gagnon, A. Mailhot, A. N. Rousseau, M. Roux, J.-F. Tremblay & R. Turcotte, 1998. Rapport Final du Projet GIBSI, Mars 1998. Rapport No. R-462. INRS-Eau, Sainte-Foy, Québec, 371 pp. Williams, J. R., 1995. The EPIC model. In Singh, V. P. (ed.), Computer Models of Watershed Hydrology. Water Resources Publications, Highlands Ranch (CO): 909–1000. Wischmeier, W. H. & D. D. Smith, 1978. Predicting Rainfall Erosion Losses – A Guide to Conservation Planning. Agricultural Handbook No. 537, U.S. Department of Agriculture, Washington, DC, 58 pp. Yalin, Y. S., 1963. An Expression for Bed-Load Transportation. J. Hydraulic Division, ASCE, 89(HY3): 221–250.