P.H. Shiva Prakash, P.K. Garg and S.K. Ghosh. Geomatics Engineering Section. Department of Civil Engineering ... resources and human habitats. ... sinks so low that rivers and other natural water storage dries up (Prakash et al., 2003).
GIS BASED MODELLING FOR DROUGHT ASSESSMENT P.H. Shiva Prakash, P.K. Garg and S.K. Ghosh Geomatics Engineering Section Department of Civil Engineering Indian Institute opf Technology, Roorkee Roorkee 247667, India
ABSTRACT Disasters are major catastrophic events which are often aggravated by human intervention, resulting in adverse conditions affecting both natural resources and human habitats. Human beings have been hapless victims of recurring disasters. Drought is a 'creeping phenomenon', making its onset and end difficult to determine. In Karnataka, the severity of drought has touched 143 of the 175 taluks covered under 19 out of 27 districts. During drought, agricultural operations are severely affected and huge crop losses are incurred. The State Government had assessed the loss in agriculture, horticulture and animal husbandry sector around Rs.3100 crores in 2002-03. The present study is carried out in Gubbi Taluk of Karnataka to prepare a drought severity map in GIS by integrating 17 parameters in GIS which affect the drought. LISS III images for 1996, 1999 and 2001 have been used for identification of landuse/landcover. The approach included creation of a spatial database and its integration in GIS environment by developing a suitable rating and ranking scheme for the generation of drought severity map. INTRODUCTION Disasters are major catastrophic events caused by vagaries of nature. These are often aggravated by human intervention, resulting in adverse conditions affecting both natural resources and human habitats. Disasters also cause untold misery and havoc to lives and livestock (Rao et al., 2000). Drought is a 'creeping phenomenon', making its onset and end difficult to determine. Its progress is insidious and its effects can be devastating. Drought can occur under different climatic conditions but its recurrence and effects are more pronounced in arid and semi-arid situations (Singh, 2003). Before the drought, the ground water level sinks so low that rivers and other natural water storage dries up (Prakash et al., 2003). It is estimated that 4 billion people – one half of the world’s population will live under conditions of severe water stress by year 2025, with conditions particularly severe in Africa, Middle East and South Asia (Diwan, 2002). India is a large country in terms of geographical area, exhibiting greater agro- climatic variation. The country is susceptible to several natural disasters which are a major constraint to developmental activities. The statistics of the disaster events show the alarming trend (Manikiam, 2003). The problems of drought-prone regions in India vary in magnitude, temporally and spatially. One of the worst natural calamities that affect India is the large-scale incidence of drought during the south-west monsoon season (June to September). Semi-arid region faces the greatest drought hazard and is characterized by low and uncertain crop yields, mostly rainfed. For most of dry crops, the yields are invariably dependant on residual soil moisture storage (Dhopte, 2002).
Even though India has a long history of drought events in the past, it lacks proper drought management strategy at national level yet. In the absence of drought severity map, no drought relief measures and management would be meaningful. All measures taken to combat disasters in general and drought in particular are adhoc in nature. Crop loss assessment due to drought by revenue authorities country-wide used by conventional approach has been in practice in spite of its large amount of subjectivity in the estimation of crop loss since there is no other rational approach in its place. This has given rise to many limitations in the existing approaches which did not work satisfactorily in providing remedy to the problem of drought and its management. It is in the light of frequent drought years, the country needs the drought severity map. Satellite data have been used frequently in the past for the study of disaster and land degradation. The obvious advantage of this data product is its large areal coverage, availability in digital form, multi-temporal and multi-spectral analysis for faster and accurate classification. For qualitative assessment of drought, it is necessary to integrate and study the combined effects of terrain, meteorological and land characteristics of the area, for which GIS is essentially required. GIS in conjunction with remote sensing and ancillary data, can be used to identify drought prone areas. Once the droughts have been identified, their representation can be stored conveniently in GIS databases. GIS technology provides a powerful tool for displaying outputs and permits user to visualise the geographic distribution of impacts and allows the user to perform a quick graphical sensitivity analysis of the factors affecting drought (Gupta, 2003). THE STUDY AREA The study is carried out for Gubbi taluk which is one of the promising and drought prone taluk among ten taluks of Tumkur district, covering an area of about 1223 km2 (11.54% of district). It consists of seven hoblis (a hobli is a cluster of villages) comprising of 348 villages. It has a semi-arid climate, comprising of undulating terrain, dry land cultivation (mostly rainfed) and barren (scrub) land to a larger extent, fallow and degraded grazing lands. The normal rainfall is 572.4mm based on 1901-1970 rainfall data. The major land use/land cover includes mixed cropland which are rain fed, water tanks, vegetation which includes uncropped and plantation, barren land consisting of poor to nil vegetative cover and rocky surface. The majority of the irrigation wells got dried up and groundwater is over exploited. GENERATION OF THEMATIC LAYERS The data used for this study comprises of remotely sensed data and conventional data from different sources. Conventional data includes rainfall data for fifty years (1951 to 2001), observation-well data of ground water level fluctuation during (1970 to 1998), soil properties from 1994 to 2000, topographical maps (57C/10, 57C/11, 57C/14, 57C/15, 57C/16, 57G/3 and 57G/4), climatic data (temperature, evaporation, relative humidity, evapo-transpiration, and wind speed), data from census report and crop statistics. Remotely sensed data consists of six IRS 1C LISS-III images of October 1996, September 1999 and October 2001 (three monsoons) and March 1997, March 1999 and March 2001 (three non-monsoons). Selection of factors and preparation of various thematic layers are crucial components of any model in general, and for drought severity mapping in particular. Seventeen thematic layers have been generated and used further to create a database in GIS for drought analysis.
From topographic maps, taluk limit, contours, drainages, water bodies and forest/plantation layers are generated. The village limits are created from revenue map. Rainfall, temperature, relative humidity, evaporation and evapo-transpiration, ground water, soil, land capability and land irrigability layers are generated from climatic and published data. Using census data, total irrigated land, tank irrigated land, cultivators, agricultural labour, population density, village amenity layers are created. Thematic layers on geomorphology and hydrology (water bodies, streams etc.) are also generated using topographic maps and satellite images. ANALYSIS OF REMOTE SENSING IMAGES From remotely sensed data, after duly geo-referencing them, a series of new data are generated viz., Normalised Difference Vegetation Index, (NDVI), Principal Component (PC) and Tasseled Cap Transformation (TCT), and all the12 bands have been used to obtain land use classes by adopting supervised classification using ERDAS Imagine software. Since the study area has a mixed cropping pattern, only crop land is identified in general. Water and moistened water body are also very distinctly identified. Barren land has a limited ability to support life, and therefore it is also easily identifiable. The rocky out crops and vegetation cover are mixed up. The water tank is the only class identifiable under water category since no river exists in the study area. Ground truth has been collected at specific locations during field visits made in the years 2002 and 2003. The accuracy of classification for all the images is found between 89 to 97%. The results of land use classification for monsoon periods are given in Table 1. It is seen that the drought is more wide spread as the barren land has increased. The situation of 2001 is also an indication of more severe drought as the water contribution is least and barren land has increased. The major portion of the study area is occupied by kharif crop which is rainfed, fallow land with or without scrubs and degraded grazing and barren land. Table 1: Area of landuse for monsoons of 1996, 1999 and 2001 Class Barren area (%)
1996 Oct. 23.66
1999 Sept. 45.74
2001 Oct. 28.82
Cropped area (%)
17.32
18.47
20.47
Water body (%)
1.42
1.23
0.95
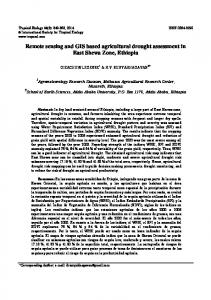
DEVELOPMENT OF A GIS MODEL Through models, it is possible to process various scenarios and to predict potential influences and developments. The modelling procedure therefore requires an understanding of the processes triggering a system so that these processes may be described or simplified adequately. All the layers, as described above and given in Figure 1, are digitized, edited, topology built and exported in Arc View. Final integration of multi-thematic information, overlaying, analysis, correlation and generation of drought severity map are carried out by using the Spatial Analyst module of Arc View (Figure 1).
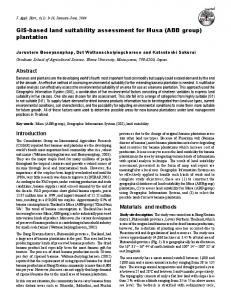
Concept of Ranking and Ratings Ranking and rating is a technique which provides a mathematical method to analyse and construct a map from overlays or data from other related maps. Each parameter is given a rating, which represents the relative importance of these parameters. The ranking assessment method can be incorporated into GIS based multi-criteria decision analysis. There are several ways to deal with the uncertainty about the relative importance of rankings. Assigning ranking to parameters of drought by direct i.e. arbitrary means is likely to induce subjectivity in their rankings which must be removed in order to eliminate biasness in assigning the rankings. Among the popular procedures for assigning ranking, Saaty’s pair-wise comparison method is based on statistical/heuristic approach. It’s advantage is that only two criteria have to be considered at a time. It is easy to use, as it has high trustworthiness, effectiveness and quite precise. Ranking is assigned to each parameter that reflects its importance in the event of occurrence, together with the rating for the individual classes that denotes the event intensity (Nagarajan, 2003). Ranking of each parameter is computed using Saaty’s pairwise comparison matrix. Table 2 presents the details of various parameters and weights that indicate the drought intensity. The weights assigned to reflect importance of each parameter are shown together with the rating for individual classes (5 being the highest and 1 being the lowest drought intensity). The drought severity of a region depends on the cumulative effect of individual themes/classes (Nagarajan, 2003). The identification of drought severity areas requires the factors considered to be combined in accordance with their relative importance to the occurrence of drought. This can be achieved by developing a rating scheme in which the factors and their classes are assigned numerical values. A rating scheme was developed based on the associated parameters triggering drought, field observations, previous experience and knowledge of the investigator. Application of Model The arithmetic overlay approach built into Arc View Model Builder is adopted for integration of input data layers. The rating of each parameter is multiplied by its rank and the sum of the cumulative values of all parameters is used for categorization of drought into different classes. The drought severity map for October 1996 is generated by running the model with the landuse/land cover layer of October 1996 and August month temperature layer and all other layers as shown in Table 2. The drought severity map generated by this model is shown in Figure 2 which shows only three drought classes, viz., mild, moderate and severe while no-drought and extreme drought are absent. The above procedure is followed for the generation of remaining season-wise drought severity maps by considering the corresponding landuse/land cover layer, temperature and evapotranspiration. The villages are identified according to the drought classes by overlaying the village map on the drought severity map. Like-wise the drought severity maps of the remaining seasons are generated by running the corresponding drought model and thus the village-wise drought identification are made. Table 3 presents the abstract wherein the drought classes are compared.
Table 2 Ranking and rating for various parameters S. No. 1
Theme (Parameter) Annual Rainfall (mm)
Ranking
0.165
2
Monthly Rainfall (mm)
0.1517
(September)
3
Max. Temperature (oC)
0
(April)
4
Monthly Temperature (oC)
0.1062
(August)
5
Evaporation (mm)
0.0769
Class 650.0658.0 658.0666.0 666.0674.0 674.0682.0 682.0690.0 160.0164.8 164.8169.6 169.6174.4 174.4179.2 179.2184.0 34.2034.29 34.2934.39 34.3934.48 34.4834.58 34.5834.68 27.4027.46 27.4627.53 27.5327.59 27.5927.65 27.6527.72 8.608.68 8.68-
S. Rating No. 5
10
Theme (Parameter) Ranking Landuse/land cover map 0.0342
Class Rating 1
1
2
1
3
3
2
2
4
2
5
2
1
1
4
2
2
3
3
3
2
4
4
5
5
0-50 50100 100150 150200
5
4
(1996 Oct)
1 5
11
Land Capability
0.0301
1 1
12
Irrigable Land (ha)
0.0267
2 3 4 5
4 3 2
>200
1
0-25
5
2
25-50
4
3
3
4
50-75 75100
2
5
>100
1
0-50 50-
5 4
1
1 2
13
14
Tank Irrigable Land (ha)
Cultivators
0.0255
0.0253
6
Max. Evapotranspiration
0.0526
(mm)
7
Monthly Evapotranspiration
0.0522
(April ) mm
8
9
Relative Humidity (%)
Water tanks
0.0394
0.0451
8.76 8.768.84 8.848.92 8.929.00 164.00164.64 164.64165.28 165.28165.92 165.92166.56 166.56167.20 159.00159.96 159.96160.92 160.92161.88 161.88162.84 162.84163.80 36.8037.28 37.2837.76 37.7638.24 38.2438.72 38.7239.20 0.0517.50 17.535.0 35.052.5 52.570.0 >70.0
3
4
100 100150 150200
5
>200
1 5
4
0 -50 50100 100150 150200
5
>200
1
1
1
2
2
2
3
3
3
4
4
4
5
5
5
0-500 5001000 10001500 15002000
1
3
1
15
Agricultural Labours
0.0152
2 3
1
5 4 3 2 1 5 4 3 2 1
16
17
Village Amenities
Population
0.014
0.0136
2
4 3 2
2 3 4
>2000 5 Notes (1) : Ratings : 1 no-drought, 2 mild, 3 moderate, 4 severe and 5 extreme. (2) : The Landuse/land cover classes : 1 cropland, 2 water tank, 3 moist tank, 4 vegetation and 5 barren land (3) : Village amenities: 5 for bus facility, 4 for bus and primary health , 3 for bus, primary health and anganawadi, 2 for bus, primary health, anganawadi and school, 1 for bus, primary health, anganawadi, school and post office
Villages affected by drought during 1996-2001
S. No
Drought class
October 1996 No. of villages (Study area %)
1
Mild
52 (14.17)
14 (4.25)
0 (0.00)
35 (14.55)
0 (0.00)
34 (12.62)
2
Moderate
238 (67.96)
317 (90.90)
262 (76.93)
307 (83.76)
270 (78.14)
306 (85.31)
3
Severe
58 (17.87)
17 (4.85)
86 (23.09)
6 (1.69)
78 (21.86)
8 (2.07)
March 2001 No. of villages (Study area %)
October 2001 No. of villages (Study area %)
26 41
188 211
PT
5 344
314 264 100 144 25 187 149 129 37
343 54
257
137
274
124 346
91 307 90 324
9
96 292 205
162
39
19
293
0
283 243 178
340 67
246
238 338 284 36 185
51 34
204
139
132 58 151
337
65 85
153 200 197
10 Km
84
201
68 69
95
225
33
309 275 239 71
31
137
91 307 90 324
9 224
22
96
127 292 205
2
NIG KU
AL o
of October 1996
0
o
13 35'
158
276
162
39
135
284
88 111 62 60
51
61 123
52
201 172
58 337 85
68 69
225
33
AL o NI G
309
125
275
10
239
57 245
o
95 20
227
71
31 266
155 4
March 1997
Figure 2 Drought severity maps of Oct. 1996 and March 1997
233 103
139
151
83 84 153 200 146 75 197
46
339
265
132 138
10 Km
259
322
221
65 163
48
94
212
198
280
30
147
164 66
216
204
288
122
110 321
210
186
78
193
213
99
97
113
157 194
141
34 181
o
316
230
332 109
345
49
o
263 47 247 183
114
59
177
185
295
199
140
176
246
36
74
131
244
24
93
261
238
338
86 77
142
7
32
283
340
341
35
208
67
220
3
1
243 178
82 50
42
8
222
64
209
160
133
170 293
215
112
236 273
329
190
19 105
44
43
328
18
o
249 56 248 116 252
29 174
271
203
250
79 179
278 290
251
272
101 130
206
27 281
159
207
171 294 229 291 108 300 11 55 327 214 136 277 21 45 23 189
196
DSV range - March 1997 0-0.87 No-drought 0.87-1.74 Mild 1.74-2.61 Moderate 2.61-3.48 Severe 3.48-4.35 Extreme Village boundary with ID
10
266
155 4
37
124 346
73
308
334 333
175
282 63 302
168
305
o
13 30'
13 30'
o
20 227
57 245
129
233 103
10
146
75
o 46
339
125
83 163
48
259
110 321
138
280
49
314 264 100 144 25 187 149
285
30
94
172
198
186
52 181
147 193
210 88 111 62 61 212 322 123 164 66 60 99 265 216 221
208
215
157 194
344
70
213
345
UR
288
122
5
E
10
177 176
343 54
274
97
113 78
41
211
17
262 161 169 255 38 148 40 242 301 119 156 180 167 306 318 28 254 260 121 335 303 253
ER
0- 0.88 No-drought 0.88- 1.77 Mild 1.77- 2.65 Moderate 2.65- 3.54 Severe 3.54- 4.43 Extreme Village boundary with ID
109 141
1 170
PT TI
3
230
332
329
190
o
316
114
59
7
32
18
203
74 295
199
140
263 47 247 183
261 131
244
135
133
93
331 72
6
26
257 24
86 77
142
223 102
311
325
326
258 188
231
191
150
310
348
126
115
50
220
341
289
182 154
226
82
42
117 287
320
270
336
222
64
209
35
290
271
105
E DSV range - October 1996
112 236 273 160
8
o
EK UV R TU
22
ER EK UV R TU
70
29 174
278
27 281
224 127
43
328
250
79
179 249 56 44 248 116 252
15 14 232
304
192
98
312
16
251
158
276
195
152
272
101 130
207
334 206 171 333 294 229 291 108 300 11 327 55 136 214 277 21 45 23 189
196 285
73
6
258
115
TI
305 308 311 262 161 169 255 38 148 40 242 301 119 156 180 167 306 318 28 254 121 260 335 303 253
348
126
168
17
297
166
342
159
302
184 323
234
279 106
175
282 63
317 143 218
145
81 296 228 104
331 72
325
326
182 154
150
310
223 102
191
240
87
13 25'
289
270
299
12
269298
268
202
120
241
267
237 107
13 20'
342 16
231
117 287
336
152
o
134
286
13 15'
304
192
98
14 232
320
76
13 10'
166
195
312
15
330
92
13 05'
279 106
104
UR
297
TUMKUR
323
234
219
89
235
RA SI
184 145
81
226
218
268
202
120
241 296 228
118
13
317 143
240
217
256
299
12 87
13 25'
107
286
267
269 298
13 20'
134
237
N
53 347 80 165
128
315
A R SI
AAR HU LIY
219
76
77 00'
173
AAR HU LIY
118
313
330
92
13 15'
217
256 13
235
o
o
76 55'
76 50'
o
o
N
13 10'
347 80 165
128
315
13 35'
53 173 89
o
o
o
76 50'
313
September 1999 No. of villages (Study area %)
13 05'
76 45'
March 1999 No. of villages (Study area %)
o o 76 40' 76 45' Drought 76 55' 77 severity 00' maps
o
o
o
76 40'
March 1997 No. of villages (Study area %)
TUMKUR
Table 3
2
KU
CONCLUSIONS A methodology was developed where seventeen thematic data layers are integrated in GIS for drought analysis. The approach included analyzing the remotely sensed data to derive land use information, creation of spatial database and its integration in GIS environment by developing a suitable rating scheme for the generation of drought severity map. The drought severity map was produced using remotely sensed data and other information with the help of GIS. (i)
It is found that no-drought and extreme drought conditions are totally absent during the study period. An average of about 14% of mild drought is observed during October and September in 1996, 1999 and 2001. The number of villages affected during October 1996 is 52 which is the highest.
(ii)
It is observed that that moderate drought is more predominant compared to mild and severe droughts that covers from 68 to 91% of study area. The number of villages affected during October 1996 are 238 while during September 1999 the number of villages have increased to 307. It is found that even in October 2001 moderate drought accounts for 85.31% affecting about 306 villages.
(iii)
The extent of severe drought varies from 1.7 to 23% affecting villages from as low as 6 to as high as 86. It is observed that the drought condition varies in the spatial extent as well as the number of villages that are affected by drought.
The drought severity map would help to point out severity of drought experienced at the locations/places. This information is of utmost importance to planners and administrators to take precautionary measures which would avoid a much more disastrous and serious at a later stage, if neglected. The results of this study can be used by the local inhabitants to alleviate the continuation of drought phenomenon. The local administration can take the required measures to save the life and property before the phenomenon of drought becomes more severe. The information generated at village-level unit (micro level) can be useful for prioritizing villages for immediate drought combat measures like drought relief, soil and water conservation, drought management and mitigation, environmental planning and restoration of fragile geo-ecological balance. This study demonstrates the application of an integrated remote sensing and GIS based methodology for drought severity mapping and its management. Since, the satellites images are available at regular short time intervals, these can be used for the prediction of both rapid and slow events of droughts. These images can assist in damage assessment and aftermath monitoring, providing a quantitative basis for relief measures. The model generated here may guide for a quicker approach for identifying prevailing drought-hit villages along with the extent of barren land. The study on drought spread and intensification is of great practical relevance to agricultural importance in general, and especially for planning drought management and combating drought.
References CENSUS REPORT (1971), Regional Director, Karnataka, Census of India, Govt. of India, Bangalore. CENSUS REPORT (1981), Regional Director, Census of India, (Karnataka), Govt. of India, Bangalore. CENSUS REPORT (1991), Regional Director, Census of India, (Karnataka), Govt. of India, Bangalore. CENSUS REPORT (2001), Regional Director, Census of India, (Karnataka), Govt. of India, Bangalore. DHOPTE M. ARVIND (2002), Agrotechnology for dry land farming, Scientific Publishers, Jodhpur, India. DIWAN P.L (2002), Water environment and drought, Proceedings: All India seminar on “Water and Environment-Issues and Challenges” October 2002, IIT, Roorkee, India, 21-185. GUPTA ALOK (2003), A tool for disaster managers, Geospatial Today August 2003, 37-40. MANIKIAM B. (2003), Remote sensing applications in disaster management, Mausam, 54, 1, 73-18. NAGARAJAN R. (2003), Drought Assessment, Monitoring, Management & Resources Conservation, Capital Publishing Co., Bangalore, 1-32. PRAKASH V.S., SRINIVAS REDDY G.S. and PRABHULINGAPPA A.V. (2003), Drought monitoring system in Karnataka state: present practice and future plans, Proceedings of National Workshop on Drought Mitigation, May 2003, Bangalore, IS 1-18. SINGH SHAMSHER (2003), Drought and its management in India, Short Term Course on Drought Analysis and Management, July 2003, IIT, Roorkee, SS 1-15. THIRUVENGADACHARI S. and GOPALKRISHNA H.R. (1993), An integrated PC environment for assessment of drought, International Journal of Remote Sensing, 14, No.17, 3201-3208. ZILLA PARISHAD (2001), Report of Village Information of Zilla Parishad Tumkur, Govt. of Karnataka.
Administrative boundary Village boundary Agro-climatic zone
Topographic maps
Assign ranking
Revenue map .
Agro-climatic map District Census Report 1991& 2001 Rainfall data (1950-2001) Isohyetal map Tumkur district
Conversion to digital data
Climatic data
Rainfall (Annual) Rainfall (September) Temperature (high) Temperature (August) Evaporation (April) Evapotranspiration (Annual) Evapotranspiration (April) Relative humidity Water tank (pond) Land capability Irrigable land Tank irrigable land Cultivators Agricultural labours Village amenities Village population
Numerical data layer
Data integration in GIS
Drought severity map
Land capability map
Village-wise drought severity map
Surface water tanks
Remotely sensed dataset
DATA INPUT
Land use/land cover map through image processing
THEMATIC DATABASE CREATION IN GIS
Figure 1
Assign ratings
DATA INTEGRATION AND PROCESSING IN GIS
Methodology used in GIS
Village map