used network includes bus, metro and bicycle tracks in the city of Seville .... represents a process of intermodal transshipment that is not related to its length.
Urban Transport XXI
475
GIS modelling of intermodal networks: a comparison of two methods J. G. Moreno-Navarro1, A. Medianero-Coza1 & I. Hilal2 1 2
Department of Geography, University of Seville, Spain Abdelmalek Essaadi University, Morocco
Abstract The settings within GIS network analysis are laborious, and become more complicated when facing an intermodal network. Two methods are compared in this paper: one using the widely used ArcGis Network Analyst that implies the use of a geodatabase which includes every means of transport considered in a network data set, and another that consists of including those means of transport in a single layer. This last method is usable in ArcGis, as in GVSIG, which is an open source GIS and allows for the modification of parameters and changes in the features to be made in an easier way, which saves computing resources. The used network includes bus, metro and bicycle tracks in the city of Seville (Spain). This paper’s conclusion exposes the outcomes of the analysis of one of the top cycling cities in Europe, focusing on the proposals of improvement. Keywords: intermodal transport, GIS analysis, open source GIS.
1 Introduction to GIS modelling of intermodal networks Different performance of means of transport leads to a higher choice capability in order to gain efficiency which is the goal of intermodal transport. The European Commission defined intermodal transport as “a characteristic of a transport system whereby at least two different modes are used in an integrated manner in order to complete a door-to-door transport sequence” (E.U. Commission [1]). But only a freight transport basis was then considered although this definition does not exclude an urban transport context. In any case, a network becomes flexible and multiplies the alternatives when it is an intermodal one. This is accomplished by segmenting the transport chain, so that different modes may be involved in a transport scheme (Hayuth [2]). Nowadays,
WIT Transactions on The Built Environment, Vol 146, © 2015 WIT Press www.witpress.com, ISSN 1743-3509 (on-line) doi:10.2495/UT150381
476 Urban Transport XXI intermodal urban transport is definitely considered in European Transport guidelines (Finger [3]). An exercise of route optimization in an intermodal network must take into account not only the different speeds of each of the means of transport, but also operation time in transshipment and waiting time. Thus, in an intermodal network we can consider all segments within a framework where each one owns attributes and specific rules (Caris et al. [4]), according to the mode of transportation they represent. These segments must also add the links for intermodality, which also have attributes and rules. According to the previous consideration, any software available for network analysis should be able to perform an analysis of intermodal networks too, provided we can modify segment attributes. This capability allow us to modify scenarios, to supervise changes in the outcomes and then to propose changes in infrastructures (Calkins [5]). We can add different parameters to each segment’s attribute according to our goal; impedance (Lundberg and Weber [6]), synthetic indexes (Gutiérrez et al. [7]), etc. However, little attention is usually paid in explaining how to translate intermodal capability into a network model for GIS analysis. The network components can be all those geographical elements which are involved in its function, such as stations, stopping places, roads etc. These elements maintain their geometry according to the reality represented, and they will be considered as arcs and nodes. Turns (turn feature class) pose specific conditions of movement within the network too. These elements will be analyzed according to those fields that determine their performance and rules. Therefore, a preliminary step before analysis is to create and update the fields that identify costs, such as impedance, length, etc. Any variable about performance could be included in those fields (length, cost, time) then generating topology is needed (Network Data Set in ESRI software). This procedure decides most of the rules and the subsequent analysis approach. It is usually the most noticeable difference between different GIS software too, as discussed below. Two different GIS software are used here to compare two different methods in analyzing an intermodal network: ArcGis Network Analyst (ESRI) and GVSIG Análisis de redes (Generalitat Valenciana GIS network analyst). Both software are widely used and many of the scientific literature refers to ESRI as the software used. On the other hand, GVSIG’s main advantage is that it is a freeware and the analysis settings turn out to be much simpler. These two facts could be decisively in favor for intermodal transport research in areas such as Latin-American and Eastern-Europe countries, where GVSIG is a popular GIS software. ESRI software is the most commonly used GIS software in scientific literature and it is referenced in Gutiérrez et al. [7], Lundberg and Weber [6], Kamaruzzaman et al. [8], Macharis and Pekin [9], etc. No scientific reference about using open source GIS for intermodal network analysis have been found so far. As it is hereby exposed, GVSIG is capable of doing similar tasks to those of ESRI software. Recent versions of QGIS can operate as a network analyst too.
WIT Transactions on The Built Environment, Vol 146, © 2015 WIT Press www.witpress.com, ISSN 1743-3509 (on-line)
Urban Transport XXI
477
2 Two different approaches In this case, the impact of construction and commissioning of a bikebridge over a highway is evaluated to assess accessibility from a western metropolitan area of Seville (Gelves) to the city center. ESRI’s proposal makes a crucial difference between the analysis of a single transport mode network and an intermodal network, suggesting the use of a geodatabase when several transport modes are included. It is based on the following arguments: a)
According to ESRI a network data set can be created out of a single shapefile, but then it can only handle one source in the analysis, this is road or railway but not on an intermodal basis. The model will be able to use all kinds of operations such as optimizing route, drawing isochrones, finding closest facility and cost matrix. No connectivity possibility is assumed. b) If we create a network data set out of a geodatabase, we can add more sources to the analysis and also establish connectivity rules among them. An alternative to the assertions above is to apply strictly the consideration of different performance for each mean of transport. It implies giving proper attributes to every segment and considers a connection as another segment itself (Moreno-Navarro [10]). It is important to identify the locations of transfer points in every lane before creating links (Vasitis Vasiliauskas [11]). Just by merging every single model’s network, we will only need to create the links between different networks. Provided that they do not share nodes before merging, there would not be any link between merged shapes until we create them.
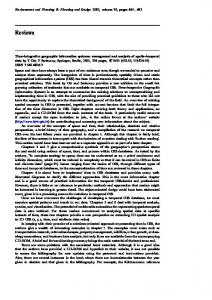
Figure 1:
Multimodal network topology in a single shapefile.
This segment between node junctions is considered of zero length, since it represents a process of intermodal transshipment that is not related to its length (Vasitis Vasiliauskas [11]). Time, speed or any suitable parameter is used instead of length. This alternative method allows us to work with multimodal network analyst tools without using a geodatabase. It also means that we can use a wider range of software. WIT Transactions on The Built Environment, Vol 146, © 2015 WIT Press www.witpress.com, ISSN 1743-3509 (on-line)
478 Urban Transport XXI
Figure 2:
Comparison between a route analysis with an intermodal network geodatabase and a single shape intermodal network with ESRI software. No difference is appreciated.
Even having the same results, it is important to compare the three methods that have been used here: a) Arcgis Network Analyst using a geodatabase: The use a geodatabase implies its building as a previous step. In a geodatabase, all layers (modes) that will participate in the analysis are included. Then, a network dataset in which all rules are specified must be generated. Whenever we modify the attributes, there is the need to go back to the starting point and to repeat these procedures. This involves changing from ArcMap module to ArcCatalog module and then to reload the information in ArcMap. It will take several minutes... b) Network Analyst ArcGIS without using a geodatabase: A single layer is used and the attribute table must be modified to change transport performance and rules. But this still involves changing from an ArcMap module to ArcCatalog to generate the network dataset and then to reload the information in ArcMap... c) GVSIG Network Extension using a single layer: As in the previous case, we act on the attribute table. After changing the attributes, we recreate the geometry without changing network module. We can change rules in this process too and there is no need to reload. This takes less than one minute. In the two latter cases, intermodality is expressed in those segments identifying transshipments and including dwelling time, regardless of its length. WIT Transactions on The Built Environment, Vol 146, © 2015 WIT Press www.witpress.com, ISSN 1743-3509 (on-line)
Urban Transport XXI
Figure 3:
479
Comparison between ArcGis Network Analyst outcome (above) and GVSIG Análisis de redes outcome (below). No difference is appreciated.
3 A case of study: the effect of a bike-bridge in Seville’s urban intermodal network Because of its central, capital condition and population, Seville important communication node at a regional (8,400,000) (1,900,000) level (IEA [12]). This fact justifies a large communications infrastructure to support the large number of occur within the metropolitan area.
WIT Transactions on The Built Environment, Vol 146, © 2015 WIT Press www.witpress.com, ISSN 1743-3509 (on-line)
(700,000) is an and provincial transport and daily trips that
480 Urban Transport XXI Within this study the municipality area of San Juan de Aznalfarache has a key point as it is the only existing road access from Seville to Gelves and therefore it is an obligatory point for the trip between the two municipalities. There are three metropolitan bus lines, but fieldwork has proved that this mean of transport is slower than the bicycle due to regular stops and traffic-light stops. Furthermore, buses are not authorized to carry a bicycle, so this mean of transport was dropped from the final analysis. Currently, the bike path that accesses Seville from Gelves is interrupted by a highway where traffic is dramatically dangerous for bikes. Building a bike-bridge is an option, and it has already been projected. The analysis of the intermodal network has evaluated the effect of this gateway through drawing isochrones on an intermodal network which is entirely included in a single shapefile. 3.1 Cartographic sources and tables attributes Bike, bus, and metro line shape files were obtained from the Spatial Infrastructure Data of Andalusia (IDEA [13]) 1:10,000 scale. Seville streets were obtained from the Spanish Geographical Institute (IGN [14]) 1:25,000, which was the final cartographic scale. All these shapefiles were merged in a single shape and links were digitized. “Time” was the main attribute considered and was calculated from the speed of each means of transport and each segment length. The speed limit for bikes is set by the Municipality ordinance of September 2010. The cycling track speed limit is 15 km/h. The speed limit drops to 10 km/h when pedestrians have priority. In non-pedestrian streets without a cycle path, 10 km/h has been considered, after field work. Trip times chosen as reference for analysis of isochronous were: 15 minutes, 30 minutes and 1 hour respectively. Three different infrastructures are considered, but only two means of transport: metro and bicycle. Dwelling times have been considered according to field work and take an average time of five minutes In the analysis of isochrones from Gelves (starting point) we can detect that a breakthrough to the city center occurs in the isochrone of 30 minutes after the commissioning of the proposed bike-bridge. This fact means accessing the Central University Campus and a major shopping area without using the subway. However, the use of the subway allows for progress to another campus and another important commercial center within the isochrone of 30 minutes. But, either way, cycling is decisive in any proposal for urban mobility. The same results were obtained from the three mentioned methods: a) Arcgis Network Analyst using a geodatabase, b) Network Analyst ArcGIS without using a geodatabase and c) GVSIG Network Extension using a single shapefile.
WIT Transactions on The Built Environment, Vol 146, © 2015 WIT Press www.witpress.com, ISSN 1743-3509 (on-line)
Urban Transport XXI
Figure 4:
Figure 5:
Isochrones analysis before the bike-bridge.
Isochrones analysis after the bike-bridge commissioning.
WIT Transactions on The Built Environment, Vol 146, © 2015 WIT Press www.witpress.com, ISSN 1743-3509 (on-line)
481
482 Urban Transport XXI
Figure 6:
Isochrones analysis after the bike-bridge and using both bike and metro.
4 Conclusion: methods and efficiency The use of a geodatabase to design a multimodal network implies greater technical effort. It turns into a longer time to develop a network data set and increases the use of computing resources. Furthermore, each change requires repeating the process. Rebuilding the network data set is required whenever attributes and rules are changed; this fact also affects when using a single shapefile. When using ESRI software you have to open a new module and follow a series of steps that may take several minutes on each configuration process. The creation of network geometry and configuration of the rules takes only a few seconds when using GVSIG. We may also modify the attributes without rebuilding the network topology. In this case, GVSIG has proven to be a more efficient tool, despite being freeware. However, it is more unstable and less useful in cartography drawing, which was carried out with the ArcGis system in this case. The use of open source GIS in intermodal analysis can widen this research field where low budget conditions force us to reduce costs and optimize resources. It also saves resources when a GIS model for network planning purposes is needed.
WIT Transactions on The Built Environment, Vol 146, © 2015 WIT Press www.witpress.com, ISSN 1743-3509 (on-line)
Urban Transport XXI
483
References [1] [2] [3] [4]
[5] [6] [7] [8] [9] [10] [11] [12] [13] [14] [15] [16]
E.U. Commission, Intermodality and intermodal freight transport in the European Unión. Brussels, 1997. Hayuth. Multimodal Freight Transport. Modern Transport Geography. D. Hoyle. B.S. Knowles. R.D. London. pp. 199–215, 1992. Finger M. Urban mobility. Systems Regulation Across modes. Firesole, 2012. 17 pp. A. Caris, Cathy Macharis, Gerrit Janssens. Planning Problems in Intermodal Freight Transport: Accomplishments and Prospects. Transportation Planning and Technology, Vol. 31, No. 3, pp. 277–302, 2008. Calkins H. GIS and public policy. Geographical Information Systems Vol. 2. Applications. pp. 233–245, 1993. B. Lundberg, J. Weber, Journal of Transport Geography 39, pp. 165–178, 2014. J. Gutiérrez, A. Condeço-Melhorado, E. López, A. Monzón. Journal of Transport Geography. 19 pp. 840–850, 2012. Kamaruzzaman, J. Hine, B. Gunay, Neale Blair. Journal of Transport Geography. pp. 13–32, 2011. C. Macharis, E. Pekin, Journal of Transport Geography 17 500–508, 2009. Moreno-Navarro, J.G. Análisis con SIG de la red de transporte intermodal entre Marruecos y la Unión Europea. Evaluación de rutas y enclaves estratégicos. Cuadernos Geográficos. 39, 2006-2, pp. 203–219, 2006. Vasitis Vasiliauskas A. Modelling of intermodal freight transportation network. TRANSPORT. Vol XVII, No 3, pp. 117–121, 2002. IEA. Instituto de Estadística de Andalucía. http://www.juntade andalucia.es/institutodeestadisticaycartografia (January, 21 2015). IDEA. Infraestructura de Datos Espaciales de Andalucía. http://www.ide andalucia.es/portal/web/ideandalucia/ (January, 21 2015). IGN. Instituto Geográfico Nacional. http://www.ign.es/ign/main/index.do (January, 21 2015). ESRI. Network Analyst. http://resources.arcgis.com/en/help/main/10.2 /index.html#//004700000001000000 (January, 21 2015). Universidad Politécnica de Valencia. GVSIG Análisis de redes. http://cgat.webs.upv.es/bigfiles/gvsig/gvsig_112.htm?t692.html (January 21, 2015).
WIT Transactions on The Built Environment, Vol 146, © 2015 WIT Press www.witpress.com, ISSN 1743-3509 (on-line)