with frustration but no quenched randomness has been analyzed. ... interaction which depends linearly on the distance between the spins[4]. ... of all the spins in the lattice. ... These strings can end at the defects which change the number of strings by .... Above this temperature there is a well-defined free-energy valley.
arXiv:cond-mat/0003306v1 [cond-mat.stat-mech] 17 Mar 2000
Glassy Dynamics in a Frustrated Spin System: Role of Defects Bulbul Chakraborty, Lei Gu, Hui Yin Martin Fisher School of Physics, Brandeis University, Waltham, MA 02254. Abstract. In an effort to understand the glass transition, the kinetics of a spin model with frustration but no quenched randomness has been analyzed. The phenomenology of the spin model is remarkably similar to that of structural glasses. Analysis of the model suggests that defects play a major role in dictating the dynamics as the glass transition is approached.
1. Introduction In recent years, there has been considerable interest in spin models without quenched-in disorder which, however, exhibit glassy dynamics[1]. The model discussed in this paper belongs to this category. Frustration is a key concept in theories of structural glasses such as the curved-space pictures of metallic glass[2]. The two concepts taken together, glassy dynamics in non-random spin systems and frustration as a key to glassy behavior, suggest that frustrated spin systems could play a role in understanding the nature of structural glasses[3]. The compressible, triangular-lattice, Ising antiferromagnet is an interesting example of a system where the frustration is removed by elastic distortions[4, 5]. The phase transition from a disordered, paramagnetic phase to an ordered striped phase has been studied in detail[4, 5], and in the last couple of years, interest has shifted to studying the dynamics of the supercooled state[6, 7]. Monte Carlo simulations of the model[6] have shown that following an instantaneous quench from an initial temperature Ti >> TF (the first-order transition temperature), to a final temperature Tf < TF , the dynamics of the system changes character as Tf is lowered below a temperature T ∗ . The observed changes are consistent with a glass transition occurring at T ∗ . As T ∗ is approached from above, the characteristic relaxation time increases dramatically, and the spin autocorrelation function develops a plateau at intermediate times (Fig. 1). Analysis of the fluctuation metric and the energy metric[8] shows that the system becomes non-ergodic below T ∗ [6]. Although, the dynamics in this non-ergodic phase is reminiscent of “coarsening”, the relaxation towards equilibrium is unusual and is characterized by long-time periods of quiescent behavior interrupted by rare jump events. The distribution of jump-intervals obeys a power law[6] which suggests that the model belongs to the category of weakergodicity breaking[9].
Glassy Dynamics in a Frustrated Spin System: Role of Defects
2
In this paper, the approach to the “glass transition” at T ∗ is analyzed through a study of the spin-spin autocorrelation functions and the behavior of defects which arise naturally when the spin system is mapped onto a solid-on-solid model (SOS)[10]. In the simulations, T ∗ is operationally defined as the temperature below which the system fails to reach equilibrium within the simulation time. 2. Model The compressible Ising antiferromagnet is described by a nearest-neighbor spin-spin interaction which depends linearly on the distance between the spins[4]. The lattice distortions are described by a homogeneous, three component strain field which describes the change in the three nearest-neighbor bond lengths. In the model studied in this paper, no fluctuations of these strain fields are allowed. This implies that the strain fields are being treated within a mean-field approximation but the spins are being treated exactly. It has been shown[4] that, in this approximation, there is a first order transition to a striped phase in which there are rows of aligned spins alternating in sign. The ferromagnetic bonds are elongated and the anti-ferromagnetic bonds are shortened[4, 5]. It has also been shown that, in this mean-field model, there is an instability to this lattice distortion at a temperature below the first-order transition temperature[4]. The strain fields which remove the degeneracy in the compressible model play a role that is similar to the anisotropy of interactions[11] or a staggered field which is conjugate to one of the degenerate ground-states[12]. The crucial difference between the models is that the strain fields are annealed variables whereas the anisotropy and the staggered field are quenched variables. The dynamics that we observe in the compressible model as the glass transition is approached can, however, be rationalized on the basis of known results for the models with the quenched variables. Monte Carlo simulations were used to study the dynamics following instantaneous quenches from a high-temperature disordered phase to a range of temperatures below the ordering transition (which was strongly first-order) at TF . Standard spin-exchange dynamics was extended to include moves which attempt global changes of the shape and size of the box[5, 13]. These global changes were attempted after a complete sweep of all the spins in the lattice. This dynamics was adopted because the homogeneous (global) strain fields are expected to respond only to extensive changes of the nearest neighbor spin correlations[4, 5]. There is an “effective” spin model that the compressible Ising antiferromagnet can be mapped onto. This model involves long-range four-spin interactions. This mapping shows the connection between the current model and the p-spin models and the Bernasconi model[1]. The dynamical model, as defined in this work, however, does not correspond to the dynamics of this four-spin model but instead keeps the strain field and the spins explicitly.
Glassy Dynamics in a Frustrated Spin System: Role of Defects
3
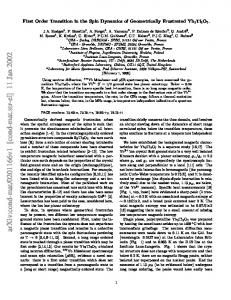
3. Spin-Spin autocorrelation functions and non-linear dynamic susceptibility As mentioned in the introduction, the system is in equilibrium above T ∗ but falls out of equilibrium at T ∗ . The behavior of the spin-spin autocorrelation function, as T ∗ is approached from above, is shown in Fig. 1. These correlation functions show clear non-exponential relaxations. The best stretched exponential fits (exp(−t/τ )β ) are also shown in Fig. 1. The stretching parameter β ≃ 0.3 with a small dependence on temperature. There are indications of a plateau developing at long times, however, data over much longer times and larger systems will be needed to bear this out. In addition to the correlation functions, Fig. 1 also shows dynamic susceptibility associated with the fluctuations of the spin-spin correlation function. This susceptibility, associated with the time-dependent overlap[14], shows the same features similar to that observed in a Lennard-Jones binary mixture[14]. These results suggest that the ergodicity-breaking transition at T ∗ is akin to a structural glass transition even though the system being studied is a spin system. The hope then is that the study of this simple spin model could provide some insight into the structural glass transition. It has already been shown that a trapping model, based on the observations in this spin system, can provide a qualitatively correct description of the observed frequency-dependent susceptibility in structural glasses[7]. The SOS mapping provides an elegant way of analyzing the structures which develop in this spin model as the glass transition is approached. In the following, this mapping will be used to probe the nature of the glass transition. 4. Defects and Strings The ground-state of the triangular-lattice Ising antiferromagnet is a critical state and can be mapped onto the rough phase of an SOS model[10]. In this representation, a line is drawn between two spins which are connected by an anti-ferromagnetic bond[10]. At zero temperature, this defines a tiling of the plane by three different types of rhombi (blue, red and green in Fig. 2). At finite temperatures, defects appear which correspond to elementary triangles with three spins of the same sign and correspond to screw dislocations in the SOS surface. Fig. 2 shows this representation for a configuration generated in the compressible Ising model after a quench above T ∗ . A convenient way of representing the SOS surface is by strings running in the “vertical” direction. Choosing one of the nearest-neighbor directions in the triangular lattice as “horizontal”, these strings are defined by drawing lines connecting the middles of horizontal edges of the rhombi. In Fig. 2, the blue and red rhombi have horizontal edges but the green do not. These strings can end at the defects which change the number of strings by two[10]. The ground-state of the pure triangular lattice antiferromagnet corresponds to a rough SOS surface with no average tilt and is characterized by the number of strings Ns = 2L/3 where L is the linear dimension of a finite lattice with periodic boundary conditions. The strings and defects (dislocations) provide an useful way of visualizing the transition
Glassy Dynamics in a Frustrated Spin System: Role of Defects
4
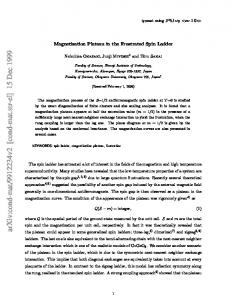
at T ∗ . To understand what could be happening at T ∗ , we need to briefly discuss the properties of the compressible Ising antiferromagnet and its ground-state. The ground-state of the compressible model is the “striped phase”[4]. In the SOS picture this corresponds to a surface with a tilt and no “vertical” strings. There are, obviously, three ways of defining vertical strings in the triangular lattice (corresponding to the three nearest neighbor directions) and the striped phase is three-fold degenerate. These states have only one variety of the rhombi. In terms of the SOS picture, the first-order transition at TF corresponds to a discontinuous change in the number of strings. Strings can end only at the defects (two strings end at a defect) and therefore the kinetics of this transition is dominated by the interplay between defects and strings. Similarly, one expects that the dynamics of the supercooled phase is dictated by the dynamics of defects and strings. The time evolution of the number of strings is shown in Fig. 3 for a temperature above T ∗ and a temperature below T ∗ . Above T ∗ , but close to it, the string density fluctuates around Ns = 2L/3 but below T ∗ the string density is evolving towards zero in a stepwise fashion. The temperature T ∗ seems to correspond to an instability of the system towards the disappearance of strings. It however does not seem to correspond to a simple spinodal since the system stays in states with a fixed number of strings for very long times before hopping to a state with a fewer number of strings. This dynamics suggests a free-energy surface in this string-number space which has multiple minima with a distribution of barrier heights and a bias, below T ∗ , towards smaller number of strings. This is exactly the type of picture that was used to construct the simple Langevin model of the frequency-dependent response in glasses[7]. The order parameter in that model corresponds to the average number of strings in the SOS model. Before analyzing the dynamics of the defects and strings, it is useful to look at some static quantities above T ∗ (where the system is in equilibrium and static averages can be defined. Fig. 4 shows the histogram characterizing the probability distribution of the average number of strings in a particular vertical direction. As the temperature is lowered, the distribution develops a pronounced tail and secondary maxima. At the same time, the distribution of defects changes from a nearly Gaussian distribution to a nearly exponential one with a peak close to zero. The combination of these two features gives a clue to the origin of the slow dynamics. The instability at T ∗ implies a tendency of the system to have fewer strings than that characterizing the ideal supercooled state with Ns = 2L/3. To achieve this it needs to create fluctuations which have a large amplitude and last for long times. These string fluctuations can be created only via correlated defect events. The type of defect events that change the number of strings by a large number are the appearance of more than one pair of defects (defects always get created in pairs in the dynamics that is being used in the simulations). These events are extremely rare and can lead to long correlation times. The correlation between defect and string histories is shown in Fig. 5. To change the average number of strings in the system by two or more, a pair of strings running the length of the system has to be created or destroyed. The history shown in Fig.
Glassy Dynamics in a Frustrated Spin System: Role of Defects
5
5 indicates that this is not accomplished by one pair of defects running through the system and creating or destroying strings in a “zipper” type action. Instead, the strings are created or destroyed through the creation of more than one defect pair in succession. As the temperature approaches T ∗ , these events get rarer and the structures with significantly more (or less) strings than the ideal supercooled state get frozen in for longer and longer times. The glass transition, in this frustrated spin system, seems to be pinned by an underlying instability (true instability in mean-field) towards a deformation of the lattice or the spontaneous disappearance of strings. The dynamics approaching this transition is dictated by rare events which involve correlated defects. 5. Conclusion In this preliminary study of correlation between defects and glassy dynamics in a frustrated spin model, the observations suggest that defects are crucial to understanding the glass transition. The dynamics approaching the transition is anomalous because of correlations between defects and strings. The defects (dislocations) are local and owe their origin to the frustration in the system. The strings run the length of the system and define the global characteristics of the SOS surface and hence the ordering in the compressible model. In the mean-field model, there is a true instability towards the disappearance of these strings. In a non-mean-field model one expects to see a pseudo instability. To understand the slowing down of the dynamics as the temperature approaches T ∗ , the instability temperature, it is useful to analyze the nature of this instability a little further. The results from the models with the quenched frustrationremoving fields[11, 12] prove to be useful in understanding the instability at T ∗ . The ground-states of the triangular lattice antiferromagnet can be classified into sectors characterized by the string density. In the zero-defect sector, the free energy of the quenched models can be calculated as a function of the string-density and the field strength[11, 12]. This free energy is minimized by a particular value of the string density for a given value of the staggered field[12] or the strength of the anisotropy[11]. The analysis of Chen and Kardar[4] can be repeated using the language of the strings (at least within the zero-defect sector) and indeed one finds that the “effective” free energy expressed as a function of the strain fields exhibits an instability as the temperature is lowered. The curvature of the effective free energy goes to zero at the instability temperature T ∗ . Above this temperature there is a well-defined free-energy valley centered at zero strain field and a string density of 2/3. As this state loses its stability the system becomes free to explore regions with finite strain. At each realization of the strain field there is, however, a well-defined minimum at a definite string -density different from 2/3. The instability temperature marks the point where the system starts to see the multivalleyed nature of the free-energy surface. The exploration of this phase space can take place only through activated processes which take the system from one string sector to another. The process is activated since the number of strings can change only through the creation of defects. This picture provides a qualitative understanding
Glassy Dynamics in a Frustrated Spin System: Role of Defects
6
of the dynamics observed in our simulations. In continuing studies of this system, we are exploring the spatial correlations of defects. The spatio-temporal correlations which develop in this system as T ∗ is approached would be crucial in understanding the detailed nature of the long-lived structures and their similarity to the ones observed in structural glass. This work has been supported in part by the DOE grant DE-FG02-ER45495. [1] J. P. Bouchaud and M. Mezard, J. Phys. I 4, 1109 (1994). [2] For a recent review and simulation studies, see T. Tomida and T. Egami, Phys. Rev. B 52, 3290 (1995). [3] S. A. Kivelson et al, J. Chem. Phys 101, 2391 (1994). [4] Z. Y. Chen and M. Kardar, J. Phys. C 19, 6825 (1986). [5] Lei Gu, Bulbul Chakraborty, P. L. Garrido, Mohan Phani and J. L. Lebowitz, Phys. Rev. B 53, 11985 (1996). [6] Lei Gu and Bulbul Chakraborty, Mat. Res. Soc. Symp. Proc 455, 229 (1997), and condmat/9612103. [7] M. Ignatiev and Bulbul Chakraborty, Phys. Rev. E 60, R21 (1999). [8] D. Thirumalai and Raymond D. Mountain, Phys. Rev. B47, 479 (1993). [9] J. P. Bouchaud, J. Phys. I 2, 1705 (1992). [10] Henk W. J. Blote and M. Peter Nightingale, Phys. Rev. B 47, 15046 (1993) and references therein; Chen Zeng and Christopher L. Henley, cond-mat/9609007. [11] H. W. J. Bløte and H. J. Hillhorst, J. Phys. A: Math. Gen. 15, L631 (1982) [12] Abhishek Dhar, Pinaki Choudhuri and Chandan Dasgupta, preprint (1999). [13] Lei Gu, Ph. D. thesis, Brandeis University, 1999 [14] Claudio Donati et al, cond-mat/9905433.
7
Glassy Dynamics in a Frustrated Spin System: Role of Defects 0.003 (b)
Q(t)
0.002
0.001
0.000
10
100
1000
10000
1000
10000
(a)
C(t)
0.100
0.010 T/TF=0.8 T/TF=0.9
0.001
10
100 time(MCS)
Figure 1. (a)The spin-spin autocorrelation function at temperatures approaching T ∗ ≃ 0.75TF . The system size is 96x96. The dashed curves are stretched-exponential fits to the data. (b) the susceptibility associated with the time-dependent overlap at the same temperatures as shown in Fig. 1(a). There is evidence of a peak developing as the temperature is lowered towards T ∗ .
8
Glassy Dynamics in a Frustrated Spin System: Role of Defects
Figure 2. The SOS representation of a spin configuration following an instantaneous quench to a temperature T ∗ > T ∗ , the distribution is nearly Gaussian and peaked around 2/3. As T → T ∗ , the distribution gets broader and shows multiple peaks which suggests that the system is finding pathways into sectors with string density different from 2/3. The deviations are both on the positive and negative side since the system fluctuates between different orientations of the strain field and we are showing only the “vertical” string density as defined in Fig. 2. (b)Defect density distribution for these same set of temperatures showing the peak narrowing and shifting towards zero.
8
34
6
32 4
30 2
0 17000
22000
28
time (MCS)
Figure 5. String history and defect history at a temperature slightly above T ∗ showing the type of defect events which lead to large fluctuations in the number of strings. The black line shows the string history and corresponds to the numbers on the right and the red line depicts the defect history. The “ideal” string density in this 48x48 system is 32.