ORNL/TM-2001/196
Global and Regional Ecosystem Modeling: Databases of Model Drivers and Validation Measurements R. J. Olson, K. R. Johnson, D. L. Zheng, and J. M. O. Scurlock
Environmental Sciences Division
DOCUMENT AVAILABILITY Reports produced after January 1, 1996, are generally available free via the U.S. Department of Energy (DOE) Information Bridge. Web site http://www.osti.gov/bridge Reports produced before January 1, 1996, may be purchased by members of the public from the following source. National Technical Information Service 5285 Port Royal Road Springfield, VA 22161 Telephone 703-605-6000 (1-800-553-6847) TDD 703-487-4639 Fax 703-605-6900 E-mail
[email protected] Web site http://www.ntis.gov/support/ordernowabout.htm Reports are available to DOE employees, DOE contractors, Energy Technology Data Exchange (ETDE) representatives, and International Nuclear Information System (INIS) representatives from the following source. Office of Scientific and Technical Information P.O. Box 62 Oak Ridge, TN 37831 Telephone 865-576-8401 Fax 865-576-5728 E-mail
[email protected] Web site http://www.osti.gov/contact.html
This report was prepared as an account of work sponsored by an agency of the United States Government. Neither the United States Government nor any agency thereof, nor any of their employees, makes any warranty, express or implied, or assumes any legal liability or responsibility for the accuracy, completeness, or usefulness of any information, apparatus, product, or process disclosed, or represents that its use would not infringe privately owned rights. Reference herein to any specific commercial product, process, or service by trade name, trademark, manufacturer, or otherwise, does not necessarily constitute or imply its endorsement, recommendation, or favoring by the United States Government or any agency thereof. The views and opinions of authors expressed herein do not necessarily state or reflect those of the United States Government or any agency thereof.
ORNL/TM-2001/196 ENVIRONMENTAL SCIENCES DIVISION GLOBAL AND REGIONAL ECOSYSTEM MODELING: DATABASES OF MODEL DRIVERS AND VALIDATION MEASUREMENTS R. J. Olson Environmental Sciences Division Oak Ridge National Laboratory P.O. Box 2008 Oak Ridge, TN 37831-6407 K. R. Johnson Institute of Environmental Science University of Miami, Ohio Oxford, OH 45056 D. L. Zheng Department of Geography University of Maryland LeFrak Hall, Room 2181 College Park, MD 20742-8225 J. M. O. Scurlock Environmental Sciences Division Oak Ridge National Laboratory P.O. Box 2008 Oak Ridge, TN 37831-6407 Date Published: December 2001 This work was funded by the Terrestrial Ecosystem Program of the U.S. National Aeronautics and Space Administration (NASA Reference Number TE/99-0005 under Interagency Agreement number 2013-M164-A1 with the U.S. Department of Energy) Prepared by the OAK RIDGE NATIONAL LABORATORY Oak Ridge, Tennessee 37831 managed by UT-BATTELLE, LLC for the U.S. DEPARTMENT OF ENERGY under contract DE-AC05-00OR22725
CONTENTS Page LIST OF FIGURES ...................................................................................................................v LIST OF TABLES.................................................................................................................. vii LIST OF ABBREVIATIONS...................................................................................................ix ABSTRACT..............................................................................................................................xi 1. BACKGROUND ..................................................................................................................1 1.1 NPP DATA BACKGROUND .......................................................................................3 1.2 REVIEW OF DATA QUALITY ...................................................................................4 2. MODEL DRIVER DATA ....................................................................................................6 2.1 ELEVATION................................................................................................................7 2.2 SITE BIOME CLASSIFICATION...............................................................................8 2.3 LAND COVER.............................................................................................................8 2.4 CLIMATE...................................................................................................................10 2.5 SOILS .........................................................................................................................10 2.6 NDVI ..........................................................................................................................12 2.7 ATMOSPHERIC CO2 ................................................................................................13 3. NPP MEASUREMENT DATA..........................................................................................13 3.1 CLASS A NPP POINT DATA ...................................................................................14 3.2 CLASS B NPP POINT DATA ...................................................................................15 3.2.1 ORNL DAAC Data Sets ...................................................................................15 3.2.2 Combined Class B Data Sets ............................................................................18 3.2.3 Additional Class B Data Sets ............................................................................18 3.2.4 Estimating Total NPP .......................................................................................19 3.3 CLASS C NPP GRID CELL DATA ..........................................................................20 3.3.1 Scaling Methods ...............................................................................................20 3.3.2 Individual Data Set Descriptions ......................................................................22 4. DATA QUALITY ASSESSMENT ....................................................................................29 5. OUTLIER ANALYSIS.......................................................................................................34 5.1 OVERALL APPROACH ...........................................................................................34 5.2 CLASS A POINT DATA ...........................................................................................37 5.3 CLASS B POINT DATA ...........................................................................................38 5.4 CLASS C GRID CELLS ............................................................................................40 6. SUMMARY ........................................................................................................................41 7. ACKNOWLEDGEMENTS ................................................................................................42 8. REFERENCES ...................................................................................................................42 8.1 DATA CITATIONS ...................................................................................................42 8.2 LITERATURE CITED ...............................................................................................49
iii
CONTENTS (continued) Page APPENDIX A: CONTRIBUTORS TO THE NPP DATABASE AND PARTICIPANTS IN THE EMDI WORKSHOP ..................................................................................................57 APPENDIX B: CLASS C 0.5° GRID CELL DATA FORMAT AND PROCESSING NOTES ...........................................................................................................61 APPENDIX C: STATISTICAL ANALYSIS OF RATIOS OF BELOW GROUND NET PRIMARY PRODUCTIVITY TO TNPP TO DERIVE CONVERSIONS TO ESTIMATE TOTAL NPP ............................................................................................................................67 APPENDIX D: DATA SETS OF MODEL DRIVER AND VALIDATION VARIABLES ...........................................................................................................................71
iv
LIST OF FIGURES Figure
Page
1
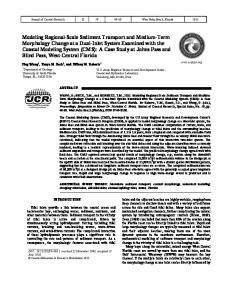
Global distribution of Class A (Fig. 1a) and Class B (Fig. 1b) sites and Class C grid cells (Fig. 1c) ........................................................................................5
2
Mean NPP and number of measurements for aggregated biomes for Class A, B, and C data sets ......................................................................................................7
3
Mean ratio and standard error of below ground (BNPP) net primary productivity to total NPP for aggregated biomes .........................................................................19
4
Site-specific elevation versus elevation derived from global DEM for 817 Class B sites with elevation acquired from literature ..............................................30
5
Site-specific precipitation versus precipitation derived from global climate database for Class A sites with precipitation acquired from literature ....................31
6
Site-specific temperature versus temperature derived from global climate database for Class A sites with temperature acquired from literature .....................32
7
Site-specific precipitation versus precipitation derived from global climate database for Class B sites with precipitation acquired from literature ....................33
8
Site-specific temperature versus temperature derived from global climate database for Class B sites with temperature acquired from literature .....................34
v
LIST OF TABLES Table
Page
1
Summary of activities in the development of global net primary productivity (NPP) data sets for use in model development and other ecological research ..........2
2
EMDI modeling groups and data contributors ..........................................................3
3
GPPDI and EMDI data sets .......................................................................................6
4
Biome categories for Class A and B sites as defined at the EMDI I Workshop........8
5
Biome categories for Class C cells ............................................................................9
6
Codes for UMD land cover data................................................................................9
7
EMDI soil parameters extracted from the IGBP Soils Database.............................11
8
Sources and information about Class C grid cell NPP ............................................20
9
Summary of the availabilities of ANPP and TNPP in the 16 original studies (y=yes, n=no, and e=estimated) along with NPP estimation and scaling methods....................................................................................................................21
10
Flags’ names, descriptions, and weights used for Class A records .........................37
11
Class A sites identified as outliers by participants in the EMDI I workshop ..........38
12
Flags’ names, descriptions, and weights used for Class B records..........................39
13
Flags’ names, descriptions, and weights used for Class C records..........................40
14
Maturation of the EMDI I data set...........................................................................41
B.1
File layout, variables, and units of measure for the Class C 0.5° grid cell measurements ..........................................................................................................63
C.1
Ratios of below ground to total NPP estimates summarized by biome...................69
C.2
Results of general linear models procedure on dependent variable: BNPP:TNPP ............................................................................................................70
C.3
Duncan’s multiple range test for variable BNPP:TNPP with alpha = 0.05, df = 544, MSE = 0.017035 ......................................................................................70
vii
LIST OF TABLES (continued) Table
Page
D.1
Maturation of the ecosystem model-data intercomparison database .......................73
D.2
Descriptions of data sets where xxx in data set name indicates the number of observations in the data set, e.g., 81, 933, and 1627 for Class A, B, and C sets, respectively..............................................................................................................74
D.3
Model driver location information derived from site-specific sources....................75
D.4
Model driver site soils information derived from site-specific sources...................75
D.5
Model driver site vegetation information derived from site-specific sources .........75
D.6
Model driver monthly temperature (Tmax, Tmin) and precipitation climate data from site-specific sources for 38 Class A sites, averaging 40 years of observations per site ...............................................................................................76
D.7
Model driver summary information derived from global sources ...........................76
D.8
Model driver land cover information derived from global sources .........................77
D.9
Model driver soils information derived from global sources ..................................78
D.10 Model driver average monthly NDVI information derived from global sources ....78 D.11 Model driver 30-year average monthly climate information derived from global sources ..........................................................................................................79 D.12 Model driver atmospheric carbon dioxide information derived from global sources .....................................................................................................................80 D.13 Model driver 95-year transient climate information derived from global sources .....................................................................................................................80 D.14 Model validation NPP information derived from site-specific sources...................81 D.15 Model validation outlier flags derived from site-specific reviews ..........................81 D.16 Model validation mean NPP information derived from site-specific data that passed outlier analysis .............................................................................................82 D.17 Model validation driver information derived from a variety of sources..................84
viii
LIST OF ABBREVIATIONS AET ANPP AVHRR BA BAHC BNPP CDIAC CO2 DAAC DEM DGVM DIS DSMW EBL EMDI ENL EOS ETM FAO FIA FLUXNET GAIM GCMD GCOS GCTE GLOBE GNET GOES GOFC GPPDI GTOS IBP ICSU IGBP IGBP-DIS IGOS ILTER ISRIC LAI LANDSAT LUCC MAE MLRA MODIS NASA
actual evapotranspiration aboveground net primary productivity Advanced Very High Resolution Radiometer basal area Biospheric Aspects of the Hydrological Cycle below ground net primary productivity Carbon Dioxide Information and Analysis Center carbon dioxide Distributed Active Archive Center Digital Elevation Model Dynamic Global Vegetation Model Data and Information System Digital Soil Map of the World evergreen broad-leaf Ecosystem Model-Data Intercomparison evergreen needle-leaf Earth Observing System Enhanced Thematic Mapper Food and Agriculture Organisation of the UN Forest Inventory and Analysis Flux Network Global Analysis, Interpretation, and Modelling Global Change Master Directory Global Climate Observing System Global Change and Terrestrial Ecosystems Global Land One-km Base Elevation Global Network of Environment and Technology Geostationary Operational Environmental Satellite Global Observation of Forest Cover Global Primary Production Data Initiative Global Terrestrial Observing System International Biological Programme International Council of Scientific Unions International Geosphere-Biosphere Programme International Geosphere-Biosphere Programme - Data and Information System Integrated Global Observing Strategy International Long Term Ecological Research International Soil Reference and Information Centre leaf area index Land Remote Sensing Satellite Land Use and Cover Change mean absolute error Major Land Resource Area Moderate Resolution Imaging Spectroradiometer National Aeronautics and Space Administration (U.S.A.)
ix
LIST OF ABBREVIATIONS (continued) NASS NCEAS NDVI NE NEP NFI NOAA NPP ORNL OTTER PAL PAR PI PIK PNW PR QA QC SCS STATSGO TEM Terra TM TNPP TPB UMD UNEP USGCRP USGS VEMAP WISE WMO
National Agricultural Statistics Service National Center for Ecological Analysis and Synthesis Normalized Difference Vegetation Index normalized error net ecosystem productivity National Forest Inventory National Oceanic and Atmospheric Administration (U.S.A.) net primary productivity Oak Ridge National Laboratory (U.S.A.) Oregon Transect Ecosystem Research Project Pathfinder AVHRR Land (data set) photosynthetically active radiation Principal Investigator Potsdam Institute for Climate Impact Research Pacific Northwest Precipitation Radar quality assessment quality control USDA Soil Conservation Service State Soil Geographic Terrestrial Ecosystem Model Earth Observation Satellite - Land Thematic Mapper total net primary productivity total plant biomass University of Maryland UN Environmental Programme US Global Change Research Program United States Geological Survey Vegetation/Ecosystem Modeling and Analysis Project World Inventory of Soil Emission Potentials World Meteorological Organisation
x
ABSTRACT Olson, R. J., K. R. Johnson, D. L. Zheng, and J. M. O. Scurlock. 2001. Global and Regional Ecosystem Modeling: Databases of Model Drivers and Validation Measurements. ORNL/TM2001/196. Oak Ridge National Laboratory, Oak Ridge, Tenn. Understanding global-scale ecosystem responses to changing environmental conditions is important both as a scientific question and as the basis for making policy decisions. The confidence in regional models depends on how well the field data used to develop the model represent the region of interest, how well the environmental model driving variables (e.g., vegetation type, climate, and soils associated with a site used to parameterize ecosystem models) represent the region of interest, and how well regional model predictions agree with observed data for the region. To assess the accuracy of global model forecasts of terrestrial carbon cycling, two Ecosystem Model-Data Intercomparison (EMDI) workshops were held (December 1999 and April 2001). The workshops included 17 biogeochemical, satellite-driven, detailed process, and dynamic vegetation global model types. The approach was to run regional or global versions of the models for sites with net primary productivity (NPP) measurements (i.e., not fine-tuned for specific site conditions) and analyze the model-data differences. Extensive worldwide NPP data were assembled with model driver data, including vegetation, climate, and soils data, to perform the intercomparison. This report describes the compilation of NPP estimates for 2,523 sites and 5,164 0.5º-grid cells under the Global Primary Production Data Initiative (GPPDI) and the results of the EMDI review and outlier analysis that produced a refined set of NPP estimates and model driver data. The EMDI process resulted in 81 Class A sites, 933 Class B sites, and 3,855 Class C cells derived from the original synthesis of NPP measurements and associated driver data. Class A sites represent well-documented study sites that have complete aboveground and below ground NPP measurements. Class B sites represent more numerous “extensive” sites with less documentation and site-specific information available. Class C cells represent estimates of NPP for 0.5°-grid cells for which inventory, modeling, or remote-sensing tools were used to scale up the point measurements. Documentation of the content and organization of the EMDI databases are provided. The first EMDI workshop demonstrated that model-data intercomparison is an important direction in regional and global model evaluation, but one that is an extraordinarily complex task. Comparing the NPP field measurements with an average NPP from an ensemble of model outputs provided a unique method to improve NPP data, model driver data, and model processes. Initial results showed general agreement between model predictions of NPP and field measurements of NPP but with obvious differences that indicated areas for potential data and model improvement. A second EMDI workshop, held in 2001, more fully analyzed the differences between measured NPP and model outputs. The Global Analysis, Interpretation, and Modeling Task Force of the International GeosphereBiosphere Programme sponsored the EMDI Workshops; the National Center for Ecological Analysis and Synthesis (NCEAS) provided support for data organization and distribution; and the Terrestrial Ecology Program within NASA’s Office of Earth Science (U.S. National Aeronautics and Space Administration, Office of Earth Science, Terrestrial Ecology Program, Activity No. 46WM16401) supported the NPP data compilation.
xi
1. BACKGROUND Progress in modeling the global carbon cycle was previously inhibited by the lack of adequate observational data for model parameterization and validation, such as net primary productivity (NPP) and its individual components from field measurements (Scurlock et al. 1999). This problem came to light when the International Geosphere-Biosphere Programme (IGBP) project on Global Analysis, Interpretation, and Modeling (GAIM) held global NPP model intercomparison meetings in 1994 and 1995 at the Potsdam Institute for Climate Impact Research (PIK), Germany (Hibbard and Sahagian, 1998). The PIK workshops called specifically for the development of a publicly available database of NPP estimates (Lurin et al. 1994). More recently, the Vegetation/Ecosystem Modeling and Analysis Project (VEMAP) (Schimel et al. 1997) cited similar difficulties in comparing model predictions with currently available NPP estimates, an analysis of terrestrial carbon sinks cited the need for additional data to refine model constraints (Fan et al. 1998), and an overview of the variety of data for understanding the carbon cycle emphasized the value of field measurement of carbon fluxes (Canadell et al. 2000). To assess the accuracy of global model forecasts of terrestrial carbon cycling, two Ecosystem Model-Data Intercomparison (EMDI) workshops were held at the University of New Hampshire, Durham, New Hampshire, U.S.A., December 5–8, 1999, and at the National Center for Ecological Analysis and Synthesis (NCEAS), Santa Barbara, California, U.S.A., April 18–21, 2001. The approach was to run regional or global versions of the models for sites with NPP measurements (i.e., not fine-tuned for specific site conditions) and analyze the model-data differences. The EMDI Workshops were possible because of the cumulative progress in compiling complete and consistent NPP data. Activities leading to EMDI included the Global Primary Production Data Initiative (GPPDI), three NPP working groups sponsored by U.S. NCEAS, and two NPP projects at the Oak Ridge National Laboratory [ORNL Principal Investigator (PI) R. J. Olson and the University of Maryland (UMD) PI S. D. Prince] funded by the National Aeronautics and Space Administration (NASA) Terrestrial Ecosystems Program. GPPDI was established as an activity of the IGBP Data and Information System, a coordinated international program to improve worldwide estimates of terrestrial NPP for parameterization, calibration, and validation of NPP models at various scales (Prince et al. 1995). Under the NASA funding, 61 site-specific NPP data sets were compiled (Scurlock and Olson 2001) with grassland sites constituting over half the collection (Scurlock et al. 2001). Eight multi-site data sets were also compiled containing over NPP estimates for 1700 sites. Methods for extrapolating from point measurements to grid cells were reviewed and used to estimate NPP for croplands (Prince et al. 2000) and other biomes (Zheng et al. 2001). The NPP data are available online through the NASA-funded Distributed Active Archive Center (DAAC) at ORNL. Under the auspices of GPPDI, a series of three Working Groups were held at NCEAS, Santa Barbara, Calif., between December 1997 and October 1998. The objectives were to take extensive but incomplete data sets and make them usable for analyses and models by estimating total NPP in a consistent manner, for points and for large-grid cells: http://www.nceas.ucsb.edu (look for Research Projects, then “Prince”) http://daac.ornl.gov/NPP/html_docs/nceas_des.html The NPP data compiled by the NCEAS Working Groups and other GPPDI activities were used for the EMDI activity. The GPPDI assembled more than 7500 estimates of NPP globally from
1
ecological sites as well as estimates of NPP for regularly gridded regions using agricultural and forestry statistics that have high spatial density over those regions. This represents a more comprehensive database of measurements than has previously existed. The GPPDI data were analyzed to extract a subset of NPP data suitable for the EMDI workshops. Model driver data (e.g., vegetation type, climate, and soils associated with a site used to parameterize ecosystem models) were compiled for the set of EMDI data, and extensive review of the combined NPP and driver data was conducted. The sequence of NPP activities culminating in the EMDI Workshops is summarized in Table 1. The set of activities described above resulted in the publication of 75 NPP data sets (see Sect. 8.1 for a list of the data citations). Table 1. Summary of activities in the development of global net primary productivity (NPP) data sets for use in model development and other ecological research Year Activity Accomplishment NPP data 1993–95 Model interEstablished need for global 400 NPP values compiled comparison NPP data to compare to from participants workshops - PIK models 1995 Global primary Established GPPDI with productivity data steering committee that initiative (GPPDI) documented need for global NPP data to compare to models Class A - 31 sites 1996 Dec NPP Workshop Reviewed progress, drafted IGBP-DIS, Cincinnati proposal to NCEAS; estimated NPP data available for 100–300 sites NPP projects at ORNL and GPPDI NPP data set: 1996–2001 Net primary product- Class A - 162 sites ivity projects – NASA UMD, renewed in 1999 - Class B - 2363 sites Terrestrial Ecosystems - Class C - 5164 cells Program 1997 Dec; NPP working groups – Published selected NPP data NPP data sets: - boreal forest - 69 sites 1998 Feb; NCEAS, Santa for boreal, grassland, - tropical forest - 62 sites 1998 Oct Barbara tropical, and crop systems; - grassland - 32 sites created rules for estimating - crops - 1195 cells NPP from partial data - temperate forests - 247 cells EMDI NPP data set: 1999 Dec; Ecosystem model-data Compared model outputs with field measurements 2001 Apr intercomparison - Class A - 81 sites workshops (EMDI) - Class B - 933 sites GAIM/NCEAS - Class C - 3837 cells The participating modeling groups represented a broad range of approaches to treating terrestrial carbon dynamics. Groups employing satellite-driven radiation-interception models, ecosystem biogeochemical models with monthly time steps, detailed process models with hourly time steps, and static vegetation and dynamic vegetation variants of these completed runs and were present at the workshop. Each modeling group was provided basic model drivers for the sites and regions or could use their own resources for producing model simulations. The NPP measurements were not provided to the modelers until they submitted their simulation results. The modeling groups and data contributors who participated in EMDI are shown in Table 2 and Appendix A.
2
Model name AVIM BGC CARAIB CENTURY GLO-PEM GTEC IBIS LPJ PnET SIB2w/carbon STOMATE VECODE Data NPP NPP NPP NPP NPP NPP NPP Elevation Soil properties Land cover Monthly NDVI Atmospheric CO2 30-year average monthly climate Actual monthly climates
Table 2. EMDI modeling groups and data contributors Modelers Institution, country Jinjun Ji Institute of Atmospheric Physics, China Peter Thornton University of Montana, U.S.A. Bernard Nemry University of Liege, Belgium Bill Parton Colorado State University, U.S.A. Steve Prince, Daolan Zheng University of Maryland, U.S.A. Mac Post, Tony King Oak Ridge National Laboratory, U.S.A. Chris Kucharik, Jon Foley University of Wisconsin, U.S.A. Stephen Sitch, Ben Smith Potsdam Institute for Climate Impact Research, Germany John Aber University of New Hampshire, U.S.A. Chris Field, Jörg Kaduk Carnegie Institution, Stanford, U.S.A. Pierre Friedlingston, Laurent CNRS, France Kergoat Victor Brovkin Potsdam Institute for Climate Impact Research, Germany Data contributors Jonathan Scurlock, Dick Olson, Keri Johnson Steve Prince, Daolan Zheng Bill Parton, Steve Del Grossa Tom Gower, Drew Feldkirchner Jian Ni Larry Tieszen Jennifer Jenkins Rob Braswell Dick Olson, Keri Johnson Steve Prince, Robb Wright Rob Braswell Bob Cushman Wolfgang Cramer, Stephen Sitch Wolfgang Cramer, Stephen Sitch
Institution, country Oak Ridge National Laboratory, U.S.A. University of Maryland, U.S.A. Colorado State University, U.S.A. University of Wisconsin-Madison, U.S.A. University of Beijing, China USGS EROS Data Center, U.S.A. USDA Forest Service, U.S.A. University of New Hampshire, U.S.A. Oak Ridge National Laboratory, U.S.A. University of Maryland, U.S.A. University of New Hampshire, U.S.A. ORNL Carbon Dioxide Information and Analysis Center, U.S.A. Potsdam Institute for Climate Impact Research, Germany Potsdam Institute for Climate Impact Research, Germany
1.1 NPP DATA BACKGROUND The GPPDI database includes NPP measurements collected over a long time period by many investigators using a variety of methods. The minimum requirements for data to be included were as follows: • • • •
the use of one or more accepted methods to estimate aboveground or below ground NPP; geographical location for the study site; definition of biome or vegetation type; and a citable reference to peer-reviewed publication, symposium, or workshop proceedings; book chapter; or technical memorandum.
3
The measurements of NPP were categorized as either Class A, intensively studied sites; Class B, “extensive” sites; or Class C, 0.5° latitude-longitude grid cells. Class A sites – data for Class A sites represent intensively studied or well-documented study sites (e.g., with site-specific climate, soils information, etc.) and have complete NPP measurements and good documentation. Sites include grassland, tropical forest, temperate forest, and boreal forest biomes (Fig. 1a). Class B sites – data for Class B sites represent more numerous “extensive” sites with less documentation and site-specific information available and include study sites from many biomes compiled from existing collections of data (Fig. 1b). Class C cells – data for Class C cells represent regional collections of 0.5°-grid cell sites from many biomes compiled from collections of data that have NPP estimates (Fig. 1c). The EMDI Class C cells represent the results of scaling up from point measurements to grid cells. 1.2 REVIEW OF DATA QUALITY The NPP data have undergone several levels of review or filtering. The activities associated with the GPPDI, especially the three Working Groups funded by NCEAS, provided a literature review that resulted in selecting Class A sites. The EMDI activity provided another level of review for all the data by examining relationships between NPP estimates and associated environmental controlling variables, such as temperature and precipitation. As a results of the EMDI review, as described below and in Sect. 5, we assigned flags to each NPP estimate and selected a subset of data for the model-data intercomparison based on the flags. The data were reviewed at the EMDI I Workshop, and a strategy was developed for additional “outlier analysis” to flag those NPP measurements that, in combination with their driver data and the NPP ensemble model values, appeared to be unrepresentative or represented conditions that the global ecosystem models did not consider (e.g., wetlands) (see Sect. 5). The EMDI Workshop participants also agreed on (1) an approach to assigning consistent biome classes to all sites, (2) standardizing latitude and longitude to two decimal places, and (3) assigning unique identifiers for locations (SITE_ID) and individual measurements (MEAS_ID) within classes for linking with model driver data and validation data. The specific issues that were addressed include: •
• •
Biome class consistency – The review of biome assignments was prompted in part by the problems in using the satellite-derived land cover for each site (i.e., often this represented the dominant land cover for a 1 x 1 km area, not the cover for the 1 x 1 m to 1-hectare NPP measurement site). Managed sites – The EMDI modelers decided to flag and exclude likely heavily managed sites and wetlands from the EMDI comparison. Multiple NPP values for a site – Some sites have several NPP values, often from several vegetation types. We assume this is often a result of reporting imprecise latitude/longitude coordinates. Some Class B sites have up to 35 observed NPP values at a site. Each site was assigned an EMDI biome class and the biome of every NPP measurements at the site
4
Class A
Class B
Class C
Fig. 1. Global distribution of Class A (Fig. 1a) and Class B (Fig. 1b) sites and Class C grid cells (Fig. 1c). 5
reviewed. Those NPP data that were inconsistent with the site biome were flagged. This resulted in 187 Class B measurements being dropped for the EMDI activity. A few Class C cells also had multiple NPP values where data had been compiled based upon different studies. This report describes the compilation of NPP estimates for 2,525 sites and 5,164 0.5° grid cells compiled under the GPPDI (Table 3). This report also documents the results of the EMDI review and outlier analysis that produced a refined set of NPP estimates and model driver data for the EMDI workshops. Often we estimated missing NPP components for sites using the approaches described in Appendices B and C. The EMDI process resulted in 81 Class A sites, 933 Class B sites, and 3,855 Class C cells derived from the analysis of NPP measurements and associated driver data. The average NPP for major biomes in each of the Classes is presented in Fig. 2. Documentation of the content and organization of the EMDI databases are provided in Appendix D. Table 3. GPPDI and EMDI data sets Number of records Date compiled Description Class A Class B Class C 162 2,363 5,164* October 1999 GPPDI NPP measurements, many sites with multiple measurements EMDI NPP and driver data set of sites with 81 933 3,855 March 2000 outliers excluded and means of multiple measurements *Data for Class C cells was expanded in October 2000.
2. MODEL DRIVER DATA Model driver data (e.g., vegetation type, climate, and soils associated with a site used to parameterize ecosystem models) were compiled from global databases specifically for the EMDI workshops. The information is consistent for all sites but may represent a value for a 5-km or 5minute grid cell within which a Class A or B site is located, thus the data may not necessarily reflect the conditions at the specific site of the NPP measurement. The same sources of driver data were used for the Class A and B data sets and an initial subset of Class C data; however, the driver data for the full set of Class C cells for EMDI II was taken from different sources than for EMDI I. Although EMDI I included a set of 2768 Class C grid cells, a significant increase of Class C grid cells was available for EMDI II and the processing was performed on the expanded set. In late 2000, the Class C data set was expanded to 5,164 cells representing 3,980 unique sites. We compared the original EMDI I driver data for 1637 cells in the U.S. Great Plains and eastern U.S. forests with the new driver data for the same cells provided with the expanded Class C data set to confirm that there were no significant differences between the two sets of driver data. This included using scatter plots to compare driver data from each source for soils, Normalized Difference Vegetation Index (NDVI), temperature, and precipitation and matching landcover types and biomes. Scatter plots were compared for four months (January, April, July, October) of the year for temperature, precipitation, and NDVI. We determined that the driver data for the expanded Class C cells were consistent with the driver data used for Classes A and B.
6
Fig. 2. Mean NPP and number of measurements for aggregated biomes for Class A, B, and C data sets. 2.1 ELEVATION For Class A and B sites, the site elevation was used when available. However, approximately 25% of Class A and 50% of Class B measurement sites lacked a site-specific record of elevation. Rob Braswell, University of New Hampshire, generated elevations using the U.S. National Geophysical Data Center's TerrainBase Digital Elevation Model (DEM), which has a 5-minute resolution (approximately 10 km at the equator). Because of the limited precision of both the site coordinates and the DEM algorithm, we acknowledge that the latitude/longitude/elevation values may contain significant errors. Approximately 5% of the elevations based on the DEM had significantly negative elevations (>100 m below sea level), a likely indicator of compounded errors. Elevations for Class C cells were assigned by Daolan Zheng based on an alternative 1-km DEM derived from the Global Land One-km Base Elevation (GLOBE) Project, a quality-controlled global DEM developed by the U.S. National Geophysical Data Center for International Geosphere-Biosphere Programme - Data and Information System (IGBP-DIS): http://www.ngdc.noaa.gov/seg/topo/globe.html Aggregation of the GLOBE DEM 1-km elevations to 0.5° cells resulted in only 0.2% of cells with significantly negative elevations. The GLOBE database was not available in 1999 when the Class A and B sites were assigned elevations.
7
2.2 SITE BIOME CLASSIFICATION Twenty-one biome classes were defined at the EMDI workshop to represent the data and needs of the models (Table 4). Sites were assigned to a biome based on initial biome class, sub-biome, species, vegetation type, and elevation. The 21 biome types were grouped into 12 types based on similarity and the number of Class A and B sites to ensure there were enough data (at least 30 to 40 sites) within each aggregated biome to conduct the outlier detection described in Sect. 5. Heavily managed sites or sites typically not addressed by regional models, including crop, pasture, plantation, and wetland biome types, were assigned to a single “Managed” type. These sites were flagged and excluded from the EMDI exercises. Table 4. Biome categories for Class A and B sites as defined at the EMDI I Workshop Biome type Aggregated biome type Number of sites Class A Class B Crops Managed 14 Pasture Managed 17 Plantation Managed 27 Wetland Managed 46 Deciduous broad-leaf forest / boreal DBL forest / boreal 6 43 Deciduous broad-leaf forest / temperate DBL forest / temperate 6 233 Deciduous broad-leaf forest / tropical DBL forest / tropical 6 17 Desert Desert 26 Deciduous needle-leaf forest / boreal DNL forest / boreal 9 29 Evergreen broad-leaf forest / temperate EBL forest / temperate 250 Evergreen broad-leaf forest / tropical EBL forest / tropical 27 102 Evergreen needle-leaf forest / boreal ENL forest / boreal 56 117 Evergreen needle-leaf forest / temperate ENL forest / temperate 6 210 Grassland / C3 Grassland 10 41 Grassland / C4 temperate Grassland 6 18 Grassland / C4 tropical Grassland 30 32 Mediterranean Savanna 12 Mixed forest Mixed forest 49 Savanna / temperate Savanna 1 Savanna / tropical Savanna 8 Tundra Tundra 24 Total Records 162 1317 Biome type for Class C cells was based on information obtained from or reported by each individual study. If the biome was not available (e.g., in Senegal), then we used an aggregated type based on the Hansen et al. (2000b) 1-km product as discussed in Sect. 2.3. The biomes are listed in Table 5, including the scheme that was used to consolidate the biomes into types consistent with the Class A and B aggregated biome types (Table 4). 2.3 LAND COVER Land cover was extracted by Steve Prince and Robb Wright, University of Maryland, from the University of Maryland's 1-km Global Land Cover product (Hansen et al. 2000b; http://www.inform.umd.edu/geog/landcover/1km-map.html). This data set was compiled at the
8
Laboratory for Global Remote Sensing Studies, housed within the Geography Department at the University of Maryland, U.S.A. (http://www.inform.umd.edu/geog/landcover/global-cover.html). Because of the limited spatial resolution of the database around coastlines (and especially islands), approximately 5% of the study sites were assigned a cover type of 0 (water). The land cover codes and respective classes are shown in Table 6, with the abbreviations used in the data file indicated in parentheses.
Biome type Arid shrubland Bare ground Boreal Boreal conifer-dominated Boreal forest Closed shrubland Crop Deciduous forest Evergreen forest Forest Grass Grassland Open shrubland Savanna Subtropic forest Temperate forest Wooded grassland Woodland Xeric forest Total
Code 0 1 2 3 4 5 6 7 8 9 10 11 12 13
Table 5. Biome categories for Class C cells Aggregated biome type Number Shrubland 64 Bare ground 7 Forest / boreal 4 ENL forest / boreal 82 Forest / boreal 66 Shrubland 1 Crops 220 DBL forest / tropical 16 EBL forest / tropical 1195 Forest / temperate 2 Grassland 2285 Grassland 33 Shrubland 520 Savanna 69 Forest / tropical 10 Forest / temperate 342 Wooded grassland 115 Forest 2 Forest / xeric 131 5164
Table 6. Codes for UMD land cover data Class (abbreviation) Water (water) Evergreen needleleaf forests (needle_e) Evergreen broadleaf forests (broad_e) Deciduous needleleaf forests (needle_d) Deciduous broadleaf forests (broad_d) Mixed forests (mixed) Woodlands (woodland) Wooded grasslands/ shrubs (woodgrss) Closed bushlands or shrublands (shrub_cl) Open shrublands (shrub_op) Grasses (grass) Croplands (crop) Bare (bare) Urban (urban)
9
Class A sites - The proportion of each of the 14 land cover types in a 9 x 9 patch of 1-km pixels around each point is provided, as a measure of land cover homogeneity and the “representativeness” of the site. The associated land cover value for the centered1-km pixel and the 0.5° pixel from the Hansen et al. (in press) land cover data set is also given. Class B sites - The associated land cover type value for the original 1-km pixel and the 0.5° pixel from the Hansen et al. (in press) land cover data set is provided. The number of unique land cover types (with a possible maximum of 14) in a 5 x 5 neighborhood patch of 0.5° cells around each site provides an indication of the homogeneity in land cover at the site. Class C cells - The 0.5° land cover designation for Class C cells was developed from Hansen et al. (in press) 1-km land cover product derived from satellite data. The accuracy of classification of land cover at 0.5° cell depends heavily on homogeneity in nature. This 0.5° cell landcover map has been available for more than a year or so without any change. Some inconsistencies between field observations and classified land cover types at 0.5° cell size are caused by differences in scales, methods, and other factors that are out of our control. 2.4 CLIMATE The climate data for Class A and B sites were extracted by Wolfgang Cramer and Stephen Sitch, PIK. They used a combination of the long-term monthly averages (1931–1960) from the PIK database (Leemans and Cramer 1991) and a 95-year monthly time series (1900–1995) based on the University of East Anglia climate database (New et al. 2000b; see also New et al. 1999 and 2000a): http://www.daac.ornl.gov/daacpages/climate_collections.html The 95-year series was generated for the Class A sites only, while the 30-year means were generated for all of the Class A and B sites. Latitude, longitude, and elevation were used for interpolation; therefore, estimated climate depends on the accuracy of the site location. The approximate minimum and maximum temperatures were calculated from the average temperature by subtracting or adding one-half the diurnal temperature range. The annual mean was calculated as the mean of the 12 monthly means, while the annual minimum was calculated as the minimum of the 12 monthly minimums (not the mean minimum) and the annual maximum was calculated as the maximum of the 12 monthly maximums. The climate surfaces cover all of the land area north of 60° S and the nearby oceans. Some sites on isolated islands and in Antarctica do not have climate data. For Class C cells, climate variables are calculated by Daolan Zheng based on the data set of New et al. (1999, 2000) for the period 1961–1990 and on the long-term monthly averages (1931–1960) from the PIK database (Leemans and Cramer 1991) to keep the consistency with EMDI I climate data. Transient monthly climate for the 1901–1995 were extracted from New et al. (2000b) for the Class C cells, although the diurnal temperature range was only available for the years 1931– 1995 so that minimum and maximum temperatures were limited to those years. 2.5 SOILS Soils data for EMDI sites were extracted by Dick Olson and Keri Johnson, ORNL, from the IGBP Global Soil Data Task CD-ROM (Global Soil Data Task 2000):
10
http://www.daac.ornl.gov/DAAC/cd_roms.html#soil The prototype data were the same as the final product. From these data sets, we calculated the means of 14 distinct EMDI soil characteristics. Soils data were extracted at a 5-minute resolution for Class A and B sites and at a 0.5° resolution for Class C cells. The soil parameters extracted are given in Table 7. Table 7. EMDI soil parameters extracted from the IGBP Soils Database Name Units Label SAND % w/w Sand content in top 30 cm SILT % w/w Silt content in top 30 cm CLAY % w/w Clay content in top 30 cm WP Millimeters Wilting point in top 30 cm, WP water potential (kPa) = -1500 FC Millimeters Field capacity (water holding capacity) in top 30 cm, FC water potential (kPa)= -10 PAWC
Millimeters
Profile available water capacity in top 30 cm, FC water potential (kPa)= -10 WP water potential (kPa)= -1500
SOILN30 SOILN20 SOILN100 SOILC30 SOILC20 SOILC100 PH BD
g m-2 g m-2 g m-2 kg m-2 kg m-2 kg m-2
Soil nitrogen in top 30 cm Soil nitrogen in top 20 cm Soil nitrogen in top 100 cm Soil carbon in top 30 cm Soil carbon in top 20 cm Soil carbon in top 100 cm Soil pH (water) in top 30 cm Bulk density of top 30 cm
g cm-1
The background information presented below was extracted from the IGBP Global Soil Data Task CD-ROM (Global Soil Data Task 2000). The Global Soil Data Task, coordinated by the Data and Information System (DIS) framework activity of the International Geosphere-Biosphere Programme (IGBP), aims to “assemble a reliable and accessible data set on pedosphere properties on a global scale” (Scholes et al. 1995). Its objectives include the production of (a) specific-purpose derived data-sets (e.g., statistical properties of soil water-holding capacity) for major classes of global soils and (b) spatial data on specific soil properties (e.g., water-holding capacity) at various scales appropriate for modelling and inventory purposes (Scholes et al. 1995). In the first phase of the task, these data are to be derived from (a) the WISE pedondatabase produced by the International Soil Reference and Information Centre (ISRIC) (Batjes 1995) and (b) the FAO-UNESCO Digital Soil Map of the World (DSMW) (FAO 1995). Each pedon-record in the WISE-database is classified in the FAO-UNESCO 1974 legend (FAO 1995). The WISE-database therefore provides soil-profile data that can be directly linked to the DSMW. Hence, it provides a basis for generating statistics on soil properties for major classes of global soils and for
11
different areas of the world at various spatial scales. This document describes one approach adopted, and the software developed (a program called SOILDATA), for generating such data. The following pedotransfer functions are used for deriving secondary pedon-attribute data from the primary pedon records. In all cases, ρi denotes the bulk density (g cm-3), and zi the thickness (m), of soil-horizon i. a) Soil carbon density (kg m-2), the total mass of organic carbon in a given soildepth interval, is given by
∑ 10 ρ
c =
i
i
ci zi
(2)
where ci is the organic carbon content (% by weight) of all soil-horizons i in the required soil-depth interval. b)
Total soil-nitrogen content (g m-2) is given by
N =
∑ 10000 ρ i
i
ni zi
(3)
where ni is the nitrogen content (% by weight) of soil-horizon i. c) The soil water-content (mm) at field-capacity (θFC) and wilting-point (θWP) are derived using the van Genuchten (1980) equation n θ = θ r + ( θ s - θ r ) / (1+ |αψ | )m
(4) where θ is the volumetric water content (m m ), θs is the saturated water content (m3 m-3), θ r is the residual water content (m3 m-3), ϕ is the matrix water potential (kPa) and α, n and m are curve parameters, with m = 1 - 1/n. By default, ϕ = -10 kPa for θFC, and ϕ = -1500 kPa for θWP (IGBP-DIS 1998), although ϕ can be set in each case as required. 3
d)
-3
The profile available water content (PAWC) is given by
PAWC = θ FC - θ WP
(5)
In addition to the soils data from the IGBP Soils Database for Class C cells, the percentage of sand, silt, and clay was compiled from the Zobler (1986) data set. [Available as: Post, W. M. 2000. Global Soil Types by 0.5-Degree Grid (modified Zobler). Available online at http://www.daac.ornl.gov / from the ORNL Distributed Active Archive Center, Oak Ridge National Laboratory, Oak Ridge, Tennessee.] Quality assessment of soils confirmed that the sum of the soil particle-size fractions (sand, silt, and clay) was equal to 100%. 2.6 NDVI NDVI data was extracted from the Pathfinder AVHRR [Advanced Very High Resolution Radiemeter] Land (PAL) data set (James and Kalluri 1994) by Rob Braswell, University of New Hampshire. These data are available as 10-day composites for August 1981 to August 1994 in global 8-km Goode's Homolosine (equal area) projection. The cloud mask that accompanies the PAL 10-day composites was applied, using the most conservative approach of masking all pixels that are flagged as “cloudy” or “mixed.” The NDVI
12
data were recomposited to one month in order to minimize the effects of variable atmospheric conditions and viewing geometry. To extract the time series, the EMDI latitude-longitude coordinates were converted into Goode's X-Y coordinates, then all the 8-km NDVI pixels within a 25-km radius of the EMDI point were averaged (excluding cloudy and quality control (QC)-flagged pixels). Ice- and snow-covered land is generally identified as cloudy by the cloud retrieval algorithm so only vegetated/potentially vegetated pixels are included in the average. Persistent clouds and snow cover will often result in having no pixels associated with the site for some number of months. These missing data are assigned a value of -999. To represent site patterns for modeling, 3-year monthly averages were calculated for Class A and B sites based on 1986, 1987, and 1990. These are the only years that do not contain an instrument changeover or a major pulse of volcanic aerosols. Coincidentally, the 3 years are fairly anomalous with respect to global climate: 1986 and 1987 were ENSO years and 1990 was the warmest year in the AVHRR record. A 13-year average NDVI was provided for EMDI II Class C cells by Daolan Zheng based on an analysis of the relationships between 3-year and 13-year NDVI values. The results of that analysis are briefly summarized in Appendix B. 2.7 ATMOSPHERIC CO2 Estimates of global annual atmospheric CO2 levels from 1832 to 1997 were provided by the Carbon Dioxide Information and Analysis Center (CDIAC) at ORNL (see http://cdiac.esd.ornl.gov/cdiac/). The series is a combination of data from the smoothed Law Dome ice core records for years through 1978 (Etheridge et al. 1998) and Mauna Loa measurements for years from 1979 to present, from the Keeling and Whorf (2001) CO2 data set. The same CO2 data were provided for Class A and B sites and Class C cells. 3. NPP MEASUREMENT DATA The measurements of NPP were categorized as either Class A, representing intensively studied or well-documented study sites; Class B, representing more numerous “extensive” sites with less documentation and site-specific information available, or Class C, representing regional collections of 0.5° latitude-longitude grid cells (Fig. 1). Class A sites – Class A data represent intensively studied or well-documented study sites (e.g., with site-specific climate, soils information, etc.) and have complete NPP measurements and good documentation. Sites include grassland, tropical forest, temperate forest, and boreal forest biomes. Although most of these NPP estimates have been published in the literature, complete information on the methods and site conditions was often not readily available. Class B sites – Class B data represent more numerous “extensive” sites with less documentation and site-specific information available and include study sites from many biomes compiled from existing collections of data. Although most of these NPP estimates have been published in the literature, complete information on the methods and site conditions was often not readily
13
available. The information on Class B sites is generally “as provided” and is not fully standardized or consistent between sites. Class C cells – Class C data represent regional collections of 0.5° latitude-longitude grid cells sites from many biomes compiled from collections of data that have NPP estimates. Most field data for NPP are for relatively small field sites that are effectively points when considered at the 0.5 x 0.5 degree scale commonly used in global biogeochemical models. Thus, direct comparison between field data and coarse resolution model outputs has a high degree of uncertainty. Potential problems in data-model intercomparisons and issues that must be considered during the aggregation of field-scale data to coarser spatial resolutions are discussed by Zheng et al. (2001a, in review). Additional details on developing the Class C data set are provided in Appendix B. 3.1 CLASS A NPP POINT DATA The NPP data compiled by the NCEAS Working Groups and other GPPDI activities were used to create the Class A data the EMDI activity. Under the auspices of GPPDI, a series of three Working Group meetings were held at NCEAS to take extensive but incomplete data sets and make them usable for analyses and models by estimating total NPP in a consistent manner, for points and for grid cells (i.e., 0.5°). In addition, NPP projects at the Oak Ridge National Laboratory (ORNL PI R. J. Olson) and the University of Maryland (UMD PI S. D. Prince) were funded by the NASA Terrestrial Ecosystems Program to compile much of NPP data described in this section. We compiled 162 NPP estimates for 150 unique Class A sites that represent grassland, tropical forest, temperate forest and boreal forest sites that have complete NPP measurements (aboveground and below ground components) and relatively complete documentation. NPP data for 140 of these sites were the product of the extensive review as part of the NCEAS NPP working groups described in Sect. 1 including 30 tropical forests (Clark et al. 2001); 69 boreal forests (Gower et al. in press); and 41 grasslands (Gill et al. in press). These sites had NPP estimates for aboveground and below ground components either as provided by the primary data source or as estimated in the respective synthesis papers. Data for the remaining 10 sites came from a variety of site-specific sources that reported NPP for aboveground and below ground components. These data were reviewed and compiled by Jonathan Scurlock and Dick Olson. Sources included 5 grasslands (Pandey and Singh 1997; Sims and Singh 1978; Singh and Yadava 1997; Uresk, Sims, and Dodd 1996); 3 tropical forests (Clark 1999, DeAngelis et al. 1997, Nye and Greenland 1998); 2 boreal forests (Comear and Kimmins 1999, Linder and Agren 1998); and temperate forests (Waring et al. 1999; P.J. Hanson pers. comm. 1999). For further information and site-specific data, refer to the ORNL DAAC NPP database: http://www.daac.ornl.gov/NPP/npp_home.html The information is generally “as provided”; however, the goal of the NCEAS and ORNL review processes were to select NPP estimates that were based on comparable methods and expressed in common units of measure. Of the original 150 unique candidate sites, 69 sites were eventually eliminated:
14
• • • •
13 sites lacking driver data because of limited spatial resolution in global coverages (e.g., sites near coastal areas, islands, etc.) 22 sites lacking below ground NPP (BNPP) 28 sites for which we were unable to acquire NPP estimates within the EMDI schedule 6 sites were eliminated in the outlier analysis (see Sect. 5).
Most of the NPP estimates were provided in units of dry biomass (organic matter). We converted these to carbon units (e.g., gC/m2/y) using a mass fraction of 0.5 for woody components and 0.45 for grass and foliage components (Raich et al 1991, Scurlock and Hall 1998). If we were unable to determine whether the biomass was predominantly wood or foliage, we used a ratio of 0.475 g C per 1 g biomass. Two files were provided, containing all of the162 individual measurements (NPP_meas) and the 81 site means (NPP_mean) of those unique sites passing the outlier analysis tests. These form the Class A GPPDI and EMDI data sets, respectively. 3.2 CLASS B NPP POINT DATA Class B sites represent grassland, tropical forest, temperate forest, boreal forest tundra, savanna, crops, and plantations sites that have at a minimum aboveground net primary productivity (ANPP) measurements (about 20% have both ANPP and BNPP), a site location, and documentation (e.g., a literature citation). Most of the Class B data (1324 NPP estimates) represent existing multi-biome collections of data available from the ORNL DAAC (http://daac.ornl.gov/NPP/npp_home.html) (DeAngelis et al. 1997; Esser et al. 1998; Hall 1997; Kicklighter 1999; Krankina 1999; Ni et al. 2001, Waring et al. 1999). An additional 130 NPP estimates were assembled from the ORNL NPP collection of individual sites and 909 NPP estimates were acquired from Tom Gower (see Sect. 3.2.3). Although most of these NPP estimates have been published in the literature, complete information on the methods and site conditions was often not readily available. The information on Class B sites is generally “as provided” and is not fully standardized or consistent between sites. The following describes the Class B data that Jonathan Scurlock and Dick Olson extracted from the ORNL DAAC NPP data collections, compiled as part of the NPP project at ORNL with funds from the NASA Terrestrial Ecosystems Program. 3.2.1 ORNL DAAC Data Sets Chinese forests NPP data set – Data on biomass and NPP of major Chinese forest types were compiled based on the inventories of the Forestry Ministry of China between 1989 and 1993. Additional data were obtained from published forest reports, as well as from more than 60 Chinese journals and some unpublished literature up to 1994 (Luo 1996; Ni et al. 2001). The data cover six major forest biomes, including 690 study sites from 17 forest types in China, ranging across a substantial geographical area, from sub-boreal Larix forests in northeast China (Heilongjiang Province; approx. 53° N, 122° E) and northwest China (Xinjiang Province; approx. 48° N, 86° E) to tropical rain forests in southern China (Yunnan Province; approx. 22° N, 100° E) and Hainan Island (18° N, 108° E). Latitude, longitude, elevation, leaf area index, total biomass, and total NPP (the sum of aboveground and below ground components) are given for each site.
15
Chinese forests, which cover about half of the total area of China, contain perhaps the widest range of types in the world, ranging from boreal forest and mixed coniferous broad-leaved forest in the north, temperate deciduous broad-leaved forest and coniferous forest in the central region, to subtropical evergreen broad-leaved forest, warm temperate coniferous forest, tropical rain forest, and seasonal forest in the south. The elevation of the forest study sites ranges from 10 to 4240 m (mean = 1385 m), and stand age from 3 to 350 years (mean = 66 years). Total biomass ranges from 3114 to 156985 g/m2 (mean = 18500 g/m2), total NPP (aboveground plus below ground) from 241 to 4027 g/m2/yr (mean = 1440 g/m2), and leaf area index (projected) from 0.17 to 41.78 (mean = 8.9). Caution is advised in using these data because conversions were universally applied that may not be consistent with the methodologies used to collect the data. IBP woodlands data set – The IBP (International Biological Programme) Woodlands Data Set (DeAngelis et al. 1981) consists of contributions from 117 international forest research sites, all but a few associated with projects committed to the IBP. The data were collected in the 1960s and early 1970s and compiled into a single data set at the ORNL to facilitate comparisons involving the diverse woodland ecosystems. Representatives of almost every kind of forest ecosystem are present in the data set. A hierarchical scheme was used to assign a forest type to each site based on the climate, life-form, and status features of the site. Included are sites of the following types, with the number of each type in parentheses: tropical (26), Mediterranean (3), temperate (55), and boreal (33). With respect to life form, 72 sites were dominated by broad-leaved species and 45 were needle-leaved. There were 65 deciduous stands and 52 evergreen. Finally, 89 sites consisted of natural forest and 28 were managed. Osnabrück NPP data set – An extensive compilation of field data on NPP of natural and agricultural ecosystems worldwide was synthesized in the 1970s and early 1980s by Professor H. Lieth, Dr. G. Esser, and others (Esser et al. 1997). Much of this work was carried out at the University of Osnabrück, Germany. More than 700 single-point estimates of NPP or biomass were extracted from the scientific literature, each with a geographical reference (latitude/longitude). The literature cited dates from 1869 to 1982, with the majority of references from the 1960s and 1970s. In the early 1970s, a subset of these NPP data was used by Lieth, Esser, and co-workers to develop and test a series of statistical models of NPP as a function of mean annual temperature and precipitation. The later versions of these models included modifications for soil, seasonality, agriculture, and other human influences [“Osnabrück Biosphere Model” (Esser 1992), “High Resolution Biosphere Model” (Esser and Lautenschlager 1994), etc.)]. Most of the 720 unique NPP records (632 or 88%) have been matched to a bibliography of 356 references from the literature. About two-thirds of the 720 records have aboveground NPP estimates that range between 1 and 8530 g/m2/yr (dry matter) or 2923 g/m2/yr, excluding outliers, wetlands, and crops/pastures and other likely managed systems. Total NPP, for which more than half of the sites have estimates, ranges from 3 to 9320 g/m2/yr (dry matter) or 3580 g/m2/yr, excluding doubtful values, wetlands, and crops/pastures and other likely managed systems. Each record includes a site identifier, latitude, longitude, author, country, NPP estimates, vegetation type, and other variables. The vegetation-type field begins with a generalized biome type (including tundra, forest, Mediterranean, savanna, grassland, desert, wetland, and a number of managed vegetation types) and is followed by more specific vegetation terminology derived from the original data (Esser et al. 1997). A single NPP value (NPP_C) is included for each site that represents the sum of ANPP and BNPP components, expressed in grams of carbon per square meter per year (g C/m2/yr). Where
16
BNPP was not reported, it was assumed to be equal to ANPP. A ratio of 0.475 was used to convert dry biomass weight to carbon content. OTTER NPP data set – The Oregon Transect Ecosystem Research Project (OTTER) was conducted to develop a strategy to extrapolate point measurements and estimates of ecosystem structure and function across large geographic regions that varied in climate and vegetation. The OTTER NPP Data Set (Runyon et al. 1994), described here, contains only the estimates of NPP and associated measurements from the OTTER transect, made during the period 1989–1991 (Runyon et al. 1994). The study region was a transect that began near Cascade Head Experimental Forest, north of Lincoln City, Oregon (44.95° N 124.02° W), and extended approximately 250 km to Redmond (44.27° N 121.17° W), located in the high desert interior of Oregon. The transect included six forest ecosystem sites selected from the same forest community types as an earlier study of biomass, leaf area, and NPP (1976–1977) by Dr. H. L. Gholz. Mean annual temperature varied inversely with elevation, from 11.2° C (170 m) to 6.0° C (1460 m). Annual precipitation ranged from 220 mm at the eastern-most site to 2510 mm at the coastal sites, but did not vary linearly across the intervening sites. Scots Pine NPP data set (Siberia) – Data from 14 stands of Scots Pine at two locations in Siberia were compiled by Olga Krankina of Oregon State University, U.S.A., from reports by Gabeev (1990) and Buzykin (1978). These plots represent one of the main dominant tree species in Siberian forests, growing in stands of relatively high density and productivity. Data reported in Gabeev (1990) were gathered from stands studied under the former USSR International Biological Programme in Tomsk Region, Western Siberia (approx. 58° N 83° E; 54-year mean precipitation = 501.2 mm). Aboveground measurements were obtained using standard allometric forestry methods, and below ground data were originally reported in considerable detail by size, class, and depth. Data reported by Buzykin (1978) are from a study of carbon and nutrient cycling in the forests of the Angara River basin, Irkutsk Region, near Lake Baikal (approx. 53° N 103° E). Here, Scots Pine (Pinus sylvestris) is the dominant tree species on about 26% of the forested area. Trees were measured by standard allometric methods on 0.3 to 0.4-hectare plots and understory was determined from twenty 0.25-hectare plots at each site for three successive years. Data on litter fall are mean values from 1968 to 1974 and were reported separately for needles, bark, branches, cones, and other litter. Below ground biomass was determined by excavation of entire root systems, and root turnover was estimated for different size classes. Superior National Forest – NPP of a boreal forest was determined at 31 spruce and 30 aspen forest stands in the Superior National Forest near Ely, Minnesota, U.S.A., in 1983 and 1984 by the NASA (Hall et al. 1992). The purpose of the experiment was to investigate the ability of remote sensing to provide estimates of biophysical properties of ecosystems, such as leaf area index (LAI), biomass, and NPP. These ground-based estimates of aboveground biomass and NPP are available; more ground measurements plus the satellite, aircraft, and helicopter observations for the study site are also available. The study area covered a 50 x 50 km area centered at approximately 48° N latitude and 92° W longitude in northeastern Minnesota at the southern edge of the North American boreal forest. Sites for biophysical measurements were chosen to be pure spruce or aspen stands. Allometric equations were used to find the height and radial increment as a function of crown height and diameter at breast height. Terrestrial Ecosystem Model (TEM) NPP data set – TEM is a process-based model developed by staff at the Ecosystems Center, Marine Biological Laboratory, Woods Hole, Massachusetts, U.S.A. (McGuire et al. 1992). Data on pool sizes and fluxes of carbon and nitrogen from 16 field study sites in a wide range of biomes from tundra to tropical forest, but excluding wetlands, were
17
used to calibrate the model. Data were compiled from the appendix to McGuire et al. (1992). Mean annual values of carbon in vegetation, nitrogen in vegetation, carbon in soil, nitrogen in soil, and inorganic nitrogen in soil, are in g/m2 of either carbon or nitrogen. Values of gross primary productivity, NPP, nitrogen uptake by vegetation, saturation response of NPP to nitrogen fertilization, and the annual amount of nitrogen mobilized for production via recycling are in g/m2/yr. 3.2.2 Combined Class B Data Sets A set of 1690 candidate locations (latitude/longitude) were identified by combining the data from the sources just listed, often with multiple NPP estimates available for each location. Certain locations, such as the carbon dioxide (CO2) flux tower sites, Earth Observing System (EOS) validation sites, and the International Long-Term Ecological Research (ILTER) Global Network of Environment and Technology (GNET) sites, were included with the expectation of having NPP data later in 1999, but these were not available at the time of the EMDI workshop (December 1999). Some sites were “flagged” to indicate that the NPP estimate was thought not to be representative of the natural conditions at that location (e.g., fertilizer treatments). The final number of Class B sites used in the EMDI workshop was less than 1690 after elimination of sites for a series of reasons. Some of the reasons include • • • • •
sites lacking either latitude or longitude, crop sites that were fertilized or irrigated, sites lacking driver data because of limited spatial resolution in global coverages (e.g., sites near coastal areas, islands, etc.), sites for which we were unable to acquire NPP estimates within the EMDI schedule, and sites were eliminated in the outlier analysis (see Sect. 5).
3.2.3 Additional Class B Data Sets In October 1999, Tom Gower, University of Wisconsin, provided a supplementary NPP data set containing 2193 records, including many records that he obtained from ORNL DAAC NPP sources. He extracted additional NPP data from Cannell (1982) and a variety of more recent sources. We performed the following processing to select records from Gower’s data set that were not already in the Class B set which were then combined with the existing set of Class B records. First we eliminated sites that had the same latitude/longitude as already in the Class B set of 1900 records as of October 8, 1999. We also removed sites that were not included in the set of 1690 Class B sites with driver data. This eliminated most of the duplicate ODS, IBP, TEM, SNF, OTTER, and other sites in Gower’s file, resulting in about 1000 new unique records. We favored the NPP data from the ORNL compilation when similar data were in the Gower compilation because we had already removed sites with known fertilizer or irrigation treatments and we had also dropped data for crops when only the ANPP values were recorded. We identified and dropped records in Gower’s file that were missing latitude or longitude, had no NPP, or had NPP exceeding 4000 gC/m2/y (and were almost certainly fertilized). Additional duplicate records were dropped that had identical NPP values. The final Gower subset included 909 records representing 273 new sites. Gower's NPP values were multiplied by 47.5 to convert from t/ha/yr (organic matter) to gC/m2/y. It was noted that the ANPP estimates in the Gower set was about 40% higher than in the ORNL set. The resulting
18
Class B data set contained 2363 NPP measurements for 1271 unique sites, 75% of the 1690 sites. We then calculated the min/mean/max for the 1271 unique sites to distribute to the modelers. 3.2.4 Estimating Total NPP For those sites lacking a value for total net primary productivity (TNPP), we estimated TNPP (NPP_EST) from ANPP or BNPP by calculated biome-specific ratios from sites that had both ANPP and BNPP measurements. We calculated these ratios based on the biome classification reviewed at the EMDI I workshop and using data with outliers excluded (see Sect. 5). The rations of ANPP to BNPP differ by biome (Fig. 3). Based on our analysis, we used a ratio of 0.5 BNPP:TNPP for grasslands, deserts, and tundra and a ratio of 0.22 BNPP:TNPP for forests (see Appendix C). Two files were provided for the Class B sites, one having the 2363 individual measurements (NPP_meas) and one having the mean NPP for each of the 933 unique sites (NPP_mean) of those measurements passing the outlier analysis.
em pe fo re ra -D st te N / tro L fo EB pi re ca L st l fo / re bo st re /t EB em al L pe fo ra re te s EN t/ tro L EN fo pi re ca L st l fo /b re st or e /t e m al pe ra M te ix ed fo re st D es er G t ra ss la nd Sa va nn a Tu nd ra O ve ra ll BL
D BL
D
D BL
fo
re
st
/t
Ratio BNPP to TNPP
0.7 0.6 0.5 0.4 0.3 0.2 0.1 0
Biome Fig. 3. Mean ratio and standard error of below ground (BNPP) net primary productivity to total NPP for aggregated biomes. 3.3 CLASS C NPP GRID CELL DATA NPP and driver data for EMDI II Class C cells were compiled by Daolan Zheng and Steve Prince, Geography Department at UMD (version dated October 4, 2000). Drivers includes elevation, biome, monthly climate (mean, min, and max temperature and total precipitation), NDVI, and soil texture (fraction sand, silt, and clay). The specific contents are described in Appendix B along with notes describing the processing performed by UMD. The EMDI II Class C grid cell-based data set was derived from the 5164 NPP estimates for 0.5º grid cells in the GPPDI database. The GPPDI database contains 3555 estimates (79% in the
19
U.S.A.) that were developed from 14 studies representing NPP in croplands, sparse vegetation, shrublands, grasslands, and forests worldwide (Zheng et al. 2001a) plus an additional 1609 cells added after the Zheng et al. (2001b) paper was submitted. The data set consists of new data for 2334 grid cells from Australia, China, South America, Senegal, Finland, and Sweden combined with the 2830 cells from Class C data for the United States compiled for EMDI I (Table 8). Total NPP ranged from 3 gC/m2/y for sparse vegetation to 1235 gC/m2/y in forest, while aboveground NPP ranged from 3 to 890 gC/m2/y (Zheng et al. 2001a). During the analysis of the set of 3555 Class C grid cells, it was discovered that there were 17 grid cells located along the transition between grassland and forest in the U.S.A. with multiple biome assignments and 1 cell in Australia with no driver data. Therefore, a set of 3837 unique cells was available for model-data intercomparison.
Cell ID range 1000s: 2000s: 4000s: 5000s: 6000s: 7000s: 8000s: 9000s: 10000s: 11000s: 13000s: 14000s17000s: 18000s: 19000s: 20000s21000s: 22000s: Total
Table 8. Sources and information about Class C grid cell NPP Sources Location Number of cells Larry Tieszen Great Plains, U.S.A. 922 M. Hansen Yellowstone, U.S.A. 3 Ken Day Australia 1 Scott Goetz Minnesota, U.S.A. 2 Jennifer Jenkins Mid-Atlantic and Maine, U.S.A. 245 Olga Krankina Russia, SE and NE U.S.A. 8 Osvaldo Sala Great Plains, U.S.A. 100 Steve Prince Mid-West, U.S.A. 220 David Turner Pacific Northwest, U.S.A. 1 Robin Kelly, Bill Parton Great Plains, U.S.A. 1262 Sandra Brown Eastern U.S.A. 62 Damien Barrett Australia 615 Daolan Zheng O. Diallo Jim Raich
Finland and Sweden Senegal South America
82 32 1510
H. Jiang
China
99 5164
3.3.1 Scaling Methods Many of the studies provided estimates for ANPP but not TNPP (see Table 9). Where possible we have calculated missing components to provide estimates of TNPP as described in the notes in Sect. 3.2.4. In addition, a variety of methods were used to derive the 0.5º grid-cell estimates. Table 9 summarizes methods used by each study. Principal methods used for estimation of 0.5º cell NPP data include • • • •
stratification of grid cells and area weighting of field NPP observations in each stratum; aggregation of finer scale (plot or stand level) spatial inventory data; local modeling of NPP using key environmental variables, for which maps are available; and direct correlation of ground measurements with remotely sensed vegetation indices.
20
Table 9. Summary of the availabilities of ANPP and TNPP in the 16 original studies (y=yes, n=no, and e=estimated) along with NPP estimation and scaling methods Cell ID ANPP TNPP NPP estimation method 0.5º Cell scaling method range 1000s: y y Rangeland inventory Aggregated to 0.5° cells based on 1-km cells derived from soil maps 2000s: y n Measurements of DBH Multiple regression – cover type, increment (540 plots) within topography, soils for each stand type uniform stands 4000s: y n Measurements of grassland GRASP pasture production model biomass increment based on rainfall 5000s: y y Forest inventory (2711 plots) mean of plots for given forest type, then areal weighted 6000s: y y Forest inventory (2640 plots) Weighted mean of plots in cells 7000s: y y Forest inventory mean of stands for different type (in Russia) or means of counties (in U.S.A.), areal weighted or resampled 8000s: y e Rangeland inventory Means by Major Land Resource Areas (MLRA) associated with 0.5º cells within MLRAs 9000s: n y Crop inventory and growth Means by county extrapolated to 0.5º model 10000s: n y Literature giving estimates by Association of NPP with high resolution stand age map of stand age 11000s: y y Rangeland inventory Empirical relationship with precipitation used with 13000s: e e Forest inventory by county Association of 0.5º cells within counties 14000sy y Literature Least-squares statistical model based on 17000s: climate, soils, and vegetation 18000s: y y 5-year set of forest Calibrated TM/AVHRR imagery with measurements (660 plots) with field data, aggregate to 0.5º cells allometric equations 19000s: y n 11-year set of measurements for Calibrated AVHRR Model with field major cover types data 20000sn y Calibrated model based on TEM model simulations for 0.5º cells 21000s: literature values Mean NPP for 33 forest classes, 22000s: n y Forest inventory (>1000 plots) extrapolated to region at 6-km, aggregated to 0.5º cells
21
3.3.2 Individual Data Set Descriptions Several of the data compilers (Goetz, Jenkins, Krankina, and Brown) used the USDA Forest Service Forest Inventory and Analysis (FIA) data and another group of the data compilers (Sala, Tieszen, and Kelley) used the USDA Soil Conservation Service rangeland productivity inventory. We present a general overview of the FIA and Rangeland data here, while the subsections below provide details about how each scientist extracted NPP data from these or other databases. Table 8 provides a summary of the number of cells and geographic location, cross-referenced by Cell IDs. USDA Forest Inventory and Analysis Data (FIA) – The USDA Forest Service has conducted periodical and extensive surveys of nation's forested land since 1928 (Birdsey and Schreuder 1992). While an annual sampling scheme is currently being implemented nationwide, recent inventories have typically been conducted every 10 to 13 years in the Pacific northwestern states (Zheng and Alig 1999), 5 to 7 years in the southeastern states, and 10 to 15 years in the northeastern states (Jenkins et al. 2001). Plot- and tree-level inventory data can be obtained from the Eastwide Forest Inventory Database (Hansen et al. 1992) established and maintained by USDA Forest Service FIA units in the Northeastern, North Central, Southern, and Southeastern Research Stations. For the eastern United States, inventory samples are collected separately for each state and follow a two-phase scheme. In phase 1, remotely sensed data (such as airphotos or satellite imagery) are interpreted and classified on land cover (cropland, urban, pasture, forest, etc.). For forested land, more detailed classes may be identified based on additional variables, such as species group, timber volume, and stem density; the criteria used to define categories for forested lands differ from state to state. In phase 2, ground plots are stratified by photoclass and established in random locations or grid points across the landscape both to correct any errors made during photo interpretation and to gather information that cannot be obtained from the remotely sensed data. Each of the plots chosen for sampling during phase 2 is visited by a specially trained field crew. The inventory sample for forested plots consists of a set of plot-level measurements (e.g., geographic coordinates, basal area, total timber volume, forest type, and land use classification, and a set of tree-level measurements (e.g., species, diameter at breast height, and sawlog volume). As state inventories are completed, county-level summaries are compiled and presented in published reports at the state level. USDA Rangeland Productivity Inventory – The USDA Rangeland Productivity Inventory includes productivity estimates for 9498 sites throughout the Central Grassland region of the United States (Joyce et al. 1986). For each site, the database contains estimates of primary production for favorable, unfavorable, and average years, as well as a description of the soil profile that includes texture of the A horizon. Primary production included the aboveground parts of all plants (except mosses and lichens) produced during a single growth year, regardless of accessibility to grazing animals. Cell ID = 1000s (Tieszen et al. 1997) – In the Great Plains region, NPP was calculated using a combination of methods. The State Soil Geographic (STATSGO) database was used to estimate mean potential ANPP for map units related to soil surveys at each site (Tieszen et al. 1997). These, or the more detailed county soil and range survey data, were mapped for each cell and used to display ANPP across the cell. The algorithm derived by Gill et al. (2001) was used to convert from ANPP to total NPP, as follows:
22
NPP = ANPP + BNPP
BNPP = BGbiomass * root live:total matter * root turnover rate BGbiomass = (AGbio*0.79)-((MAT+10)*33.3)+1289 where AGbio = peak aboveground live biomass interchangeable with ANPP MAT = mean annual temperature (ºC) root live:total matter = 0.6 This provided a spatially explicit estimate of potential NPP for average climatic conditions and was aggregated for each 0.5º cell. Cell ID = 2000s (Hansen et al. 2000a) – Ninety sample stands were stratified by cover type and elevation, and the results used to predict ANPP across a portion of the Greater Yellowstone Ecosystem (9500 km2). Each stand contained six plots. Tree ANPP was estimated by sampling tree density by species and diameter classes and estimating average annual diameter increment by tree coring (Hansen et al. 2000a). Shrub ANPP was estimated by calculating current biomass from basal area using BIOPAK (Means et al. 1994) and dividing by the assumed average life span of the shrubs. Multiple regressions were used to examine relationships between ANPP and other dependent variables such as cover type, topography, and soil. The best regression model was used to predict ANPP across the study area. Cell ID = 4000s (Day et al. 1997) – The GRASP model (Day et al. 1997) was calibrated and used to estimate NPP for small cells which were aggregated to estimate NPP for the 0.5° cells. In Queensland the GRASP model has typically been calibrated from field measurements in small exclosures (approximately 30 m x 30 m). Exclosure of stock during the measurement period minimizes loss of biomass through grazing. Removal of carry-over pasture biomass by mowing or burning at the beginning of the season minimizes losses due to detachment. Thus the measurements of biomass increment more closely represent growth. The calibrated model is validated in time and space by comparing model output to independent data from either the same exclosure, other exclosures, clipping trials, or grazing trials. Grazing trials typically run for a number of years and test a range of stocking rates. Thus they allow the model to be validated under grazed conditions for several years at a small paddock scale (hectares). Provided that processes operating at the grazing trial scale are representative of commercial scale paddocks, the model can be used to calculate pasture growth for broader regions. ANPP was calculated for a 50 x 50 km2 region of Astrebla grassland in Queensland for the purpose of validating global ANPP models. The region chosen (between 21.0 to 21.5°S and 143.5 to 144.0°E) was spatially uniform but was characterized by marked year-to-year variation in calculated ANPP. Data from similar pastures within 250 x 50 km from the region were used to calibrate and validate a pasture production model, GRASP. In turn GRASP was used to calculate ANPP for 39 years for 100 5 x 5 km2 cells which were aggregated to 50 x 50 km2. ANPP was calculated with the calibrated GRASP model (Day et al. 1997) for a 50 x 50 km2 region surrounding Stamford in northwestern Queensland. Using interpolated rainfall and climate data as input, ANPP was calculated for each of 100 5 x 5 km2 cells that in turn were aggregated to the 50 x 50 km2 region. Calculated annual ANPP for the 39-year period in the Stamford region was approximately 2400 kg/ha, ranging from under 100 kg/ha to 3300 kg/ha between years. The GRASP model was calibrated to exclosure measurements (J. O. Carter , unpublished data) at Toorak Field Research Station (21.00ºS, 141.80ºE). Although Toorak is approximately 200 km to the west of the Stamford study area, it is also in the Julia land system and the rainfall regime in
23
both locations is almost identical. The calibration data was obtained over two growing seasons in 1986–1987 and 1987–1988. The first year was moderate in terms of rainfall and an irrigation treatment was also applied. The second year was extremely poor in terms of grass production. Thus these data provide a range of seasonal conditions for model calibration. Cell ID = 5000s (Goetz et al. 2001) – The latest Minnesota FIA field inventory (see FIA description above) was completed between 1988 and 1990 (Hansen et al. 1992) and included 43,957 forested and non-forested plots. Of these, 12,464 plots were located in the northern portion of the state (north of 47.5º lat.), 4675 of these plots had been measured more than once, and 2897 of the re-measured plots were classified as timberland or forestland. Of these, the 2711 plots with a nonzero value of basal area (BA) were used for this analysis. Plots were assigned to a forest type (white spruce, tamarack, etc.) by the North Central FIA Unit based on the relative BA in each species. The average length of time between inventory measurements was 11.75 years. Aboveground wood NPP was defined as: NPP = biomass (t1) – biomass (t0) / (t1 – t0) Biomass estimates for current conditions (t1) were found on a tree-by-tree basis using speciesspecific regression equations as described above. Biomass increment on a per-unit-area basis was found by multiplying the tree-level estimates by an expansion factor denoting the number of trees per unit area represented by that stem. Biomass estimates for each stem at the previous inventory (t0) were also found from dbh. Dbh at the time of the previous inventory was used directly from the Eastwide Forest Inventory Database, or was estimated as described here. Every tree measured in the current inventory (t1) falls into one of four categories: alive and measured in the previous inventory (dbh at t1 and t0 are both recorded); alive but not measured in the previous inventory (live, cut, and dead trees between 2.54 and 12.7 cm dbh fall into this category); harvested between t0 and t1; or died between t0 and t1. Dbh values from the previous inventory (t0) for live trees with two dbh measurements were used directly from the Database. The North Central FIA unit estimates dbh for cut trees at the time of harvest and for dead trees at the time of death, so the current (t1) and previous (t0) dbh values for cut and dead trees were used as recorded in the Database unless no dbh value was recorded at the previous inventory. For ongrowth trees (i.e., those that were measured in the current inventory but were too small [less than 12.7 cm dbh] to have a dbh recorded from the previous inventory [Birdsey and Schreuder (1992)], dbh at the time of the previous inventory was estimated using a simple linear algorithm relating dbh increment to tree size class. This algorithm was developed from inventory measurements of 89,938 live re-measured trees in the mid-Atlantic states. If ongrowth trees were cut or dead in the current inventory, they were assumed to have died or been cut halfway through the inventory period. Total aboveground NPP = aboveground wood NPP + estimated litter fall. Estimated litter fall was taken from Brown et al. (1999). Those numbers used were 4000 kg/ha/yr for pine, 3200 kg/ha/yr for spruce-fir, and 4500 kg/ha/yr for hardwoods. Total NPP = ANPP + coarse root + fine root For the complete forest NPP estimates, it was assumed (Raich and Nadelhoffer 1989) that aboveground litter fall = fine root production. Stump plus coarse root biomass was calculated using ratios of stump/ root biomass to above-stump biomass (Wharton et al. 1997, 1998) for
24
species lacking such equations. These ratios ranged from 0.1844 to 0.2109 and were created separately for evergreen and deciduous species for different tree size classes. Cell ID = 6000s (Jenkins et al. 2001) – The potential NPP were calculated based on the FIA data (see description of FIA above) for the northeastern states (Jenkins et al. 2001). The 2640 plots meeting the six criteria (measured twice; timberland; no logging since the last measurement; no damage by insects, disease, or fire since the last measurement; not planted; and basal area >20 m2/ha), were used in the analysis. Total NPP was the sum of wood production, fine litter fall, and fine root production. Litter fall data were from the database compiled by Post and co-workers (see Jenkins et al. 2001) for plots falling within the region studies based on vegetation types. Fine root production was assumed to equal fine litter fall (Raich and Nadelhoffer 1989). The plot-based estimates of biomass and NPP were aggregated to the 0.5º grid cell. A weighted average for each 0.5º cell was computed from the per-unit-area biomass and NPP estimates developed for each plot based on the area expansion factor describing the number of acres represented by that plot. The aggregation was conducted for each 0.5º grid cell using plots whose centers fell within that cell (Jenkins et al. 2001). Cell ID = 7000s (Krankina et al. 2001) – Forest inventory data in both the U.S. and Russia were used for estimating NPP by Olga Krankina. For Russia, four inventory blocks with the total area of 843 ha, 99% of which is occupied by closed canopy forest, were selected randomly from the stand-level database for the Porozhskii ranger district (Krankina et al. 2001). Only forested lands were included in the NPP calculation. The sample contains 124 individual forest stands in a wide range of forest stand ages (15 to 175 years). An area-based estimate of NPP includes 3 steps: (a) calculation of biomass for each forest stand based on wood volume, tree species, and forest age, (b) calculation of NPP base on biomass and age of each stand, and (c) calculation of NPP for the entire sample and for several forest stand categories within the sample. ANPP (gC/m2/y) was calculated for each individual stand polygon based on stand biomass and age using the regression equation developed by Gower et al. (2001) and total NPP was calculated from ANPP (Gower et al. 2001): ANPP = 56 + 2.31 * BIOMASS/AGE (r2=0.68) TNPP = 114 + 1.21 ANPP (r2=0.66) For the eastern United States, Olga Krankina used the FIA data (see description of FIA data above) to estimate NPP at different scales, for different forest age classes, or different forest types. In the first example, the NPP was estimated and reported based on county-level summaries of timber volume increment. The approach is less computationally intensive and is useful when county summaries are more readily available. In the second example, the NPP was estimated at 0.5º scale using tree-level data from the selected plots. The ANPP was calculated as the sum of aboveground biomass increment (Brown et al. 1999) plus litter fall (4.0 Mg/ha/yr for softwoods and 4.5 Mg/ha/yr for hardwoods, respectively). Based on Cairns et al. (1997) study, it was estimated that below ground biomass is 25% of aboveground biomass and that 90% of the below ground biomass is in coarse roots. It was assumed that the ratio of coarse root biomass to aboveground biomass is the same as the ratio of coarse root increment to aboveground biomass increment. This resulted in a ratio between coarse root increment and aboveground biomass increment of 0.225. Fine root production was assumed to be equal to fine litter fall production (Raich and Nadelhoffer 1989). As a result, the total NPP was calculated as the sum of ANPP, coarse root, and fine root production.
25
Cell ID = 8000s (Sala et al. 1988) – A data set collected by the USDA Soil Conservation Service (SCS) at 9498 sites throughout the Central Grassland region of the United States (Joyce et al. 1986). For each site, the database contains estimates of primary production for favorable, unfavorable, and average years, as well as a description of the soil profile that includes texture of the A horizon. Primary production included the aboveground parts of all plants (except mosses and lichens) produced during a single growth year, regardless of accessibility to grazing animals. The regional pattern of ANPP was analyzed by grouping sites into 100 areas that represent the MLRAs within each state, as defined by the SCS. The average of the ANPP of all the sites within a state’s MLRA determine its ANPP. Long-term averages of monthly temperature and precipitation were retrieved for locations near the geographical center of each MLRA. Soil waterholding capacity for each of 9498 sites was estimated from soil texture information. The controls of primary production at the site level were evaluated by multiple regression analysis between ANPP estimates and soil water-holding capacity and climatic variables. As a result, ANPP was estimated as: ANPP = 0.6 * (APPT -56), where APPT is annual precipitation in mm. Cell ID = 9000s (Prince et al. 2001) – Crop NPP in the U.S Midwest states 1992 and the state of Iowa (1982–1996) was estimated from the National Agricultural Statistics Service (NASS, Prince et al. 2001). The counties selected in the U.S. Midwest states must have 50% or more land used in agriculture and less than 20% land in forest cover. The overall approach included: (a) estimation of cropland NPP through the use of harvested yield statistics (provided by the National Agricultural Statistics Service), (b) conversion to dry weight, and (c) calculation of the remaining biological yield estimates using harvest indices and shoot:root biomass ratio to estimate below ground allocation. County-level data were aggregated to 0.5° cell size. NPP values of grid cells crossing county boundaries were calculated with an area weighting method. For Midwest states’ NPP, only cells completely within the boundary of the study area were reported. Cell ID = 10000s (Turner et al. 2000) – The study was conducted over a 96 km2 area of predominantly coniferous forest, centered on the H.J. Andrews Experimental Forest in western Oregon, to estimate NPP and net ecosystem productivity (NEP). One factor strongly related to carbon pools and flux in these forests is stand age class (Turner et al. 1995). A high spatial resolution (25 m) digital map of stand-age class derived from satellite remote sensing was available for the study area (Cohen et al. 1995). NPP, NEP, and biomass carbon estimates for each stand age class were therefore multiplied by the representative areas of each age class. A simple majority filter was used to assign an age class to each grid cell at the coarser resolutions. In the majority rule aggregation algorithm, the cover type with the greatest frequency of 25-m subcells in the coarse-resolution cell determines the label for the coarse-resolution cell. In the case of a tie, a random selection is made among the subcells. The development of the NPP and biomass estimates for each land cover class was based on data in the literature. The trends in woody biomass production were from a stand-level carbon budget for medium productivity PNW west-side Douglas-fir stands (Turner et al. 1995). Biomass estimates and productivity for other ecosystem components were based on previous studies in PNW coniferous forests (Grier and Logan 1977, Turner and Long 1975, Gholz et al. 1985, Vogt 1991). The NPP estimate for the closed agriculture class was a regional average for agricultural land and the semi-open agriculture class was assigned an NPP of half that amount. The ranges for NPP and biomass in the closed forest classes were based on stand-level carbon budgets for low and high productivity PNW west-side Douglas-fir stands (Turner et al. 1995). 26
Cell ID = 11000s (Gill et al. 2001) – ANPP was a function of annual precipitation in the Great Plains region of United States. While BNPP was estimated from ANPP. ANPP = -34 + (0.6 * Mean Annual Precip.) BNPP = BGbiomass * RTratio * RTrate Where RTratio = root: live:total matter = 0.6, RTrate = root turnover rate (3 options determined by ANPP, BGbiomass was estimated from ANPP and mean annual temperature. Cell ID = 13000s (Brown et al. 1999) – Brown et al. (1999) provided estimates of annual mean aboveground wood increments for both hardwood and softwood at the county level using FIA inventory data (see description of FIA data above) in the eastern United States (33 states). They selected those counties with forest cover >75% to estimate ANPP and TNPP at 0.5º resolution. The estimation included several steps at county level: (a) leaf litter fall was calculated (Lonsdale 1988) after the county’s latitude value at the centroid point was identified as log Y = -0.011L + 0.81
(r2 = 0.42)
where Y = leaf litter fall production (Mg/ha/yr) and L = latitude in decimal degrees; (b) fine root production was assigned based on the common assumption that leaf litter fall can be used to estimate fine root production (Raich and Nederhoffer 1989); (c) coarse root production was estimated as 22.5% of aboveground woody increment (Krankina et al. 2001); (d) ANPP = annual mean aboveground wood increments + (a); (e) TNPP = (d) + (b) + (c); and (f) ANPP and TNPP for those 0.5º cells that are entirely located within the selected counties were calculated using area-based weighting factors. As a result, 62 grid cells were obtained from Brown’s study. Cell ID = 14000s–17000s (Barrett 2001) – In a continental-scale study in Australia, Barrett (2001) developed a statistical model of aboveground and total NPP at 0.25º cell size. The independent variables were climate, soil, and vegetation and the dependent variable was potential NPP in the absence of agricultural activities for eight vegetation cover classes. Climate variables were monthly maximum and minimum temperatures and rainfall. The 1:2,000,000 Atlas of Australian Soil provided soil depth class and gross nutrient status of the soil. A two-step process was adopted for developing the least square models: (a) combinations of independent variables were iteratively added and removed until the variance ‘explained’ by each of the regression models for NPP was maximized, and (b) the regression coefficients of these models were then scrutinized to establish their validity. We aggregated Barrett’s NPP into a total of 2550 0.5º cell using GIS focal mean function and selected 615 cells (with the majority class occupied >90% area of a 0.5º cell) into the GPPDI data set. Cell ID = 18000s (Zheng et al. 2001b) – Hame et al. (1997) estimated total plant biomass (TPB) of conifer-dominated boreal forest by establishing and testing relationship between ground measurements and high-resolution satellite data Thematic Mapper (TM) in two small areas in Southern Finland. The method was then applied to a large area (Northern Europe in general) after the digital number values between TM and AVHRR channels were calibrated over the entire area from the west coast of Norway to the Ural Mountains in Russia. We produced NPP maps for Finland and Sweden at 1-km and 0.5º cell sizes based on Hame et al.’s (1997) TPB estimates and ground measured National Forest Inventory (NFI) data in Sweden through allometric relationships and statistical models. All NFI data (660) come from sampled plots over a 5-year period (1994–1998), including both temporary and permanent ones. The main
27
differences between temporary and permanent plots are that the permanent plots are revisited every 5 to 10 years. The permanent plots are also larger (10 m radius vs. 7 m) (Kepm 2000, pers. comm., University of Lund). All plots are located separately in three 0.5º cells, centered at 65.25º N and 20.25º E, 61.25º N and 15.25º E, and 57.25º N and 13.25º E. Our overall approach included (1) deriving allometric relations for conifer-dominated boreal forests using the NFI data, (2) converting the TPB (kg/ha) to annual stem increment (m3/ha), (3) estimating total and leaf litter fall production from statistical models (Lonsdale 1988), (4) mapping ANPP and TNPP at 1-km grid cell based on widely used assumptions for the relationship between BNPP and ANPP (Raich and Nadelhoffer 1989; Jenkins et al. 2001; Krankina et al. 2001; Barrett 2001; Zheng et al. 2001a), and (5) aggregating 1-km cell NPP to 0.5º grid cell. Eighty-two 0.5º NPP cells were included into the GPPDI data set. These cells met three criteria: (a) within the coniferous forest zone (i.e., south of 66º N latitude); (b) within each of the 82 cells, forest cover was >80%; and (c) evergreen needleleaf forest was >50% area of an entire 0.5º cell (Zheng et al. 2001b). Cell ID = 19000s (Diallo et al. 1991) – Diallo et al. (1991) reported that in Senegal ANPP could be reasonably estimated from seasonally integrated NDVI derived from the AVHRR. Values of r2 between annual ANPP and NDVI from 1987 to 1997 ranged from 0.52 to 0.83 (Diallo pers. comm. 2000). Homogeneous 10 x 10 km ground sites representing the major geomorphological types within the study area were selected using aerial photographs and soil maps. Measurements of ANPP standing biomass were made at the end of the growing season. A linear transect of 1 x 1 m was stratified into classes depending on vegetation type and three levels of biomass. Visual classification of each meter provided an estimate of the percentage cover of each vegetation type and its component strata in the site. Biomass measurements were made by clipping the vegetation in 1 m2 quadrats placed at random along the line and recording the fresh weight, type, and stratum. Regression models between the final calculated ANPP and NDVI for each of the 11 years were established and extrapolated to the entire country. We calculated mean ANPP over the 11-year period and aggregated 1-km estimates to 0.5º cells. Thirty-two 0.5º cells (majority class >75% of a total cell area) were incorporated into the GPPDI data set. Cell ID = 20000s–21000s (Raich et al. 1991) – A process-based model (TEM) was used for simulating potential total NPP for 5,888 non-wetland grid cells in South America at 0.5º x 0.5º resolution. Although many of the Class C data used a “model” to scale up the NPP measurements to the 0.5º cells, these NPP estimates are the farthest removed from field measurements; however, the TEM model was specifically calibrate for the South American region. However, we acknowledge that modeling approach may be too similar to many of the biogeochemical regional models and that comparisons between models and these NPP estimates may be problematic. Seven general vegetation types were defined in the study area. The model application involved two steps. The first was model calibration during which the values of rate-controlling parameters were selected so that they were consistent with site-specific data for each of the vegetation types in the region. The second step was the spatial extrapolation during which the fully parameterized model was used in conjunction with geographically referenced information on climate, soils, and vegetation to estimate carbon flux in each of the 5,888 cells. In brief, the model was specifically tuned up for representing vegetation types based on site-specific data provided in Appendix 2 of the Raich et al. (1991) paper. In the GPPDI data set, we only reported the TNPP for 1510 cells in which the dominated land cover type accounted for >90% of a cell’s total area based on Hansen et al. (2000b). Cell ID = 22000s (Jiang et al. 1999) – A database for China’s forests was assembled with biomass and NPP data from more than 1000 plots together with volume growth data from more than 5,500 permanent plots (Forestry Ministry of China 1994). Contemporary Chinese classification of forest recognized 33 distinct classes of forest (Wu 1980). The NPP calculations
28
presented used these classes for statistical analyses with each forest type represented by at least 30 to 50 plots. As a result, a polygon cover containing more than 6,500 polygons for the entire country was produced. The polygon cover was converted to grid cover at 1-km cell resolution. Furthermore, the 1-km NPP file was aggregated to 0.5º cell size using Arc/Info focal mean function. Finally, only 99 0.5º cells within which forest cover accounted for ≥90% of the cell area based on the 1-km global land cover classification system presented by Hansen et al. (2000b) and included in the GPPDI data set. 4. DATA QUALITY ASSESSMENT The overall goal for the quality assessment (QA) and outlier analysis (Sect. 5) was to ensure that the set of NPP and associated driver data where complete and consistent. Our approach was to examine patterns of the NPP associated with geography, biome types, and environmental drivers prior to distributing the model driver data for the EMDI I workshop. We looked at a variety of scatter plots and sorted data listings to detect potential inputting or process errors or unreasonable values. We discovered and corrected wrong units of measure, missing key values, wrong coordinates, duplicate entries, and processing errors. We have summarized below comparisons between site-specific data and estimates for sites extracted from global databases for elevation, climate, soils, and land cover. After the EMDI I workshop, we were able to incorporate input from the EMDI participants and to use model results in examining patterns associated with the model outputs (Sect. 5). The results of the QA and outlier checks are data sets that we have a high degree of confidence that the data are reasonable, consistent, and as complete as possible. Elevation – Most of the Class A sites have an associated elevation (112 records or 74%) as described in the original literature, and the remainder were estimated using the DEM. For those sites with and elevation, there was a fairly good correspondence between given and estimated elevation (r2 = 0.79), with an even grouping around a 1:1 line of fit. There were 817 Class B sites that have an associated measured elevation, ELEV_GIV (about 50% of the total number of sites) (Fig. 4). There were a few outliers that the difference between ELEV_GIV and ELEV_DEM exceeded 1000 m. Regression analysis demonstrated the data were reasonable good (r2 = 0.75). The site-specific elevation derived from literature was used for the final ELEV variable, with the elevation values derived from the DEM used to fill in the “gaps” of data. Both the mean and standard deviation of ELEV_DEM are available for Class C cells, based upon the global elevation data. Soils – Twenty-seven of the Class A sites had site-specific soils data, such as estimates of soil texture or a soil type name, as compiled by Jonathan Scurlock through the ORNL NPP project. The site-specific soil texture data were compared with that extracted from the IGBP soils database. Scatter plots of sand, silt, and clay showed very weak correlations between the sitespecific and globally interpolated data; r2 2000 gC/m2/y, BNPP_C >2000, TNPP_C >3000
35
ELEV >2500 m (high-elevation sites were expected to comprise unrepresentative sub-biomes or present problems with the climate extrapolation algorithm) ANPP >0.95 TNPP, BNPP >0.95 TNPP (for a site with both above and below ground components) 2. Flags based on NPP values outside of the 0.05 to 0.95 percentiles for each biome calculated assuming a normal distribution of variables: ANPP, BNPP, TNPP 3. Flags based on climate values outside of the 0.01 to 0.99 percentiles for each biome calculated assuming a normal distribution of variables. In addition, we set some specific limits for some biomes: Annual temperature and total annual precipitation Temp >6 C for boreal forests Precip >1000 mm for desert and tundra Precip 2500 m or 2500, elev 1* 10 ANPP_P5F anpp outsite 0.05–0.95 percentile by biome2 1 BNPP_P5F bnpp outsite 0.05–0.95 percentile by biome2 1 TNPP_P5F tnpp outsite 0.05–0.95 percentile by biome2 1 ANPPBADF anpp >2000 gC/m2, anpp >95%tnpp 1 BNPPBADF bnpp >2000 gC/m2, bnpp >95%tnpp 1 TNPPBADF tnpp >3000 gC/m2, anppbadf or bnppbadf 1 AET_RGF NPP outside 0.95 CI of NPP=a+b*AET regression 1 PREC_RGF NPP outside 0.95 CI of NPP=a+b*PREC regression 1 TAVE_RGF NPP outside 0.95 CI of NPP=a+b*TAVE regression 1 PRECBADF prec outsite 0.01–0.99 percentile by biome2 (or >1000 millimeters 1 in desert) TAVEBADF temp outsite 0.01–0.99 percentile by biome2 (>6 in boreal forests) 1
37
Table 11. Class A sites identified as outliers by participants in the EMDI I workshop No. Latitude Longitude BIOME2 Site name, country Comments 1 -20.27 148.12 Grassland Bowen Pertusa, Relatively warm/wet, but Queensland, low NPP Australia 2 -1.33 36.83 Grassland Nairobi, Kenya Low NPP reported in data synthesis - may actually be higher 3 6.33 100.93 Grassland Hat Yai, Thailand Low NPP reported in data synthesis - may actually be higher 4 18.00 -66.92 DBL Guanica, Puerto Low NPP reported in data forest / Rico synthesis tropical 5 18.08 -76.65 EBL John Crow Ridge Low NPP reported in data forest / (Wet Slope), synthesis tropical Jamaica 6 18.27 -65.77 EBL Luquillo (Pico del Low NPP, high precipitation forest / Este), Puerto Rico (but relatively high tropical elevation) Very high NPP (previously 7 29.97 76.80 grassland Kurukshetra, India fertilized?) Summary of outlier analysis of Class A sites – Outlier analysis of Class A sites resulted in the following. • • • • • •
Assigned consistent biome class to Class A sites (162 records, 87 sites). Calculated new NPP ensemble values (11 models). Calculated new AET ensemble values (5 models). Performed outlier analysis on NPP and driver data (11 different outlier tests). Identified a set of 11 of the 162 sites to be excluded, including: One or more critical flags: All 11 flagged related to differences with NPP ensemble (bias, NE, MAE). Calculated mean driver data and NPP for 81 unique sites from the 151 NPP records.
5.3 CLASS B POINT DATA The value of the overall flag was calculated as the sum of the individual flags as defined in Table 12. Sites with a sum greater than 5 (all those with at least one major flag or a managed site) were considered potential for excluding. A total of 134 of the 2363 records (6% of the total) were dropped because they are managed sites. A total of 353 appeared to be outliers. Virtually all the sites identified at the EMDI I Workshop as outliers were included in this set. The process resulted in a total of 1689 records for 933 sites. We plotted NPP observed against the modeled NPP ensemble by AET ensemble and by latitude with the plot symbols indicating the magnitude of the flags. In general, the points that had high flag values appeared to be on the fringe of the cluster of points, re-enforcing their outlier status.
38
Table 12. Flags’ names, descriptions, and weights used for Class B records Flag name Description Weight MIXED_F Mixed biome, measurement biome not = to biomenew 100 BIOME_F crops, pasture, plantations, wetlands** 100 ELEV_MXF elev >2500, elev 1* 10 TAVE_F (tave – temp_ann) / ave(tave) >1* 10 MOD_F (npp_est – modcb_av) / ave(npp) >1* 10 EMDI_F Identified at EMDI as an outlier by visual inspection 10 ANPP_P5F anpp outsite 0.05–0.95 percentile by biome2 1 BNPP_P5F bnpp outsite 0.05–0.95 percentile by biome2 1 TNPP_P5F tnpp outsite 0.05–0.95 percentile by biome2 1 NPP_P5F npp outsite 0.05–0.95 percentile by biome2 1 ANPPBADF anpp >2000 gC/m2, anpp >95%tnpp 1 BNPPBADF bnpp >2000 gC/m2, bnpp >95%tnpp 1 TNPPBADF tnpp >3000 gC/m2, anppbadf or bnppbadf 1 AET_RGF NPP outside 0.95 CI of NPP=a+b*AET regression 1 PREC_RGF NPP outside 0.95 CI of NPP=a+b*PREC regression 1 TAVE_RGF NPP outside 0.95 CI of NPP=a+b*TAVE regression 1 ELEV_F (elev_giv - elev_dem) / ave(elev) > 1 1 PRECBADF prec outsite 0.01–0.99 percentile by biome2 (or >1000 millimeters 1 in desert) TAVEBADF temp outsite 0.01–0.99 percentile by biome2 (>6 in boreal forests) 1 Summary of outlier analysis of Class B sites – Outlier analysis of Class B sites resulted in the following. • • • • • •
• • •
•
Assigned consistent biome class to Class B sites (2363 records, 1271 sites). Calculated new NPP ensemble values (8 models). Calculated new AET ensemble values (4 models). Assigned unique IDs including MEAS_NUM for all NPP measurements (1–2363) and SITE_NUM for all unique sites by lat/long (1–1605). Rounded all lat/long coordinates to two decimal places (85 of the 1690 became non-unique). Reviewed biome type and flags for multiple measurements for multiple biomes at a site [399 records; dropped 187 because biome for a measurement was inconsistent with biomenew assigned to the site with multiple measurements (e.g., a site with several NPP measurements was assigned biomenew = ‘Grassland C3,’ but one of the measurements was for a “Crop” which was flagged)]. Excluded 134 as managed sites (crops, pasture, plantation, and wetlands). Performed outlier analysis on NPP and driver data (see Table 12). Identified a set of 353 sites to be excluded, including: One or more critical flags: 164 flagged related to differences with NPP ensemble (bias, NE, MAE) 125 flagged related to high elevation (>2500 m) 35 flagged related to big differences between site and global precipitation 35 flagged related to big differences between site and global temperature Five or more less critical flags: Outside of 0.05 to 0.95 percentile by biome Outside of 0.95 CI determined by regressions with AET, PREC, TAVE. Calculated mean driver data and NPP for 933 unique sites from the 1689 measurements.
39
5.4 CLASS C GRID CELLS We used the statistical-empirical approach for the expanded Class C cells as we did for Class A and Class B, with a few minor changes. The modifications to Class C outlier analysis consisted of the following. • •
The previous model ensemble average was replaced by the Miami model for analysis of outliers where regression analysis between total NPP and the Miami model was performed. Points beyond the 95% Confidence Interval were flagged. To be consistent with various model requirements, the crops and bare ground biomes were flagged.
Each flag was assigned a weight of 1 except the critical flags which were assigned a weight of 100 (Table 13). The overall flags’ value was calculated as the sum of the individual flags. Sites with a sum greater than 5 were dropped. The 4848 (=5164 - 316) records that had a flag sum2500, elev 2000 gC/m2, anpp 95%totnpp 1 2 TNPPBADF tnpp >3000 gC/m , tnpp 5000 1 millimeters) TAVEBADF 1 anu_avgt outside 0.01–0.99 percentile by biome2 (or >30.0°C) TEMPFLAG totnpp outside 0.95 CI of totnpp=a+b*PREC regression 1 PRECFLAG totnpp outside 95 CI totnpp=a+b*TAVE regression 1 NPPFLAG totnpp outside 95 CI totnpp=a+b*MNPP_C regression 1 MOD_F (totnpp – mnpp_c) / ave(npp) >1 1 Summary of outlier analysis of Class C cells – Outlier analysis of Class C sites resulted in the following: • • • • •
5164 records (3980 sites) received data for Class C cells from Steve Prince and Daolan Zheng (University of Maryland) 1830 records for 1788 sites have missing ANPP (Prince, Raich, Tieszen, Jiang) 36 sites were lacking total NPP but had ANPP (mostly from CSE/Diallo) 33 records (17 sites) had two different biome classifications for same cell (lat/long are the same) (Brown and Parton data) 316 records had flag sums >5 based on outlier analysis on NPP and driver data
One or more critical flags (flag sum>100), 292 records: • 227 flagged related to managed sites or not applicable (e.g., crops, bare ground) • 39 flagged related to high elevation (>2500 or 5 and 2500, elev 1* *(prec-prec_ann)/ave(prec)>1 *(tave-temp_ann)/ave(tave)>1 Outliers determined at EMDI Workshop in December 1999 ANPP outside .05–.95 percentile by biome2 ANPP outside .05–.95 percentile by biome2 TNPP outside .05–.95 percentile by biome2 NPP_EST outside .05–.95 percentile by biome2 anpp >2000 gC/m2, anpp >95%tnpp bnpp >2000 gC/m2, bnpp >95%tnpp tnpp >3000 gC/m2, anppbadf or bnppbadf NPP outside .95 CI of NPP=a+b*AET regression NPP outside .95 CI of NPP=a+b*PREC regression NPP outside .95 CI of NPP=a+b*TAVE regression (elev_giv – elev_dem) / ave(elev) > 1 Prec outside .01-.99 percentile by biome2 (or >1000 millimeters in desert) Temp outside .01-.99 percentile by biome2 (>6 in boreal forests) Average ensemble value from up to 11 EMDI models Average ensemble value for Actual Evapotranspiration from up to 5 EMDI models Normalized error between modeled and measured values Bias between modeled and measured values Mean actual error between modeled and measured values Normalized error between gridded and site elevation values Normalized error between values gridded and site precipitation values Normalized error between gridded and site temperature values Sum of all the flag values Count of all the flag values
Table D.16. Model validation mean NPP information derived from site-specific data that passed outlier analysis Units Description Source Class MEANS_xxx.csv A B N/A Site ID number (1-149) based on Assigned 81 933 lat/long Decimal degrees Latitude xx.xx, southern latitudes are As given 81 933 negative Decimal degrees Longitude xxx.xx, western As given 81 933 longitudes are negative Meters Elevation for site As given or, if not 54 933 given, from DEM N/A Number of elevation measurements Calculated 54 933 for this site
82
C 1637 1637 1637 1637 1637
Variable
Units
SOURCE
N/A
BIOMENEW
N/A
BIOME2
N/A
BIOME
N/A
TAVE
ºC
TAVE_N
N/A
PREC
Millimeters
PREC_N
N/A
ANPP_C
gC/m2/y
ANPP_N
N/A
BNPP_C
gC/m2/y
BNPP_N
N/A
TNPP_C
gC/m2/y
TNPP_N
N/A
NPP_EST
gC/m2/y
NPP_N
N/A
MODCX_AV
gC/m2/y
MOD_N
N/A
AETCX_AV
Millimeters/y
AET_N
N/A
FLAGS FLAG_N TAVE_MAX PREC_MAX ELEV_MAX ANPP_MAX
N/A N/A ºC Millimeters Meters gC/m2/y
BNPP_MAX
gC/m2/y
TNPP_MAX
gC/m2/y
NPP_MAX
gC/m2/y
MOD_MAX AET_MAX FLAG_MAX
gC/m2/y Millimeters/y N/A
TAVE_MIN PREC_MIN ELEV_MIN
ºC Millimeters Meters
Table D.16 (continued) Description MEANS_xxx.csv Source of the NPP data name or code Biome type, standardized to 21 EMDI classes Biome type, consolidated into 14 EMDI classes Biome type, consolidated into 4 EMDI classes Annual average temperature Number of temperature readings for this site Annual total precipitation Number of precipitation values for this site Aboveground NPP – mean of several published estimates Number of published ANPP measurements for this site Below ground NPP – mean of several published estimates Number of published BNPP measurements for this site Total NPP - mean of several published estimates Number of published TNPP measurements for this site Total NPP, estimated from ANPP or BNPP if no TNPP Number of NPP_EST estimates for this site Average ensemble value from up to 11 EMDI models Number of NPP of models for this site Average ensemble value for Actual Evapotranspiration from up to 5 EMDI models Number of models providing AET for this site Sum of all the flag values Number of all the flag values Maximum temperature for this site Maximum precipitation for this site Maximum elevation for this site Aboveground NPP – maximum of several published estimates Below ground NPP – maximum of several published estimates Total NPP – maximum of several published estimates NPP_EST – maximum of several estimates from ANPP or BNPP if no TNPP Maximum model output of NPP Maximum model output of AET Maximum number of flags associated with a site Minimum temperature for this site Minimum precipitation for this site Minimum elevation for this site
83
Source A 81
Class B 933
C 1637
81
933
X
81
X
X
X
X
1637
Extracted from global gridded climate Calculated
67
933
1637
67
933
1637
Extracted from global gridded climate Calculated
72
933
1637
72
933
1637
Calculated
81
465
1461
Calculated
81
465
1461
Calculated
72
192
X
Calculated
72
192
X
Calculated
81
671
1636
Calculated
81
671
1636
Calculated
X
933
X
Calculated
X
933
X
Calculated
81
933
1637
Calculated
81
933
1637
Calculated
81
932
1633
Calculated
81
932
1633
Calculated Calculated Calculated Calculated Calculated Calculated
81 81 67 72 54 81
933 933 933 933 933 465
1637 1637 1637 1637 1637 1461
Calculated
72
192
X
Calculated
81
671
1636
Calculated
X
933
X
Calculated Calculated Calculated
81 81 81
933 932 933
1637 1637
Calculated Calculated Calculated
67 72 54
933 933 933
1637 1637 1637
As assigned Based on Biome, Species, Veg_type Based on BIOMENEW, As given
Variable
Units
ANPP_MIN
gC/m2/y
BNPP_MIN
gC/m2/y
TNPP_MIN
gC/m2/y
NPP_MIN
gC/m2/y
MOD_MIN
gC/m2/y
AET_MIN
Millimeters/y
FLAG_MIN
N/A
Variable SITE_ID LAT_DD LONG_DD ELEV_GIV ELEV_DEM ELEV_G_N ELEV_D_N SITE_OLD SOURCE COUNTRY BIOMENEW SUBBIOME VEG_TYPE SPECIES SUBBIOME REFERENC YEAR_REF
Table D.16 (continued) Description MEANS_xxx.csv Aboveground NPP – minimum of several published estimates Below ground NPP – minimum of several published estimates Total NPP – minimum of several published estimates NPP_EST – minimum of several estimates from ANPP or BNPP if no TNPP Minimum NPP model output of this site Minimum AET model output of this site Minimum number of flags associated with a site
Source Calculated
A 81
Class B 465
C 1461
Calculated
72
192
X
Calculated
81
671
1636
Calculated
X
933
X
Calculated
81
933
1637
Calculated
81
932
1633
Calculated
81
933
1637
A X X X
Class B 933 933 933
C X X X
X X
468 200
X X
X X X X X X
468 200 706 933 933 933
X X X X X X
X X X X X X
933 688 704 582 933 202
X X X X X X
Table D.17. Model validation driver information derived from a variety of sources Units Description Source DRIVER_xxx.csv N/A Site ID number based on lat/long Assigned Decimal degrees Latitude xx.xx, southern latitudes are negative As given Decimal degrees Longitude xxx.xx, western longitudes are As given negative Meters Elevation for site As given Meters Elevation extracted from a global DEM Global DEM (1 km resolution) N/A Number of elevation measurements for this site Calculated N/A Number of elevation measurements for this site Calculated N/A Site identifier As given N/A Source of the NPP data name or code As assigned N/A Country name As given N/A Biome type, standardized to EMDI classes Based on Biome, Species, Veg_type N/A Sub Biome, e.g., conifer, decid. As given N/A Vegetation type as given, somewhat standardized As given N/A Dominant species As given N/A Sub Biome, e.g., conifer, decid. As given N/A Reference As given N/A Year of reference As given
84
ORNL/TM-2001/196 INTERNAL DISTRIBUTION 1. 2. 3. 4. 5. 6. 7. 8. 9. 10.
J. S. Amthor R. B. Cook D. E. Fowler P. J. Hanson W. F. Harris S. G. Hildebrand M. A. Huston G. K. Jacobs A. W. King G. Marland
11-20. 21. 22-31. 32. 33. 34. 35-37. 38. 39.
R. J. Olson W. M. Post J. M. O. Scurlock L. D. Voorhees S. Wullschleger Central Research Library ESD Library Laboratory Records Department Laboratory Records, ORNL-RC
EXTERNAL DISTRIBUTION 40.
Michael Apps, Department of Natural Resources, Canadian Forest Service, 5320 122nd Street, Edmonton, Alberta, T6H 3S5, Canada
41.
Dominique Bachelet, Department of Bioresource Engineering, Oregon State University, 2905 Hampton Drive SW, Tumwater, WA 98512
42.
Dennis Baldocchi, Ecosystem Science Division and Berkeley Atmospheric Science Center, Department of Environmental Science, Policy, and Management, 151 Hilgard Hall, University of California, Berkeley, Berkeley, CA 94720
43.
Richard Birdsey, Northern Global Change Research Program, USDA Forest Service, Newtown Square Corporate Campus, 11 Campus Boulevard, Suite 200, Newtown Square, PA 19073
44.
Victor Brovkin, Climate Systems Research Department, Potsdam Institute for Climate Impact Research, P.O. Box 601203, 14412 Potsdam, Germany
45.
Sandra Brown, Winrock International, 1621 N Kent Street, Suite 1200, Arlington, VA 22209
46.
Ingrid C. Burke, Department of Forest Sciences, 206 Natural Resources, Colorado State University, Fort Collins, CO 80523
47.
Josep Canadell, GCTE International Project Office, CSIRO Sustainable Ecosystems, P.O. Box 284, Canberra, ACT, 2601, Australia
48.
Josef Cihlar, Canada Centre for Remote Sensing, Energy Mines & Resources Canada, 588 Booth Street, 4th Floor, Ottawa, Canada K1A 0Y7
49.
Deborah Clark, Department of Biology, University of Missouri, St. Louis, INTERLINK-341, P.O. Box 02-5635, Miami, FL 33152
50.
Warren Cohen, Forestry Sciences Laboratory, United States Forest Service, 3200 SW Jefferson Way, Corvallis, OR 97332
51.
Michael Coughenour, Natural Resources Ecology Laboratory, Colorado State University, Fort Collins, CO 80523
52.
Wolfgang Cramer, Potsdam Institute for Climate Impact Research, P.O. Box 601203, Telegrafenberg, D-14412, Potsdam, Germany
53.
Roger C. Dahlman, U.S. Department of Energy, SC-74, 19901 Germantown Road, Germantown, MD 20874-1290
54.
Ken Day, Department of Natural Resources, Climate Impacts and Grazing Systems, 80 Meiers Road, Indooroopilly, Brisbane, Queensland, 4086, Australia
55.
Ruth S. DeFries, Department of Geography, Room 1127, Le Frak Hall, University of Maryland, College Park, MD 20742-8225
56.
Jerry Elwood, Acting Director, Environmental Sciences Division, ER-74, Department of Energy, 19901 Germantown Road, Germantown, MD 20874
57.
Gerd Esser, Institute for Plant Ecology, Justus-Liebig-University, Heinrich-Buff-Ring 38, D35292 Giessen, Germany
58.
Christopher Field, Carnegie Institution of Washington, 290 Panama Street, Stanford, CA 94305
59.
Jonathan A. Foley, Climate, People, and Environment Program, Institute for Environmental Studies, University of Wisconsin, 1225 West Dayton Street, Madison, WI 53706
60.
Tagir Gilmanov, Department of Biology/Microbiology, AgH 310, Box 2207B, South Dakota State University, Brookings, SD 57007-2142
61.
Scott Goetz, Department of Geography, University of Maryland, College Park, MD 20742-8225
62.
James Gosz, Department of Biology, University of New Mexico, Albuquerque, NM 87131-1091
63.
Stith T. Gower, Forest Ecosystem Ecology Program, Department of Forestry, 1630 Linden Drive, University of Wisconsin, Madison, WI 53706
64.
Kathy Hibbard, Climate Change Research Center, Institute for the Study of Earth, Oceans, and Space, University of New Hampshire, Morse Hall, 39 College Road, Durham, NH 03824-3525
65.
Elisabeth Holland, Atmospheric Chemistry Division, National Center for Atmospheric Research, 1850 Table Mesa Drive, P.O. Box 3000, Boulder, CO 80307-3000
66.
Robert B. Jackson, Department of Biology and Nicholas School of the Environment, Box 90340, Phytotron Building, Duke University, Durham, NC 27708
67.
Jennifer Jenkins, Research Forester, USDA Forest Service, Northern Global Change Program, 5 Radnor Corporate Center, Suite 200, 100 Matsonford Road, Radnor, PA 19087
68.
Jinjun Ji, Institute of Atmospheric Physics, Chinese Academy of Sciences, Beijing, 100029, China
69.
Keri Johnson, 19 Clark Place, Oak Ridge, TN 37830
70.
Chris Justice, University of Virginia, Department of Environmental Sciences, Science Clark Hall, Charlottesville, VA 22903
71.
Joerg Kaduk, Department of Geography, University of Leicester, Leicester LE1 7RH, England, UK
72.
David Kicklighter, The Ecosystems Center, Marine Biological Laboratory, 7 MBL Street, Woods Hole, MA 02543
73.
Timothy G. F. Kittel, National Center for Atmospheric Research, P.O. Box 3000, Boulder, CO 80307
74.
Steven Klooster, Ecosystem Science and Technology Branch, NASA Ames Research Center, Mail Stop 242-4, Moffett Field, CA 94035
75.
Alan K. Knapp, Division of Biology, Kansas State University, Manhattan, KS 66506
76.
Olga Krankina, Department of Forest Science, Oregon State University, Corvallis, OR 97330
77.
Chris Kucharik, Department of Soil Science, University of Wisconsin-Madison, 1525 Observatory Drive, Madison, WI 53706
78.
William Lauenroth, Department of Range Science, NREL, Colorado State University, Fort Collins, CO 80523
79.
Beverly E. Law, 328 Richardson Hall, College of Forestry, Oregon State University, Corvallis, OR 97331
80.
Yingpeng Li, Institute of Atmospheric Physics, Chinese Academy of Sciences, Chaoyang District, Beijing, 100029, China
81.
Sune Linder, Department of Ecology and Environmental Research, Swedish University of Agricultural Sciences, P.O. Box 7072, S-75007 Uppsala, Sweden
82.
Ross McMurtrie, School of Biological Science, University of New South Wales, BioScience Building, Sydney, 2052 Australia
83.
Berrien Moore III, Morse Hall, Institute for the Study of Earth, Oceans, and Space, University of New Hampshire, Durham, NH 03824
84.
Jeff Morisette, NASA GSFC, University of Maryland, Code 923, Greenbelt, MD 20771
85.
Jian Ni, Max Planck Institute for Biogeochemistry, Carl Zeiss Promenade 10, P.O. Box 10 01 64, D-07701, Jena, Germany
86.
Office of Assistant Manager for Energy Research and Development, Department of Energy, Oak Ridge Operations, P.O. Box 2001, Oak Ridge, TN 37831-8600
87.
Office of Scientific and Technical Information, P.O. Box 62, Oak Ridge, TN 37831
88.
Dennis Ojima, Natural Resource Ecology Laboratory, Colorado State University, Fort Collins, CO 80523
89.
Jerry S. Olson, 508 Eblen Cave Road, Lenoir City, TN 37771
90.
William Parton, Natural Resource Ecology Laboratory, Colorado State University, Fort Collins, CO 80523
91-100. Stephen D. Prince, Department of Geography, LeFrak Hall, University of Maryland, College Park, MD 20742-8225 101.
Jeffrey L. Privette, NASA Biospheric Sciences, Code 923, Goddard Space Flight Center, Greenbelt, MD 20771
102.
James Reichman, National Center for Ecological Analysis and Synthesis, 735 State Street, Suite 300, Santa Barbara, CA 93101-3351
103.
Steve Running, School of Forestry, University of Montana, Missoula, MT 59812
104.
H. Jochen Schenk, Department of Biology, Box 90338, Duke University, Durham, NC 27708
105.
David Schimel, Ecosystem Dynamics and the Atmosphere, Climate and Global Dynamics Division, National Center for Atmospheric Research, Boulder, CO 80307
106.
Robert Scholes, CSIR, P.O. Box 395, Pretoria 0001, South Africa
107.
Hank Shugart, Department of Environmental Science, University of Virginia, Charlottesville, VA 22903
108.
Will Steffen, IGBP Secretariat, Royal Swedish Academy of Sciences, Box 50005, S-104 05 Stockholm, Sweden
109.
Philippe M. Teillet, Canada Centre for Remote Sensing, 588 Booth Street, Ottawa, Ontario, K1A 0Y7, Canada
110.
Peter Thornton, Climate and Global Dynamics Division, National Center for Atmospheric Research, 1850 Table Mesa Drive, P.O. Box 3000, Boulder, CO 80307-3000
111.
Larry Tieszen, EROS Data Center, US Geological Survey, Sioux Falls, SD 57198
112.
David P. Turner, Forest Science Department, Oregon State University, Corvallis, OR 97331
113.
John Vande Castle, University of New Mexico, 801 University Boulevard SE, Suite 104, Albuquerque, NM 87106
114.
Charles Vorosmarty, Complex System Research Center, University of New Hampshire, Durham, NH 03824
115.
Diane E. Wickland, Manager, Terrestrial Ecology Program, NASA Code YS, 300 E Street, SW, Washington, DC 20546
116.
Curtis Woodcock, Department of Geography, Boston University, 675 Commonwealth Avenue, Boston, MA 02215
117.
Xinshi Zhang, Institute of Botany, Chinese Academy of Sciences, 20 Nanxincun XiangShan, Beijing, 100093, PR China
118.
Daolan Zheng, Research Associate, Department of Geography, University of Maryland, College Park, MD 20742