nutrients Article
Glutamine Modulates Macrophage Lipotoxicity Li He 1,2 , Kassandra J. Weber 1,2 and Joel D. Schilling 1,2,3, * 1 2 3
*
Diabetic Cardiovascular Disease Center, Washington University School of Medicine, St. Louis, MO 63110, USA;
[email protected] (L.H.);
[email protected] (K.J.W.) Department of Medicine, Washington University School of Medicine, St. Louis, MO 63110, USA Department of Pathology and Immunology, Washington University School of Medicine, St. Louis, MO 63110, USA Correspondence:
[email protected]; Tel.: +1-314-747-8499
Received: 17 February 2016; Accepted: 6 April 2016; Published: 12 April 2016
Abstract: Obesity and diabetes are associated with excessive inflammation and impaired wound healing. Increasing evidence suggests that macrophage dysfunction is responsible for these inflammatory defects. In the setting of excess nutrients, particularly dietary saturated fatty acids (SFAs), activated macrophages develop lysosome dysfunction, which triggers activation of the NLRP3 inflammasome and cell death. The molecular pathways that connect lipid stress to lysosome pathology are not well understood, but may represent a viable target for therapy. Glutamine uptake is increased in activated macrophages leading us to hypothesize that in the context of excess lipids glutamine metabolism could overwhelm the mitochondria and promote the accumulation of toxic metabolites. To investigate this question we assessed macrophage lipotoxicity in the absence of glutamine using LPS-activated peritoneal macrophages exposed to the SFA palmitate. We found that glutamine deficiency reduced lipid induced lysosome dysfunction, inflammasome activation, and cell death. Under glutamine deficient conditions mTOR activation was decreased and autophagy was enhanced; however, autophagy was dispensable for the rescue phenotype. Rather, glutamine deficiency prevented the suppressive effect of the SFA palmitate on mitochondrial respiration and this phenotype was associated with protection from macrophage cell death. Together, these findings reveal that crosstalk between activation-induced metabolic reprogramming and the nutrient microenvironment can dramatically alter macrophage responses to inflammatory stimuli. Keywords: lysosome; cell death; metabolism; inflammasome
1. Introduction Diabetes and obesity are common metabolic disorders that are associated with macrophage dysfunction. Moreover, pathologic inflammation driven by macrophages is recognized as a contributing factor to the impaired tissue repair responses observed in obese and diabetic patients [1–4]. Therefore, understanding the mechanisms by which the nutrient microenvironment alters macrophage inflammatory responses is highly relevant to human disease. Individuals with obesity and diabetes have excess circulating triglycerides and free fatty acids (FFAs) leading to ectopic lipid deposition in non-adipose tissues including macrophages [5,6]. Toll-like receptor 4 (TLR4) is an inflammatory receptor expressed at high levels on macrophages, which is activated in response to bacterial infection and/or sterile tissue damage [7,8]. Recently, we demonstrated that activation of macrophage TLR4 in a lipid rich environment triggers lysosome damage, which contributes to NLRP3 inflammasome activation and macrophage cell death [9–11]. However, the molecular pathways that precede lysosome pathology are not well understood. Macrophage activation leads to dramatic reprogramming of cellular metabolism to facilitate ATP generation and the production of macromolecules such as proteins, nucleotides, and lipids [12].
Nutrients 2016, 8, 215; doi:10.3390/nu8040215
www.mdpi.com/journal/nutrients
Nutrients 2016, 8, 215
2 of 14
Activation of TLR4 on macrophages triggers an increase in glycolysis with variable effects on fatty acid oxidation (FAO) [13,14]. Glutamine uptake and metabolism is also enhanced in response to TLR4 activation [15]. Although metabolic reprogramming is important for macrophage activation, it remains unclear how changes in the nutrient microenvironment interface with these changes in cellular metabolism to influence cell phenotype. This is particularly relevant in situations of nutrient excess where mitochondria can be presented with energetic substrates in excess of what is needed for ATP generation. In this context, oversupply of substrates and reducing equivalents to the mitochondria has the potential to lead to accumulation of metabolites and reactive oxygen species [16]. Glutamine is a non-essential amino acid that is consumed by growing or activated cells. Following uptake, glutamine can be broken down to produce glutamate and α-ketoglutarate (α-KG), the latter of which enters into the TCA cycle. In addition to feeding energetic pathways glutamine also facilitates the uptake of other amino acids, such as leucine via SLC7A5, and promotes activation of growth kinases such as mTOR [17,18]. In line with these observations, when glutamine concentrations are low, mTOR activation is suppressed, and catabolic processes such as autophagy are enhanced [19]. Therefore, glutamine and its metabolites significantly alter cell stress responses, making this a relevant nutrient to consider in the context of lipid-induced macrophage dysfunction. To date, the role of glutamine in macrophage responses to excess FAs has not been explored. In light of previous data that TLR4 activation in primary macrophages triggers enhanced glucose and glutamine metabolism in macrophages we hypothesized that excess SFA could lead to metabolic gridlock from nutrient overload. This scenario would be expected to result in the accumulation of toxic metabolites that could mediate lysosome damage. Based on prior evidence that lipid-induced cell death is independent of glucose concentration we focused our analysis on how glutamine influences macrophage lipotoxicity [9]. In the absence of glutamine, macrophage cell death and inflammasome activation in response to excess dietary SFAs was attenuated. We provide evidence that glutamine deficiency attenuates the toxic effects of lipid overload likely through its impact on mitochondrial metabolism. 2. Experimental Section 2.1. Reagents Bafilomycin A was from Enzo life sciences (Farmingdale, NY, USA). The α-tubulin antibody, α-actin antibody, α-ketoglutarate, and BPTES were from Sigma Chemical (St. Louis, MO, USA). C968 was from Millipore-EMD-Calbiochem (Bellerica, MA, USA). Phospho- and total S6Kinase and AKT S473 antibodies were from Cell Signaling (Danvers, MA, USA). L-glutamine was from Corning (Manassas, VA, USA). The α-LC3 antibody was from Novus Biologicals (NB100-2220; Littleton, CO, USA). The α-p62 antibody was from Abcam (ab56416; Cambridge, MA USA). Lysotracker red was from Life Technologies (Carlsbad, CA, USA). Ultrapure E. coli LPS was from Invivogen (San Diego, CA, USA). Thioglycollate was from Difco-BD (Franklin Lakes, NJ, USA). Fatty acids were from Nu-Chek Prep (Waterville, MN, USA). Ultrapure-bovine serum albumin (BSA) was from Lampire (Ottsville, PA, USA) and was tested for TLR ligand contamination prior to use by treating primary macrophages and assaying for TNFα release. 2.2. Cell Culture Peritoneal macrophages were isolated from C57BL/6, or the indicated knockout mice 4 days after intraperitoneal injection of 1 mL, 3.85% thioglycollate and plated at a density of 1 ˆ 106 cells/mL in DMEM containing 10% inactivated fetal serum (IFS), 50 U/mL penicillin G sodium, and 50U/mL streptomycin sulfate (pen-strep). For glutamine free experiments media was prepared with dialyzed serum (Gibco-ThermoFisher, Waltham, MA, USA) to remove all sources of glutamine. Stimulations were performed on the day after harvest. For flow cytometry experiments, peritoneal cells were cultured on low adherence plates (Greiner Bio-One) to facilitate cell harvest. Cells were removed from
Nutrients 2016, 8, 215
3 of 14
low adherence plates by washing with PBS followed by 10 min with Cell Stripper (Gibco) and then 10 min with EDTA/trypsin (Sigma). Growth medium was supplemented with palmitate or stearate complexed to BSA at a 2:1 molar ratio, as described previously [9], and BSA-supplemented media was used as control. For cell stimulations, PBS or LPS (100 ng/mL) were added to BSA or free fatty acid containing media. 2.3. Mice Wild type (WT) C57BL/6 mice were bred in our mouse facility; ATG5flox X LysM-Cre, were from Skip Virgin (Washington University). All lines were in the C57BL/6 background. Mice were maintained in a pathogen free facility on a standard chow diet ad libitum (6% fat). All animal experiments were conducted in strict accordance with NIH guidelines for humane treatment of animals and were reviewed by the Animal Studies Committee of Washington University School of Medicine. 2.4. RNA Isolation and Quantitative RT-PCR Total cellular RNA was isolated using Qiagen RNeasy columns and reverse transcribed using a high capacity cDNA reverse transcription kit (Applied Biosystems, Thermo-Fisher Scientific, Waltham, MA, USA). Real-time qRT-PCR was performed using SYBR green reagent (Applied Biosystems) on an ABI 7500 fast thermocycler. Relative gene expression was determined using the delta-delta CT method normalized to 36B4 expression. Mouse primers sequences were as follows (all 51 -31 ): 36B4 (forward- ATC CCT GAC GCA CCG CCG TGA, reverse-TGC ATC TGC TTG GAG CCC ACG TT); LC3 (forward-CGT CCT GGA CAA GAC CAA GT, reverse-ATT GCT GTC CCG AAT GTC TC); p62 (forward-GCT GCC CTA TAC CCA CAT CT, reverse-CGC CTT CAT CCG AGA AAC). 2.5. Western Blotting Total cellular protein was isolated by lysing cells in 150 mM NaCl, 10 mM Tris (pH 8), triton X-100 1% and 1X Protease Complete and phosphatase inhibitors (Thermo-Fisher Scientific). Subsequently, 25 µg of protein from each sample was separated on a TGX gradient gel (4%–20%; Biorad) and transferred to a nitrocellulose membrane. For blots of Phospho-S6, S6K, and AKT transfer was for 1 h on ice. For LC3 blots, proteins were transferred overnight in the cold room at 140 mAmp constant current. 2.6. Lysosome Imaging After the indicated stimulations, cells were stained with 500 nM lysotracker red in tissue culture media for 15 min at 37 ˝ C. After staining, cells were washed three times with PBS, harvested as described above, and analyzed by flow cytometry. 2.7. Metabolism Assays Cells were plated into 96 well Seahorse plates at density of 75,000 cells/well and stimulated as indicated in the text. After stimulation the cells were washed and placed in XF media (non-buffered RPMI 1640 containing, 25 mM glucose, 2 mM L-glutamine and 1 mM sodium pyruvate) with 10% FCS. Oxygen consumption rates (OCR) and extracellular acidification rates (ECAR) were measured under basal conditions and following the addition the following drugs: 1.5 µM flurorcarbonyl cynade phenylhydrazon (FCCP), and 100 nM rotenone + 1 µM antimycin A (all Sigma). Measurements were taken using a 96 well Extracellular Flux Analyzer (Seahorse Bioscience; North Bellerica, MA, USA). 2.8. Ammonia Quantification After stimulation, supernatants were collected from 0.5 ˆ 106 pMACs macrophages grown in a 24 well plate. The ammonia concentration was determined using an ammonia assay kit (BioVision, Milpitas, CA, USA) as per the manufacturer’s instructions.
Two million pMACs were grown in 6 well plates. After stimulation the cells were washed 3 times with PBS and then were snap frozen and scraped in liquid nitrogen. Intracellular metabolites were quantified by LC‐MS/MS at Sanford Burnham Metabolomics Core, Medical Discovery Institute (Lake Nona, FL, USA).
Nutrients 2016, 8, 215
4 of 14
3. Results
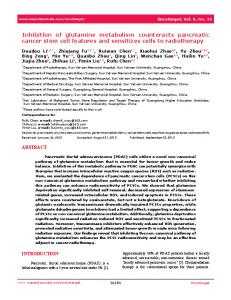
2.9. Intracellular Glutamine Quantification 3.1. Glutamine Deficiency Attenuates Macrophage Lipotoxic Responses Two million pMACs were grown in 6 well plates. After stimulation the cells were washed We have previously shown that resting macrophages are largely resistant to the effects of SFA 3 times withhowever, PBS and upon then were snap frozen andto scraped in liquid nitrogen.damage, Intracellular metabolites excess; activation exposure SFAs leads to lysosome cell death, and wereinflammasome quantified by activation LC-MS/MS at Sanford Burnham Metabolomics Core, Medical Discovery Institute [9,11]. An important consequence of macrophage activation is dramatic (Lake Nona, FL, USA). reprogramming of cellular metabolism, raising the intriguing possibility that interplay between the internal and external metabolic milieu might be relevant to the toxic effects of lipids. Glutamine 3. Results metabolism is modulated by TLR4‐activation, but the influence of this nutrient pathway on lipid 3.1. stress responses has not been explored. Consistent with increased uptake of glutamine, we observed Glutamine Deficiency Attenuates Macrophage Lipotoxic Responses that macrophages treated with LPS or LPS with palmitate had increased intracellular glutamine We have previously shown thatinvestigate resting macrophages are largely to macrophages the effects of SFA levels (Figure 1A). To further glutamine handling in resistant activated we excess; however, upon release, activation exposureof toglutamine SFAs leads to lysosome damage, and quantified ammonia a byproduct catabolism. Treatment with cell LPS death, increased release of ammonia macrophages under control and stress conditions. inflammasome activationfrom [9,11]. An important consequence oflipid macrophage activationIn is contrast, dramatic baseline and LPS‐induced ammonia release were significantly decreased when cells were activated reprogramming of cellular metabolism, raising the intriguing possibility that interplay between the in glutamine free conditions (Figure 1B,C). internal and external metabolic milieu might be relevant to the toxic effects of lipids. Glutamine To elucidate the impact of glutamine on lysosome damage we metabolism is modulated by TLR4-activation, butlipid‐induced the influencemacrophage of this nutrient pathway on lipid activated pMACs with palmitate and LPS in control media or media deficient in glutamine. In the stress responses has not been explored. Consistent with increased uptake of glutamine, we observed of glutamine, cell death and lysosome damage in response to palmitate and thatabsence macrophages treatedmacrophage with LPS or LPS with palmitate had increased intracellular glutamine LPS were significantly decreased (Figure 2A,B). In addition, release of the inflammasome regulated levels (Figure 1A). To further investigate glutamine handling in activated macrophages we quantified cytokine IL‐1β was also diminished when glutamine was absent. TNFα secretion, which is not ammonia release, a byproduct of glutamine catabolism. Treatment with LPS increased release of regulated by the inflammasome or lysosome damage, was not reduced with glutamine deficiency ammonia from macrophages under control and lipid stress conditions. In contrast, baseline and indicating that macrophage inflammatory function was not globally suppressed (Figure 2C,D). LPS-induced ammonia release were significantly decreased when cells were activated in glutamine Thus, alterations in TLR4 activation‐induced glutamine metabolism are required for FAs in the free conditions (Figure 1B,C). nutrient microenvironment to produce toxicity in macrophages.
Figure 1. Glutamine metabolism is increased in activated macrophages. (A) Peritoneal macrophages Figure 1. Glutamine metabolism is increased in activated macrophages. (A) Peritoneal macrophages (pMACs) were treated with control (BSA-PBS), BSA-LPS (100 ng), or palm (250 µM)-LPS (100 ng) (pMACs) were treated with control (BSA‐PBS), BSA‐LPS (100 ng), or palm (250 μM)‐LPS (100 ng) for for 16 h; and intracellular glutamine levels were quantified by mass spectroscopy; (B) After the 16 h; and intracellular glutamine levels were quantified by mass spectroscopy; (B) After the indicated indicated stimulations for 164 release was quantified in the supernatant; (C) pMACs were stimulated in h, NH4 release was quantified in the supernatant; (C) pMACs were stimulations for 16 h, NH stimulated in glutamine sufficient (open bars) or glutamine deficient (filled bars) 4 media and NH4 release into the glutamine sufficient (open bars) or glutamine deficient (filled bars) media and NH release into the media was quantified at 16 h. Bar graphs report the mean ˘ standard error (SE) for media was quantified at 16 h. Bar graphs report the mean ± standard error (SE) for a minimum of 3 experiments, performed in triplicate. *, p 0.05 for PBS #, p PBS