Going beyond 1 000 000 resolved points in a Brillouin distributed fiber sensor: theoretical analysis and experimental demonstration Supporting material Andrey Denisov, Marcelo A. Soto, Luc Thévenaz* EPFL Swiss Federal Institute of Technology, Group for Fiber Optics (GFO), SCI-STI-LT, Station 11, CH-1015 Lausanne, Switzerland
S1
Correlation peak shape
The amplitude of the acoustic wave generated during stimulated Brillouin scattering (SBS) is governed by the following equation1 : t
ρ(t, z) = jg1 ∫ exp (− −∞
t − t′ ) Ap (t′ , z)A∗s (t′ , z) dt′ , 2τ
(S1)
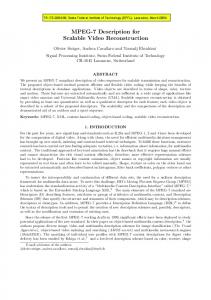
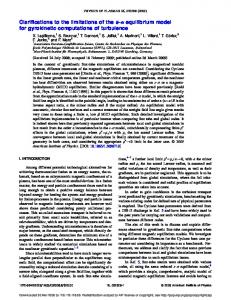
where g1 is the electrostrictive coupling constant, τ is the acoustic phonon lifetime, and Ap , As are the complex amplitudes of counterpropagating pump and signal waves respectively. It can be observed that this equation represents convolution of the counterpropagating optical waves. For pump and probe modulated with a pseudo-random bit sequence (PRBS), this convolution leads to a triangular shape, with the bottom width given by the bit duration – for instance, 28 mm for the 140 ps bit duration used in our experiment. This provides a full-width at half-maximum (FWHM) of 14 mm, which is typically considered to be the spatial resolution for this type of sensors. However, it is important to consider that in real systems the transition between two phase values is far from being instantaneous; for instance, the manufacturer of the PRBS generator used in our experiment gives a typical 20 %–80 % transition time of 23 ps which is not negligible for a bit duration of 140 ps. Figure S1a shows how the non-instantaneous phase transition affects the correlation peak shape (solid blue line) in comparison to the ideal case (red dashed line). Interestingly, the FWHM decreases from 14 mm down to 9 mm, while the bottom width broadens from 28 mm up to 40 mm. Another effect given by the non-instantaneous phase transition is the generation of stable weak gratings along the fiber. Figure S1b shows three consecutive gratings separated by 14 mm being generated outside the correlation peak (note that the vertical axis in Figure S1b is normalized to the maximum amplitude of the correlation peak shown in Figure S1a). The change in the correlation peak shape and the presence of weak permanent gratings can be also explained by examining the spectrum of the phase-modulated light. Figure S2 shows the predicted spectrum for both perfect and imperfect modulation of phases. First, it can be seen that non-instantaneous transition between two phase values suppresses higher-order components of the spectrum, effectively making it narrower. This explains the broadening of the correlation peak. Additionally, strong lines appear at frequencies equal to the integer number of the bitrate – where the spectrum of the perfectly-modulated light *
Corresponding author; e-mail:
[email protected]
S1
a
b Acoustic wave amplitude (a.u.)
Acoustic wave amplitude (a.u.)
1.0 0.8 0.6 0.4 0.2 0
−20
−10
0 10 Position (mm)
0.08 0.06 0.04 0.02 0
20
30
40 50 Position (mm)
60
Figure S1: Average acoustic wave amplitude for non-ideal phase modulation at different fiber positions: a) at the correlation peak (the dashed red line corresponds to the perfect square modulation case), and b) off the correlation peak.
a
b 35 Intensity (dB)
Intensity (dB)
30 20 10 0
30 25 20 15
−60 −40 −20 0 20 40 Relative frequency (GHz)
−20
60
−10 0 10 Relative frequency (GHz)
20
Figure S2: Theoretically calculated spectrum for light modulated with a PRBS with a 10 GHz bitrate for perfectly rectangular modulation (grey line) and non-instantaneous transition between phases (black line) for a) a large frequency span and b) the vicinity of the carrier frequency.
goes down to zero. These lines generate the weak gratings which are separated by a distance proportional to the inverted bitrate. The reflectivity of each weak grating (given by the integral of the acoustic wave amplitude) is equal to ∼3.5 % of the correlation peak reflectivity; however, since the phases of pump and signal are uncorrelated at the weak grating positions, constructive or destructive interferometric coupling may occur and the direction of the energy transfer between the optical waves is thus random, adding noise to the system. The accumulated noise from this effect is linearly proportional to the interaction length between pump and signal waves given by the pump pulse duration.
S2
a
b Hotspot
δ
−l
0
−s/2−d
δ
−s/2 0
−s/2+d
Gain response
1
Gain response
1
0
Correlation peak
Acoustic wave amplitude
Acoustic wave amplitude
Hotspot Correlation peak
−l
s – sampling interval 0.5
0
0 Correlation peak position
−s/2 0 s/2 Correlation peak position
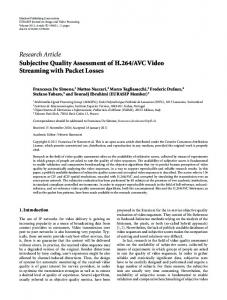
Figure S3: Calculating the gain response of a phase-correlation sensor for a triangular hotspot for a) general case and b) correlation peak is shifted from the hotspot by a half of the sampling interval.
S2
Calculating spatial resolution for a triangular correlation peak
Having an analytical expression for the correlation peak shape enables us to derive an analytical expression for the gain response and the maximum sampling interval required by the system. In order to provide a generic solution, independently of the specific bandwidth limitation of our PRBS generator, a triangular correlation peak will be considered in the following mathematical formulation. Let’s consider a hotspot with a given length δ and a triangular correlation peak with FWHM d that is offset from the hotspot centre by an arbitrary shift l (see top part of Figure S3a). The shape of a correlation peak with integral equal to unity is given by z+l 1 (1 − ∣ ∣) , (S2) d d for −d ≤ z + l ≤ d. The gain response is equal to the cross-correlation between the correlation peak and the hotspot (given at each position l by the overlap integral between them): ρ(z) =
δ/2
∫ −δ/2
1 z+l (1 − ∣ ∣) dz . d d
(S3)
The lower part of Figure S3a shows the gain response calculated for several positions of the correlation peak. To find the sampling interval s that ensures detection of a hotspot with a given length δ, one has to find the point at which the gain reaches half of its maximum value (see Figure S3b), which leads to the following equation: δ/2
∫ −δ/2
1 z + s/2 1 (1 − ∣ ∣) dz = . d d 2 S3
(S4)
Maximum allowed sampling interval (mm)
20
15
10
5
0
0
5
10 15 Spatial resolution (mm)
20
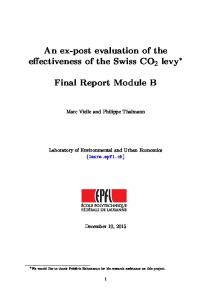
Figure S4: Minimum sampling interval required to obtain a given spatial resolution for the perfect square modulation (dashed red line) and the non-instantaneous phase modulation (solid blue line). The dash-dotted black line represents the asymptotic case commonly used in the state-of-the-art considering a sampling interval equal to the spatial resolution.
The dark blue area on Figure S3 represents the integral in the equation. Considering that the integral of the whole correlation peak is equal to 1, the sum of surfaces outside the correlation hotspot (light blue triangles in Figure S3) has also to be equal to 1/2. These triangles have bases d − (s/2 + δ/2) and d − (−s/2 + δ/2) for the left and the right one, respectively. Thus, their total surface can be easily found through triangle similarity, replacing the integral in Equation (S4): 1 1 ((d − δ/2 − s/2)2 + (d − δ/2 + s/2)2 ) = . (S5) d2 2 This equation can be easily solved for s (discarding, for obvious reasons, the negative solution): √ s = 2d2 − (2d − δ)2 . (S6) Equation (S6) gives the largest sampling interval s that can be used for the reliable detection of a hotspot of length δ using√a correlation peak FWHM equal to d. This expression is valid for a hotspot size δ ranging from 2d(1 − 1/ 2), the smallest detectable hotspot size, up to the FWHM of the correlation peak d, at which the dependence reaches the asymptote s = δ. The dashed red line on Figure S4 shows the result of this calculation for d = 14 mm. The best possible spatial resolution is equal to 8.2 mm. For the case of non-instantaneous phase transition the relation between the sampling interval and the spatial resolution has to be derived numerically. The solid blue line in Figure S4 shows the result of this calculation for the bit duration of 140 ps and transition time of 40 ps; the best possible resolution in this case is equal to 7.2 mm* . Note that under the analysed condition, both non-ideal and ideal phase modulation provide quite similar results. Thus, Equation (S6) can be used as a good approximation in further analysis. * It may look strange that the spatial resolution is better for the imperfect modulation, but it must be kept in mind that the noise levels are higher in such a case, thus, the overall performance of the imperfect system is worse. This better spatial resolution is a direct consequence of the more peaky correlation function for non-instantaneous transitions, as illustrated in Figure S1a.
S4
S3
Pump pulse duration and signal-to-noise ratio
Since the acoustic wave requires some time to reach its steady state, the amplitude of the measured signal highly depends on the duration of the pump pulse. This section is dedicated to calculation of this dependence. At the centre of the correlation peak the phases of pump and signal are perfectly correlated, therefore Equation (S1) can be simplified to find the evolution of the acoustic wave in time: t
t − t′ ) dt′ 2τ
ρ(z = 0, t) =
jg1 Ap A∗s ∫ 0
exp (−
=
jg1 Ap A∗s 2τ
t (1 − exp (− )) , 2τ
(S7)
where g1 is the electrostrictive coupling constant, τ is the acoustic phonon lifetime, and Ap , As are the complex amplitudes of the pump and the signal waves respectively. This equation gives the temporal response of the acoustic wave at the maximum amplitude of the correlation peak, whilst the interaction is weaker at other longitudinal positions of the peak, generating a correlation peak shape as shown in Figure S1a. The evolution of the amplitude of the signal wave is given by the following equation2 : 1 ∂As (z, t) 1 ∂As (z, t) − = − jg2 Ap (z, t)ρ∗ (z, t) , ∂z Vg ∂t 2
(S8)
where Vg is the group velocity and g2 is elasto-optic coupling coefficient. Let’s define the effective length deff of the correlation peak through the asymptotic shape of the correlation peak: +∞
deff
1 = ∫ ρ(z, t = +∞) dz , ρ(z = 0, t = +∞)
(S9)
−∞
which allows us to replace an arbitrarily shaped correlation peak with a rectangular one with the width of deff and amplitude ρ(z = 0, t) from Equation (S7). Since the bit duration is much shorter than the acoustic phonon lifetime, we can consider the hotspot as a point source of gain, solving Equation (S8) at each point of time in a quasi-steady-state condition: ∂As (z, t) 1 = − jg2 Ap (z, t)ρ∗ (z, t) , ∂z 2 1 ∆As = − jg2 Ap ρ(z = 0, t)deff , 2 1 t ∆As = g1 g2 ∣Ap ∣2 As 2τ (1 − exp (− )) . 2 2τ
(S10) (S11) (S12)
Here ∆As represents the sensor response at the correlation peak. Since this is measured by a photodetector, the following signal intensity is detected: Is = ∣As + ∆As ∣2 = A2s + 2As ∆As + ∆A2s . S5
(S13)
The third term is actually very small and can be safely neglected, giving the final equation for the useful signal of the system: ∆Is (t) = 2g1 g2 τ Is Ip deff (1 − exp (−
t )) 2τ
t = gcp Is (1 − exp (− )) , 2τ
(S14)
where Is , Ip are intensities of the signal and the pump wave and gcp is the asymptotic gain on the correlation peak. This signal grows while the pump pulse overlaps with the correlation peak and sharply goes to zero after it has passed. Since the measurement bandwidth is given by the inverted pump pulse width tPW , the measured signal is given by the time average of Equation (S14), as: tPW
gcp Is t ∆Is,msr = ∫ (1 − exp (− )) dt tPW 2τ 0
= gcp Is (1 −
(S15)
2τ tPW (1 − exp (− ))) . tPW 2τ
Knowing the gain gcp provided by the correlation peak and the standard deviation σN of the measurement noise, Equation (S15) can be used to predict the signal-to-noise ratio (SNR) of the system, as: SN R =
S4
∆Is,msr . σN
(S16)
Measurement time
As it has been shown above, a given spatial resolution can be achieved by multiple combinations of bit duration and sampling interval. In this section it will be shown that for a given spatial resolution there exists an optimal combination of bit duration and sampling interval values which results in the shortest possible measurement time. Note that the measurement time tmsr is inversely proportional to the sampling interval s since smaller sampling intervals automatically lead to more points being measured along the fiber. However, tmsr is also inversely proportional to the square of the bit duration – the signal grows linearly with the bit duration, decreasing the required averaging time quadratically; therefore, tmsr ∝ 1/sd2 . Let’s rewrite the denominator using Equation (S6) for the sampling interval: √ sd2 = d2 −2d2 + 4dδ − δ 2 . (S17) The minimum measurement time can be easily found by taking the derivative of this expression over d and solving a quadratic equation, producing the following answer: √ d = δ(5 ± 13)/6 . (S18) S6
Measurement time (a.u.)
1.5
1.0
0.5
0
0.8 1.0 1.2 1.4 1.6 Correlation peak FWHM normalised to the spatial resolution
Figure S5: Dependence of the measurement time on the correlation peak size for a fixed spatial resolution. Correlation peak FWHM is normalized to the spatial resolution.
The plus sign gives the desired minimum time, while the minus sign corresponds to imaginary value of √ s using Equation (S6). This optimal measurement time is obtained with a correlation peak size d = δ(5+ 13)/6 ≈ 1.43δ and a sampling interval s ≈ 0.79δ. Figure S5 shows how the measurement time depends on the correlation peak size for a given spatial resolution. As one can see, the optimized measurement time is 40 % shorter than the time considered in the state-of-the-art approach, in which the spatial resolution and sampling interval are assumed to be equal to the correlation peak size (see Figure S5).
References 1 Zadok A, Antman Y, Primerov N, Denisov A, Sancho J et al. Random-access distributed fiber sensing. Laser Photon Rev 2012; 6: L1-L5. 2 Beugnot JC, Tur M, Mafang SF, Thévenaz L. Distributed Brillouin sensing with sub-meter spatial resolution: modeling and processing. Opt Express 2011; 19: 7381–7397.
S7