SESSION IV: EARTH CRUSTAL DEFORMATION, EARTHQUAKES, AND REGIONAL MOVEMENTS I
GPS VECTOR CONFIGURATION DESIGN FOR MONITORING DEFORMATION NETWORK IN THE NORTH OF ISRAEL Gilad Even-Tzur Department of Civil Engineering, Technion – Israel Institute of Technology, Haifa 32000, Israel; E-MAIL:
[email protected]
1. Abstract The Geodetic-Geodynamic monitoring network in the north of Israel was established in order to measure the relative motion and deformation between the two sides of the Dead Sea Rift. In the fall of 1996 the Geological Survey of Israel and the Survey of Israel carried out the first GPS campaign in the area. A second campaign is planed for the spring of 2001. This article address the issue of the preferred GPS vectors for measurement in the second GPS campaign, man attempt to ensure a network with maximal ability of monitoring possible deformation models. This article wishes to suggest that a sensitivity analysis of the network could assist in this task. A postulated velocity field can be created, based on prior deformation information. Based on this velocity filed a method for GPS vector configuration design is suggested. The proposed method aims at using the most effective vectors in the network sensitivity. This paper will present the mathematical and the statistical concepts relevant for the GPS vector configuration design of a monitoring geodetic network. It will also present a set of GPS vectors that provide a sensitive network, performed against two deformation models, the Simple Transform Fault and the Locked Fault models. 2. Introduction The purpose of a deformation survey is to determine whether the monitored object is deformed or not. Monitoring networks, aimed for the purpose of detecting such deformation processes, should be analyzed according to three criterions: accuracy, reliability, and sensitivity. Accuracy describes the quality of the network in terms of random errors. Reliability is defined as the ability of the network to sense and identify gross errors in the measurements, as the undetected influence of gross errors in a monitoring network can be easily interpreted as a deformation, thus creating an undesirable situation. The sensitivity of a monitoring network is defined as its capacity to detect and measure movements and deformations in the area covered by the network. The geological phenomenon monitored and its parameters are used to analyze the sensitivity of a network. In a deformation area the possible deformation model can be predicted according to information derived from geological and seismic surveys and geodetic results. A network is defined as sensitive when the geological phenomena, if they occur, can be detected with specified probabilities α and β (α being the level of significance, β being the test power). The Galilee-Golan network is located along the Dead Sea Rift in the north of Israel, where both sides of the rift are accessible (in accordance with the current political status). The network consists of twenty points located along both sides of the rift, beginning from Lake Kinneret (Sea of Galilee) till the borders with Lebanon and Syria.
154
The 10th FIG International Symposium on Deformation Measurements
GPS VECTOR CONFIGURATION DESIGN FOR MONITORING DEFORMATION NETWOIN THE NORTH OF ISRAEL
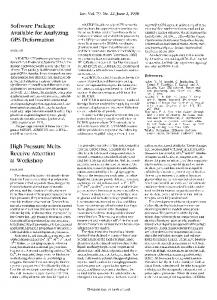
Four GPS campaigns were carried out between 1990 to 1993. No significant movements were detected during that time (Adler et al. 1994). During the fall of 1996 an additional campaign was carried out as part of the measurements of the Geodetic-Geodynamic Network of Israel (G1). The G1 network was designed and constructed by the Geological Survey of Israel and the Survey of Israel. The northern part of the G1 network was measured by four dual frequency GPS receivers in 23 sessions. Measurements of most of the points were carried out at least twice, each in a twenty-four hours session. This was done in order to detect and identify gross errors resulting from the positioning of the antenna at the marker points, identifying alignment errors and measuring the antenna height. The GPS data processing was carried out by Survey of Israel by using BERNESE (Rothacher and Mervart, 1996). The northern part of the G1 network contains more than forty points, twenty of them are the original Galilee-Golan network points. Both networks are show in Fig. 1. The northern part constellation, the coordinates and their variance-covariance matrix, based on the GPS surveying campaigns measured during the fall of 1996 and processed by the BERNESE software, would be used in this paper to design the GPS vector configuration. Settlement
G1 point
20
20 km
Scale:
3 18
22
25
21
26
Nahariyya
Qiryat Shemon
19
23
24
17 14
27
10
2
1
Galilee-Golan point
Haifa
33
32
30
16 15
Zafat
29
28
Akko
13
34
43
12
35
Katzrin
4
6 5
7 9
Lake Kinneret
31
42
8
10
Tiberia
11
41
46 44
40
36
Nazaret 39
47
45
38
37
Fig. 1 – Galilee-Golan network, and the Geodetic-Geodynamic (G1) network in the north of Israel.
19 – 22 March 2001 Orange, California, USA
155
SESSION IV: EARTH CRUSTAL DEFORMATION, EARTHQUAKES, AND REGIONAL MOVEMENTS I
3. Sensitivity Criteria For two epochs i=1,2 there are two sets of estimation coordinates and singular cofactor matrices: 2.4 mm / yr and xˆ 2 , Q xˆ 2 . The reference system definition for the two sets must be the same. Let the time interval between two epochs of observations be ∆t . The velocity vector xˆ& = (xˆ 2 − xˆ1 ) ∆t (1) represents the velocity of the network points. Velocities are assumed to be constant. The cofactor matrix of the velocity vector xˆ& is Q ˆ + Qˆ Q &ˆx = x 1 2 x 2 . (2) ( ∆t ) The null hypothesis H0 : xˆ& = 0 can be tested against the alternative hypothesis H1 : xˆ& ≠ 0 . If the null hypothesis is accepted there is no movement of points in the network. The cofactor matrix Q ˆx& has rank r and d degrees of freedom in the estimation of xˆ& and the a posteriori variance factor is σ$ 0 2 . The test statistic including all velocities of the network points is: T xˆ& Q +ˆ&x xˆ& t= ~ Fr , d . (3) 2 rσˆ 0 For three-dimensional networks with u points r=3u-7, for two-dimensional networks r=2u-4, and for one-dimensional networks r=u-1. If t > Fr ,d , α , the null hypothesis is rejected with probability α. This means that at least one point has moved significantly. Sometimes the parameters xˆ& , σ$ 0 2 , and Q ˆx& are unknown, but apriori values can be assigned. Let the apriori variance factor be σ 2o = 1 , the weight matrix set as P, and the rank deficient design matrix set as A, then
(
)
+
Q x = N+ = A T PA . (4) Under the assumption that the measurements for the two epochs are identical, the covariance matrix of the velocity vector x& is 2 Qx Q &x = . (5) ( ∆t ) 2 The pseudo-inverse Q +x& is +
2(N)+ ( ∆t ) 2 ( ∆t ) 2 T Q = = N = (A PA) . 2 2 2 ( ∆t ) The value of the test statistic t can now be computed as x& T Q x+& x& t= ~ Fr ,∞ . 2 rσ 0 If H1 is true, the test statistic has a non-central F distribution with non-centrality parameter λ given by + x&
156
(6)
(7)
The 10th FIG International Symposium on Deformation Measurements
GPS VECTOR CONFIGURATION DESIGN FOR MONITORING DEFORMATION NETWOIN THE NORTH OF ISRAEL
x& T Q +x& x& λ= . (8) σ02 We define λ 0 as the boundary value of λ, which will cause the null hypothesis to be rejected at probability levels α and β. The value λ 0 is an implicit function. Values of λ 0 for β = 0.7, 0.8, 0.9 are given by Baarda (1968) for different values of α and the degrees of freedom in the estimation. As stated before, the main aim is establishing a monitoring network, which will enable the rejection of the null hypothesis H 0 and the acceptance of the alternative hypothesis H1 , thus enabling the definition of the network as sensitive for monitoring the expected movements and deformation. 4. GPS vector configuration design Let λ < λ 0 . Adding a new GPS vector will increase λ. Let us find out what happens to λ when another vector a with corresponding weight p is added. P is the weight matrix and N is the normal matrix excluding the new vector. The augmented normal matrix N , including the new vector a, is: P A N = A T aT = A T PA + aT p a = N+ aT p a . (9) p a
(
)
Then the new value for λ is ( ∆t ) 2 T ( ∆t ) 2 T ( ∆t ) 2 T T & & & & λ= ( x N x ) = x (N + a p a) x = x& Nx& + x& T a T p ax& 2 2 2 2σ 0 2 σ0 2σ0
[
]
[
]
( ∆t ) 2 T ( ∆t ) 2 T T & & ( x N x ) + (x& a p ax& ) (10) 2σ20 2 σ20 = λ + ∆λ. For the purpose of achieving the largest possible improvement in the sensitivity of the network, one should seek a GPS vector that will contribute the most to the enlargement of λ. Based on a set of possible vectors one can identify the set contribution of each vector to the λ value. Naturally, the preferred addition would be of the vector with the maximal ∆λ . If the new value λ is still lower then λ 0 , a further addition of the next vector with =
the higest value of ∆λ should be made. This process should be continued until λ ≥ λ 0 . The computation of the vectors’ contribution to the λ value can be carried out at the monitoring network design stage. It requires the preparation of set of available vectors and the calculation of the value ∆λ for each of the vectors. The vectors should then be sorted according to their ∆λ values, the one with the highest value of ∆λ at the top, followed by the one with the second highest value of ∆λ etc. This ordered list could then be used for the selection of the additional vectors to be used until the sum of ∆λ is greather than or equal to λ 0 , ∑ ∆λi ≥ λ 0 . These vectors ensure the ability of the network to monitor possible deformations with probabilities α and β, by using the most effective GPS vectors in terms of the network sensitivity. As ∆λ depends on the velocity vector x& , different lists will be received for different vectors.
19 – 22 March 2001 Orange, California, USA
157
SESSION IV: EARTH CRUSTAL DEFORMATION, EARTHQUAKES, AND REGIONAL MOVEMENTS I
To this point, the analysis was carried under the assumption that the measurement vectors for the two epochs were identical. Since the first GPS campaign has already been carried out in 1996, the current aim is to identify a set of GPS vectors that should be measured in the second campaign, planed for 2001, in order to provide the desirable network sensitivity. The pseudo-inverse Q +x& is now Qx + Qx Q = 1 2 2 ( ∆t ) + x&
+
= ( ∆t ) 2 N1+ + N 2+
(
(
). +
(11)
)
+
In the literature, the following expression C+ + D+ is called the parallel sum of matrices, and is defined by (Rao and Mitra, 1971):
(C
+
+ D+
)
+
= C(C + D) + D = C(C + D) + (C + D) − C(C + D) + C
(12)
+
= C − C(C + D) C . Therefore we get
[
]
Q x+& = (∆t )2 N1 − N1 (N1 + N 2 )+ N1 . The non-centrality parameter λ is (∆t )2 x& T N − N (N + N )+ N x& . λ= 1 1 1 2 1 σ02
[
]
(13)
(14)
Following the first campaign a normal matrix N1 has been defined. From the set of possible GPS vectors we can now create the normal matrix N 2 for each vector and calculate the equivalent λ value. As stated before, the preferred GPS vector for the first measurement would be the vector with the highest value of λ , thus contributing the most to the network sensitivity. The pseudo-inverse in (14) does not enable finding ∆λ for each vector, as was done in (10). Therefore, after adding the first vector, one should repeat the process using the normal matrix N 2 already containing the additional vector and another vector from the possible GPS vectors list. Following the calculation of the new λ value for each vector, the preferred GPS vector for the second measurement would be the vector with the highest value of λ . The process should be repeated until λ > λ 0 , as desired. The additional vectors will ensure the ability of the network to monitor possible deformations with probabilities α and β, thus enabling the improvement of the network sensitivity in the planned second campaign. 5. GPS vector configuration design for the G1 network The proposed method will now be examined for the GPS vector configuration design of the G1 network in the north of Israel against two deformation models, the Simple Transform Fault and the Locked Fault models. A small code has been written using APL+Win software to demonstrate the algorithm. The configuration design process is confined to the horizontal plain, since the expected vertical motion is very small and the accuracy of GPS measurements in the vertical direction is poor. The basic assumption is that the only reason for movements and deformations in the area covered by the network is motion in the Dead Sea Rift. The variance in meters of vector l ij between points i and j
158
The 10th FIG International Symposium on Deformation Measurements
GPS VECTOR CONFIGURATION DESIGN FOR MONITORING DEFORMATION NETWOIN THE NORTH OF ISRAEL
is given by σ li = 0.003 + l ij × 0.1ppm , and a correlation of 7% is assumed between the two vector components. The correlation between the two vector components was derived from the variance-covariance matrix based on the first GPS surveying campaign. The variance of a unit weight is σ 20 = 1 . All possible vectors are set as vectors that can be measured between network points, totaling 1081 vectors. As the number of vectors is large, solving the GPS vector configuration involves a large number of computational steps. 5.1 The Simple Transform Fault model In the case of the Simple Transform Fault, each side of the fault is treated as a rigid body. Displacement of one side of the fault with respect to the other side can be estimated according to geological and seismological evidence. The relative movement between the two sides of the Dead Sea Rift could amount to a few millimeters per year. Based on prior geological observations the displacement is assessed between 5-6 millimeters per year in the North-South direction, and the vertical motion is lesser than one millimeter per year (Heimann, 1990). Based on seismological observations during the last 100 years, the horizontal movement is assessed at 0-2 millimeters per year. Let the west side of the Dead Sea Rift (represented by points number 11 to 47 in Fig. 1) be the reference side and the east side (points number 1 to 10 in Fig. 1) be the object side, with a relative movement of 5mm / yr . Then the 94 by 1 velocity vector of all network points is: x& T = [5 0 5 0 ... 0 0]mm / yr . When an α=0.05 level of significance is chosen, a power of test β=0.8 and the corresponding non-centrality parameter λ 0 = λ{α,β,r, ∞} = λ{0.05,0.8,90,∞ }= 39.2 are received. Assuming that the second campaign will be identical to the first campaign, from equation (8) for ∆t = 5 we get λ = 169.74 > λ0 . The network sensitivity is sufficient for detecting the hypothetical displacement. For an identical campaign carried out 5 years after the first one, the G1 network is sufficiently sensitive for detecting displacement greater than 2.4 mm / yr in the North-South direction. By using the proposed method we can present a set of GPS vectors that improve the sensitivity of the network up to a detection of 2 mm / yr movements. From equation (14) one can detect the vectors most effective in their contribution to the sensitivity of the network, when confined to the length limitation of vectors shorter than 40 km and 20 km long. Table 1 presents the top ten measurements with their corresponding λ value. The λ value for each row is computed from equation (14), while the normal matrix N 2 value is computed in an accumulative manner, containing all previous vectors as well as the last vector. To detect movements of 2 mm / yr in the NorthSouth direction, using GPS vectors shorter than 40 km , the first 22 vectors ensure a sensitive network. For vectors shorter than 20 km , the first 29 vectors provide a sensitive network. Figure 2 presents the contribution of the first 110 vectors to the network sensitivity. The contribution of the vectors to the sensitivity of the network is not linear. As more vectors are added, the lesser is each vector’s contribution. As in the case of the Simple Transform Fault there is a preference for measuring short vectors, as no great difference in the network’s sensitivity is achieved by changing the limitation of the vectors’ length.
19 – 22 March 2001 Orange, California, USA
159
SESSION IV: EARTH CRUSTAL DEFORMATION, EARTHQUAKES, AND REGIONAL MOVEMENTS I
For the Simple Transform Fault model, a change in the movement detection level does not create change in the list order, but obviously causes a revision of the λ values. Table 1 – The top 10 vectors with the highest contribution to λ value in Simple Transform Fault model: a) the vectors are less then 40 km long; b) the vectors are less then 20 km long. a) b)
λ
Vector terminals 6-15 20-1 19-2 5-16 8-12 36-10 4-15 20-3 15-7 8-30
λ
Vector terminals 6-15 20-1 5-16 10-11 19-3 8-15 20-2 4-13 15-9 19-1
5.20 10.21 13.73 16.96 20.03 22.86 25.13 26.79 28.35 29.72
λ 5.20 10.21 13.58 16.25 18.89 21.77 24.34 26.21 27.74 29.00
60 50 40 30 20 10 0
0
10
20
30
40
50
60
70
80
90 100 110 120
Number of vectors
Fig. 2 – The contribution of 110 vectors to the network sensitivity in the Simple Fault model. Black line - the vectors are less then 40 km long; Grey line - the vectors are less then 20 km long.
5.2 The Locked Fault model Another model that was tested is the standard Strike-Slip model from the Dislocation Theory of an infinitely long, straight fault embedded in a purely elastic half-space. In this model the fault is locked from the surface down to depth D, and slips freely below this depth V millimeters per year. While y is the distance perpendicular to the fault, the velocity parallel to the fault is: V y v x = tan −1 . (15) ð D When setting V = 5 mm/yr and D = 10 km , the velocity field of the G1 network points can be computed. The 94 by 1 velocity vector of all G1 network points is: x& T = [0.17 0 1.27 0 ... − 2.24 0]mm / yr .
160
The 10th FIG International Symposium on Deformation Measurements
GPS VECTOR CONFIGURATION DESIGN FOR MONITORING DEFORMATION NETWOIN THE NORTH OF ISRAEL
Assuming that the second campaign will be identical to the first campaign, from equation (8) for ∆t = 5 we get λ = 35.43 < λ 0 . The network sensitivity is insufficient for detecting the hypothetical displacement. By using the proposed method we can present a set of GPS vectors that provide a sufficiently sensitive network. Table 2 presents the top 10 measurements with their corresponding λ value for each case. For the detection of a Locked Fault model, while V = 5 mm/yr and D = 10 km , the first 13 vectors provide a fairly sufficiently sensitive network, while measuring vectors shorter than 40 km . For vectors shorter than 20 km the first 25 vectors provide a sufficiently sensitive network. It is clear that vectors in the EastWest direction contribute more to the network’s sensitivity than North-South vectors. Figure 3 presents the contribution of the first 110 vectors to the network sensitivity. Here too, as more vectors are added, the lesser is each vectors’ contribution. Longer vectors ensure better sensitivity for a lesser number of vectors. λ depends on the velocity vector x& , thus for different parameters D and V in the Locked Fault model (15) we get different lists. Table 2 – The top 10 vectors with the highest contribution to λ value for the Locked Fault model: One) the vectors are less then 40 km long; b) the vectors are less then 20 km long. a) b)
λ
Vector terminals 7-30 10-31 20-2 8-27 3-22 19-2 8-29 3-14 10-39 16-32
λ
Vector terminals 20-2 19-3 10-11 8-14 15-7 20-2 15-29 11-31 14-30 8-14
5.68 10.94 16.23 21.03 25.10 27.82 30.27 32.10 33.90 35.58
λ 5.26 9.69 13.55 17.17 19.55 21.52 23.30 24.97 26.35 27.69
70 60 50 40 30 20 10 0
0
10
20
30
40
50
60
70
80
90 100 110 120
Number of vectors
Fig. 3 – The contribution of 110 vectors to the network sensitivity for the Locked Fault model. Black line - the vectors are less then 40 km long; Grey line - the vectors are less then 20 km long.
19 – 22 March 2001 Orange, California, USA
161
SESSION IV: EARTH CRUSTAL DEFORMATION, EARTHQUAKES, AND REGIONAL MOVEMENTS I
6. Summary and Conclusions The purpose of monitoring networks is the determination of possible deformation in an investigated area. For this purpose the sensitivity of the network, defined as its capacity to detect and measure movements and deformation in the said area, is a crucial criterion. It is therefore suggested that the network should be designed based on the geological phenomena to be monitored. The GPS vector configuration design may be carried out mainly by the sensitivity criterion. With prior information at hand it is possible to design the GPS vector configuration according to a defined deformation model. This configuration will then contain the vectors with the most effective contribution to sensitivity of the network. The Geodetic-Geodynamic monitoring network in the north of Israel is used in demonstration of the proposed method. In this article two deformation models have been tested, the Simple Transform Fault and the Locked Fault models. In the case of the Simple Transform Fault model, a set of GPS vectors that ensure the sensitivity of the network for movements of 2 mm / yr in the North-South direction, is given. Even though different vector length limitations create different lists, no substantial difference in the network sensitivity is achieved by changing the vector length limitation. Under a set length limitation, changing the detected movement level does not change the list order but naturally causes a revision in the λ values. In the case of the Locked Fault model, a set of GPS vectors that ensure the sensitivity of the network for a locked depth of 10 km and slips of 5mm / yr in the North-South direction, is given. Vectors in East-West direction are shown to have a larger contribution to the sensitivity of the network than the North-South vectors. Measurement of longer vectors can contribute more to the sensitivity of the network, hence enabling the use of a smaller number of vectors. It is shown that λ is dependant on the velocity vector x& , and thus for different parameters D and V in the Locked Fault model different list are received. This paper presented a GPS vector configuration for the monitoring deformation network in the north of Israel based on two possible deformation models. A highly relevant issue at present as a second GPS campaign, following the first campaign carried out in the fall of 1996, is to be planned. We would like to suggest that the tools described here could be used for testing other models relevant for other deformation monitoring networks as well. Acknowledgments It is my pleasant duty to thank the Survey of Israel and Dr. E. Ostrovsky for providing the variance-covariance matrix of the G1 network in northern Israel. References Adler, R., Pelzer H., Foppe K., and Melzer Y. (1994). “Geodetic Monitoring of Recent Crusral Activity along the Dead Sea Jordan Rift”. Perelmuter Workshop on Dynamic Deformation Models, Haifa, Israel. Baarda, W. (1968). “A Testing Procedure for Use in Geodetic Networks”. Netherlands Geodetic Commission, Publications on Geodesy, New Series 2, No. 5.
162
The 10th FIG International Symposium on Deformation Measurements
GPS VECTOR CONFIGURATION DESIGN FOR MONITORING DEFORMATION NETWOIN THE NORTH OF ISRAEL
Cooper, M. A. R. (1987). “Control Surveys in Civil Engineering”. Collins, London. Even-Tzur, G. (1999). “Sensitivity Design for Monitoring Deformation Networks”. Bollettino Di Geodesia E Scienze Affini, Vol. 58, No. 4. Even-Tzur, G. (1997). “Optimal Design of GPS Based Geodetic Networks for Monitoring Deformation”. D.Sc. Thesis, Department of Civil Engineering, Technion - I.I.T. (in Hebrew). Heimann, A. (1990). “Development of the DSR and its Margins in Northern Israel during the Pliocene and Pleistocene”. Ph.D. Thesis, Hebrew University. Rao C. R., Mitra S. K. (1971). “Generalized Inverse of Matrices and its Application”. John Wiley and Sons, New York. Rothacher, M. and L. Mervart (Eds.) (1996). “Bernese GPS Software”. Ver. 4.0. Astronomical Institute, Univ. of Berne.
19 – 22 March 2001 Orange, California, USA
163