Chapter 1 Symmetry and Surface Area . ... Chapter 9 Linear Inequalities . ...... a
list of the sections in MathLinks 9 which address the SCO, with specific ...
ACKNOWLEDGMENTS
Acknowledgments The Department of Education and Early Childhood Development of Prince Edward Island gratefully acknowledges the contributions of the following groups and individuals toward the development of the Prince Edward Island Grade 9 Mathematics Curriculum Guide:
The following specialists from the Prince Edward Island Department of Education and Early Childhood Development: J. Blaine Bernard, Secondary Mathematics Specialist, Department of Education and Early Childhood Development
Bill MacIntyre, Elementary Mathematics/Science Specialist, Department of Education and Early Childhood Development
The Western and Northern Canadian Protocol (WNCP) for Collaboration in Education
Alberta Education
New Brunswick Department of Education
PRINCE EDWARD ISLAND GRADE 9 MATHEMATICS CURRICULUM GUIDE
i
TABLE OF CONTENTS
Table of Contents Background and Rationale............................................................................................... 1 Essential Graduation Learnings ................................................................ 1 Curriculum Focus ...................................................................................... 2 Connections across the Curriculum .......................................................... 2 Conceptual Framework for K-9 Mathematics ................................................................. 3 Mathematical Processes ........................................................................... 4 The Nature of Mathematics ....................................................................... 7 Contexts for Learning and Teaching ............................................................................ 10 Homework ............................................................................................... 10 Diversity in Student Needs ...................................................................... 11 Gender and Cultural Diversity ................................................................. 11 Mathematics for EAL Learners ............................................................... 11 Education for Sustainable Development ................................................. 12 Assessment and Evaluation .......................................................................................... 13 Assessment............................................................................................. 13 Evaluation ............................................................................................... 15 Reporting................................................................................................. 15 Guiding Principles ................................................................................... 15 Structure and Design of the Curriculum Guide ........................................................... 17 Specific Curriculum Outcomes...................................................................................... 18 Number ................................................................................................... 18 Patterns and Relations ............................................................................ 32 Shape and Space.................................................................................... 48 Statistics and Probability ......................................................................... 60 Curriculum Guide Supplement ...................................................................................... 71 Unit Plans ......................................................................................................................... 73 Chapter 1 Symmetry and Surface Area .............................................. 73 Chapter 2 Rational Numbers .............................................................. 77 Chapter 3 Powers and Exponents ...................................................... 83 Chapter 4 Scale Factors and Similarity .............................................. 89 Chapter 5 Introduction to Polynomials ................................................ 95 Chapter 6 Linear Relations ................................................................. 99 Chapter 7 Multiplying and Dividing Polynomials............................... 103 Chapter 8 Solving Linear Equations ................................................. 107 Chapter 9 Linear Inequalities ............................................................ 113 Chapter 10 Circle Geometry ............................................................... 117 Chapter 11 Data Analysis ................................................................... 121 Glossary of Mathematical Terms................................................................................. 127 Solutions to Possible Assessment Strategies ........................................................... 135 References ..................................................................................................................... 143
PRINCE EDWARD ISLAND GRADE 9 MATHEMATICS CURRICULUM GUIDE
ii
BACKGROUND AND RATIONALE
Background and Rationale The development of an effective mathematics curriculum has encompassed a solid research base. Developers have examined the curriculum proposed throughout Canada and secured the latest research in the teaching of mathematics, and the result is a curriculum that should enable students to understand and use mathematics. The Western and Northern Canadian Protocol (WNCP) Common Curriculum Framework for K-9 Mathematics (2006) has been adopted as the basis for a revised mathematics curriculum in Prince Edward Island. The Common Curriculum Framework was developed by the seven Canadian western and northern ministries of education (British Columbia, Alberta, Saskatchewan, Manitoba, Yukon Territory, Northwest Territories, and Nunavut) in collaboration with teachers, administrators, parents, business representatives, post-secondary educators, and others. The framework identifies beliefs about mathematics, general and specific student outcomes, and achievement indicators agreed upon by the seven jurisdictions. This document is based on both national and international research by the WNCP, and on the Principles and Standards for School Mathematics (2000), published by the National Council of Teachers of Mathematics (NCTM).
Essential Graduation Learnings Essential graduation learnings (EGLs) are statements describing the knowledge, skills, and attitudes expected of all students who graduate from high school. Achievement of the essential graduation learnings will prepare students to continue to learn throughout their lives. These learnings describe expectations not in terms of individual school subjects but in terms of knowledge, skills, and attitudes developed throughout the curriculum. They confirm that students need to make connections and develop abilities across subject boundaries if they are to be ready to meet the shifting and ongoing demands of life, work, and study today and in the future. Essential graduation learnings are cross curricular, and curriculum in all subject areas is focussed to enable students to achieve these learnings. Essential graduation learnings serve as a framework for the curriculum development process. Specifically, graduates from the public schools of Prince Edward Island will demonstrate knowledge, skills, and attitudes expressed as essential graduation learnings, and will be expected to
respond with critical awareness to various forms of the arts, and be able to express themselves through the arts;
assess social, cultural, economic, and environmental interdependence in a local and global context;
use the listening, viewing, speaking, and writing modes of language(s), and mathematical and scientific concepts and symbols, to think, learn, and communicate effectively;
continue to learn and to pursue an active, healthy lifestyle;
use the strategies and processes needed to solve a wide variety of problems, including those requiring language and mathematical and scientific concepts;
use a variety of technologies, demonstrate an understanding of technological applications, and apply appropriate technologies for solving problems.
More specifically, curriculum outcome statements articulate what students are expected to know and be able to do in particular subject areas. Through the achievement of curriculum outcomes, students demonstrate the essential graduation learnings.
PRINCE EDWARD ISLAND GRADE 9 MATHEMATICS CURRICULUM GUIDE
Page 1
BACKGROUND AND RATIONALE
Curriculum Focus There is an emphasis in the Prince Edward Island mathematics curriculum on particular key concepts at each grade which will result in greater depth of understanding. There is also more emphasis on number sense and operations in the early grades to ensure students develop a solid foundation in numeracy. The intent of this document is to clearly communicate to all educational partners high expectations for students in mathematics education. Students must learn mathematics with understanding, actively building new knowledge from experience and prior knowledge (NCTM, Principles and Standards for School Mathematics, 2000). The main goals of mathematics education are to prepare students to
use mathematics confidently to solve problems; communicate and reason mathematically; appreciate and value mathematics; make connections between mathematics and its applications; commit themselves to lifelong learning; become mathematically literate adults, using mathematics to contribute to society.
Students who have met these goals will
gain understanding and appreciation of the contributions of mathematics as a science, philosophy, and art; exhibit a positive attitude toward mathematics; engage and persevere in mathematical tasks and projects; contribute to mathematical discussions; take risks in performing mathematical tasks; exhibit curiosity.
Connections across the Curriculum The teacher should take advantage of the various opportunities available to integrate mathematics and other subjects. This integration not only serves to show students how mathematics is used in daily life, but it helps strengthen the understanding of mathematical concepts by students and provides them with opportunities to practise mathematical skills. There are many possibilities for integrating mathematics in literacy, science, social studies, music, art, physical education, and other subject areas. Efforts should be made to make connections and use examples drawn from a variety of disciplines.
PRINCE EDWARD ISLAND GRADE 9 MATHEMATICS CURRICULUM GUIDE
Page 2
CONCEPTUAL FRAMEWORK FOR K-9 MATHEMATICS
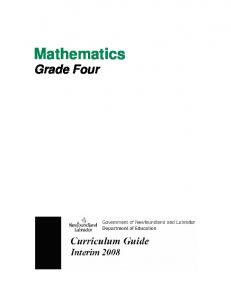
Conceptual Framework for K-9 Mathematics The chart below provides an overview of how mathematical processes and the nature of mathematics influence learning outcomes.
GRADE
K
1
2
3
4
5
6
7
8
9
STRAND Number Patterns and Relations Patterns Variables and Equations Shape and Space Measurement 3-D Objects and 2-D Shapes Transformations
GENERAL CURRICULUM OUTCOMES (GCOs) SPECIFIC CURRICULUM OUTCOMES (SCOs) ACHIEVEMENT INDICATORS
Statistics and Probability Data Analysis Chance and Uncertainty MATHEMATICAL PROCESSES
NATURE OF MATHEMATICS Change Constancy Number Sense Patterns Relationships Spatial Sense Uncertainty
Communication, Connections, Reasoning, Mental Mathematics and Estimation, Problem Solving, Technology, Visualization
The mathematics curriculum describes the nature of mathematics, as well as the mathematical processes and the mathematical concepts to be addressed. This curriculum is arranged into four strands, namely Number, Patterns and Relations, Shape and Space, and Statistics and Probability. These strands are not intended to be discrete units of instruction. The integration of outcomes across strands makes mathematical experiences meaningful. Students should make the connections among concepts both within and across strands. Consider the following when planning for instruction:
Integration of the mathematical processes within each strand is expected.
Decreasing emphasis on rote calculation, drill, and practice, and the size of numbers used in paper and pencil calculations makes more time available for concept development.
Problem solving, reasoning, and connections are vital to increasing mathematical fluency, and must be integrated throughout the program.
There is to be a balance among mental mathematics and estimation, paper and pencil exercises, and the use of technology, including calculators and computers. Concepts should be introduced using models and gradually developed from the concrete to the pictorial to the symbolic.
PRINCE EDWARD ISLAND GRADE 9 MATHEMATICS CURRICULUM GUIDE
Page 3
CONCEPTUAL FRAMEWORK FOR K-9 MATHEMATICS
Mathematical Processes There are critical components that students must encounter in a mathematics program in order to achieve the goals of mathematics education and encourage lifelong learning in mathematics. The Prince Edward Island mathematics curriculum incorporates the following seven interrelated mathematical processes that are intended to permeate teaching and learning. These unifying concepts serve to link the content to methodology. Students are expected to
communicate in order to learn and express their understanding of mathematics; [Communications: C]
connect mathematical ideas to other concepts in mathematics, to everyday experiences, and to other disciplines; [Connections: CN]
demonstrate fluency with mental mathematics and estimation; [Mental Mathematics and Estimation: ME]
develop and apply new mathematical knowledge through problem solving; [Problem Solving: PS]
develop mathematical reasoning; [Reasoning: R]
select and use technologies as tools for learning and solving problems; [Technology: T]
develop visualization skills to assist in processing information, making connections, and solving problems. [Visualization: V]
Communication [C] Students need opportunities to read about, represent, view, write about, listen to, and discuss mathematical ideas. These opportunities allow students to create links between their own language and ideas and the formal language and symbols of mathematics. Communication is important in clarifying, reinforcing, and modifying ideas, knowledge, attitudes, and beliefs about mathematics. Students should be encouraged to use a variety of forms of communication while learning mathematics. Students also need to communicate their learning using mathematical terminology. Communication can help students make connections among concrete, pictorial, symbolic, verbal, written, and mental representations of mathematical ideas. Connections [CN] Contextualization and making connections to the experiences of learners are powerful processes in developing mathematical understanding. When mathematical ideas are connected to each other or to real-world phenomena, students can begin to view mathematics as useful, relevant, and integrated. Learning mathematics within contexts and making connections relevant to learners can validate past experiences and increase student willingness to participate and be actively engaged. The brain is constantly looking for and making connections. For instance, opportunities should be created frequently to link mathematics and career opportunities. Students need to become aware of the importance of mathematics and the need for mathematics in many career paths. This realization will help maximize the number of students who strive to develop and maintain the mathematical abilities required for success in further areas of study.
PRINCE EDWARD ISLAND GRADE 9 MATHEMATICS CURRICULUM GUIDE
Page 4
CONCEPTUAL FRAMEWORK FOR K-9 MATHEMATICS
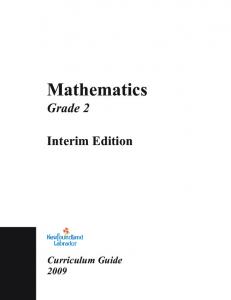
Mental Mathematics and Estimation [ME] Mental mathematics is a combination of cognitive strategies that enhance flexible thinking and number sense. It involves calculation without the use of external memory aids. Mental mathematics enables students to determine answers without paper and pencil. It improves computational fluency by developing efficiency, accuracy, and flexibility. Even more important than performing computational procedures or using calculators is the greater facility that students need - more than ever before - with estimation and mental mathematics (National Council of Teachers of Mathematics, May 2005). Students proficient with mental mathematics “become liberated from calculator dependence, build confidence in doing mathematics, become more flexible thinkers and are more able to use multiple approaches to problem solving” (Rubenstein, 2001). Mental mathematics “provides a cornerstone for all estimation processes offering a variety of alternate algorithms and non-standard techniques for finding answers” (Hope, 1988). Estimation is a strategy for determining approximate values or quantities, usually by referring to benchmarks or using referents, or for determining the reasonableness of calculated values. Students need to know when to estimate, what strategy to use, and how to use it. Estimation is used to make mathematical judgments and develop useful, efficient strategies for dealing with situations in daily life. Students need to develop both mental mathematics and estimation skills through context and not in isolation so they are able to apply them to solve problems. Whenever a problem requires a calculation, students should follow the decision-making process described below:
Problem Situation Calculation Required Approximate Answer Appropriate
Exact Answer Needed
Use Mental Calculation
Use Paper and Pencil
Use a Calculator/Computer
Estimate (NCTM)
Problem Solving [PS] Learning through problem solving should be the focus of mathematics at all grade levels. When students encounter new situations and respond to questions of the type, “How would you. . . ?" or “How could you. . . ?” the problem-solving approach is being modelled. Students develop their own problem-solving strategies by being open to listening, discussing, and trying different strategies. In order for an activity to be problem-solving based, it must ask students to determine a way to get from what is known to what is sought. If students have already been given ways to solve the problem, it is not
PRINCE EDWARD ISLAND GRADE 9 MATHEMATICS CURRICULUM GUIDE
Page 5
CONCEPTUAL FRAMEWORK FOR K-9 MATHEMATICS
a problem, but practice. A true problem requires students to use prior learning in new ways and contexts. Problem solving requires and builds depth of conceptual understanding and student engagement. Problem solving is also a powerful teaching tool that fosters multiple, creative, and innovative solutions. Creating an environment where students openly look for and engage in finding a variety of strategies for solving problems empowers students to explore alternatives and develops confident and cognitive mathematical risk takers. Over time, numerous problem-solving strategies should be modelled for students, and students should be encouraged to employ various strategies in many problem-solving situations. While choices with respect to the timing of the introduction of any given strategy will vary, the following strategies should all become familiar to students:
using estimation guessing and checking looking for a pattern making an organized list or table using a model
working backwards using a formula using a graph, diagram, or flow chart solving a simpler problem using algebra.
Reasoning [R] Mathematical reasoning helps students think logically and make sense of mathematics. Students need to develop confidence in their abilities to reason and justify their mathematical thinking. High-order questions challenge students to think and develop a sense of wonder about mathematics. Mathematical experiences in and out of the classroom provide opportunities for inductive and deductive reasoning. Inductive reasoning occurs when students explore and record results, analyse observations, make generalizations from patterns, and test these generalizations. Deductive reasoning occurs when students reach new conclusions based upon what is already known or assumed to be true. Technology [T] Technology contributes to the learning of a wide range of mathematical outcomes and enables students to explore and create patterns, examine relationships, test conjectures, and solve problems. Calculators and computers can be used to
explore and demonstrate mathematical relationships and patterns; organize and display data; extrapolate and interpolate; assist with calculation procedures as part of solving problems; decrease the time spent on computations when other mathematical learning is the focus; reinforce the learning of basic facts and test properties; develop personal procedures for mathematical operations; create geometric displays; simulate situations; develop number sense.
Technology contributes to a learning environment in which the growing curiosity of students can lead to rich mathematical discoveries at all grade levels. While technology can be used in K-3 to enrich learning, it is expected that students will meet all outcomes without the use of technology.
PRINCE EDWARD ISLAND GRADE 9 MATHEMATICS CURRICULUM GUIDE
Page 6
CONCEPTUAL FRAMEWORK FOR K-9 MATHEMATICS
Visualization [V] Visualization involves thinking in pictures and images, and the ability to perceive, transform, and recreate different aspects of the visual-spatial world. The use of visualization in the study of mathematics provides students with opportunities to understand mathematical concepts and make connections among them. Visual images and visual reasoning are important components of number, spatial, and measurement sense. Number visualization occurs when students create mental representations of numbers. Being able to create, interpret, and describe a visual representation is part of spatial sense and spatial reasoning. Spatial visualization and reasoning enable students to describe the relationships among and between 3-D objects and 2-D shapes. Measurement visualization goes beyond the acquisition of specific measurement skills. Measurement sense includes the ability to determine when to measure and when to estimate, and knowledge of several estimation strategies (Shaw & Cliatt, 1989). Visualization is fostered through the use of concrete materials, technology, and a variety of visual representations.
The Nature of Mathematics Mathematics is one way of trying to understand, interpret, and describe our world. There are a number of components that define the nature of mathematics which are woven throughout this document. These components include change, constancy, number sense, patterns, relationships, spatial sense, and uncertainty. Change It is important for students to understand that mathematics is dynamic and not static. As a result, recognizing change is a key component in understanding and developing mathematics. Within mathematics, students encounter conditions of change and are required to search for explanations of that change. To make predictions, students need to describe and quantify their observations, look for patterns, and describe those quantities that remain fixed and those that change. For example, the sequence 4, 6, 8, 10, 12, … can be described as
skip counting by 2s, starting from 4; an arithmetic sequence, with first term 4 and a common difference of 2; or a linear function with a discrete domain.
Constancy Different aspects of constancy are described by the terms stability, conservation, equilibrium, steady state, and symmetry (AAAS–Benchmarks, 1993, p. 270). Many important properties in mathematics and science relate to properties that do not change when outside conditions change. Examples of constancy include the following:
The area of a rectangular region is the same regardless of the methods used to determine the solution. The sum of the interior angles of any triangle is 1800. The theoretical probability of flipping a coin and getting heads is 0.5.
Some problems in mathematics require students to focus on properties that remain constant. The recognition of constancy enables students to solve problems involving constant rates of change, lines with constant slope, direct variation situations, or the angle sums of polygons.
PRINCE EDWARD ISLAND GRADE 9 MATHEMATICS CURRICULUM GUIDE
Page 7
CONCEPTUAL FRAMEWORK FOR K-9 MATHEMATICS
Number Sense Number sense, which can be thought of as intuition about numbers, is the most important foundation of numeracy (The Primary Program, B.C., 2000, p. 146). A true sense of number goes well beyond the skills of simply counting, memorizing facts, and the situational rote use of algorithms. Number sense develops when students connect numbers to real-life experiences, and use benchmarks and referents. This results in students who are computationally fluent, and flexible and intuitive with numbers. The evolving number sense typically comes as a by-product of learning rather than through direct instruction. However, number sense can be developed by providing rich mathematical tasks that allow students to make connections. Patterns Mathematics is about recognizing, describing, and working with numerical and non-numerical patterns. Patterns exist in all strands and it is important that connections are made among strands. Working with patterns enables students to make connections within and beyond mathematics. These skills contribute to students’ interaction with and understanding of their environment. Patterns may be represented in concrete, visual, or symbolic form. Students should develop fluency in moving from one representation to another. Students must learn to recognize, extend, create, and use mathematical patterns. Patterns allow students to make predictions and justify their reasoning when solving routine and non-routine problems. Learning to work with patterns in the early grades helps develop students’ algebraic thinking that is foundational for working with more abstract mathematics in higher grades. Relationships Mathematics is used to describe and explain relationships. As part of the study of mathematics, students look for relationships among numbers, sets, shapes, objects, and concepts. The search for possible relationships involves the collecting and analysing of data, and describing relationships visually, symbolically, orally, or in written form. Spatial Sense Spatial sense involves visualization, mental imagery, and spatial reasoning. These skills are central to the understanding of mathematics. Spatial sense enables students to interpret representations of 2-D shapes and 3-D objects, and identify relationships to mathematical strands. Spatial sense is developed through a variety of experiences and interactions within the environment. The development of spatial sense enables students to solve problems involving 2-D shapes and 3-D objects. Spatial sense offers a way to interpret and reflect on the physical environment and its 3-D or 2-D representations. Some problems involve attaching numerals and appropriate units (measurement) to dimensions of objects. Spatial sense allows students to use dimensions and make predictions about the results of changing dimensions.
Knowing the dimensions of an object enables students to communicate about the object and create representations. The volume of a rectangular solid can be calculated from given dimensions. Doubling the length of the side of a square increases the area by a factor of four.
Uncertainty In mathematics, interpretations of data and the predictions made from data may lack certainty. Events and experiments generate statistical data that can be used to make predictions. It is important to recognize that these predictions (interpolations and extrapolations) are based upon patterns that have a degree of uncertainty. The quality of the interpretation is directly related to the quality of the data. An awareness of uncertainty allows students to assess the reliability of data and data interpretation. Chance addresses the predictability of the occurrence of an outcome. As students develop their understanding of
PRINCE EDWARD ISLAND GRADE 9 MATHEMATICS CURRICULUM GUIDE
Page 8
CONCEPTUAL FRAMEWORK FOR K-9 MATHEMATICS
probability, the language of mathematics becomes more specific and describes the degree of uncertainty more accurately.
PRINCE EDWARD ISLAND GRADE 9 MATHEMATICS CURRICULUM GUIDE
Page 9
CONTEXTS FOR LEARNING AND TEACHING
Contexts for Learning and Teaching The Prince Edward Island mathematics curriculum is based upon several key assumptions or beliefs about mathematics learning which have grown out of research and practice:
Mathematics learning is an active and constructive process.
Learners are individuals who bring a wide range of prior knowledge and experiences, and who learn via various styles and at different rates.
Learning is most likely to occur in meaningful contexts and in an environment that supports exploration, risk taking, and critical thinking, and that nurtures positive attitudes and sustained effort.
Learning is most effective when standards of expectation are made clear with ongoing assessment and feedback.
Students are curious, active learners with individual interests, abilities, and needs. They come to classrooms with varying knowledge, life experiences, and backgrounds. A key component in successfully developing numeracy is making connections to these backgrounds and experiences. Young children develop a variety of mathematical ideas before they enter school. They make sense of their environment through observations and interactions at home and in the community. Their mathematics learning is embedded in everyday activities, such as playing, reading, storytelling, and helping around the home. Such activities can contribute to the development of number and spatial sense in children. Initial problem solving and reasoning skills are fostered when children are engaged in activities such as comparing quantities, searching for patterns, sorting objects, ordering objects, creating designs, building with blocks, and talking about these activities. Positive early experiences in mathematics are as critical to child development as are early literacy experiences. Students learn by attaching meaning to what they do, and they need to construct their own meaning of mathematics. This meaning is best developed when learners encounter mathematical experiences that proceed from the simple to the complex and from the concrete to the abstract. The use of models and a variety of pedagogical approaches can address the diversity of learning styles and developmental stages of students, and enhance the formation of sound, transferable, mathematical concepts. At all levels, students benefit from working with a variety of materials, tools, and contexts when constructing meaning about new mathematical ideas. Meaningful discussions can provide essential links among concrete, pictorial, and symbolic representations of mathematics. The learning environment should value and respect the experiences and ways of thinking of all students, so that learners are comfortable taking intellectual risks, asking questions, and posing conjectures. Students need to explore problem-solving situations in order to develop personal strategies and become mathematically literate. Learners must be encouraged that it is acceptable to solve problems in different ways and realize that solutions may vary.
Homework Homework is an essential component of the mathematics program, as it extends the opportunity for students to think mathematically and to reflect on ideas explored during class time. The provision of this additional time for reflection and practice plays a valuable role in helping students to consolidate their learning.
PRINCE EDWARD ISLAND GRADE 9 MATHEMATICS CURRICULUM GUIDE
Page 10
CONTEXTS FOR LEARNING AND TEACHING
Traditionally, homework has meant completing ten to twenty drill and practice questions relating to the procedure taught in a given day. With the increased emphasis on problem solving, conceptual understanding, and mathematical reasoning, however, it is important that homework assignments change accordingly. More assignments involving problem solving, mathematical investigations, written explanations and reflections, and data collection should replace some of the basic practice exercises given in isolation. In fact, a good problem can sometimes accomplish more than many drill-oriented exercises on a topic. As is the case in designing all types of homework, the needs of the students and the purpose of the assignment will dictate the nature of the questions included. Homework need not be limited to reinforcing learning; it provides an excellent opportunity to revisit topics explored previously and to introduce new topics before teaching them in the classroom. Homework provides an effective way to communicate with parents and provides parents an opportunity to be actively involved in their child’s learning. By ensuring that assignments model classroom instruction and sometimes require parental input, a teacher can give a parent clearer understanding of the mathematics curriculum and of the child’s progress in relationship to it. As Van de Walle (1994, p. 454) suggests, homework can serve as a parent’s window to the classroom.
Diversity in Student Needs Every class has students at many different cognitive levels. Rather than choosing a certain level at which to teach, a teacher is responsible for tailoring instruction to reach as many of these students as possible. In general, this may be accomplished by assigning different tasks to different students or assigning the same open-ended task to most students. Sometimes it is appropriate for a teacher to group students by interest or ability, assigning them different tasks in order to best meet their needs. These groupings may last anywhere from minutes to semesters, but should be designed to help all students (whether strong, weak or average) to reach their highest potential. There are other times when an appropriately openended task can be valuable to a broad spectrum of students. For example, asking students to make up an equation for which the answer is 5 allows some students to make up very simple equations while others can design more complex ones. The different equations constructed can become the basis for a very rich lesson from which all students come away with a better understanding of what the solution to an equation really means.
Gender and Cultural Equity The mathematics curriculum and mathematics instruction must be designed to equally empower both male and female students, as well as members of all cultural backgrounds. Ultimately, this should mean not only that enrolments of students of both genders and various cultural backgrounds in public school mathematics courses should reflect numbers in society, but also that representative numbers of both genders and the various cultural backgrounds should move on to successful post-secondary studies and careers in mathematics and mathematics-related areas.
Mathematics for EAL Learners The Prince Edward Island mathematics curriculum is committed to the principle that learners of English as an additional language (EAL) should be full participants in all aspects of mathematics education. English deficiencies and cultural differences must not be barriers to full participation. All students should study a comprehensive mathematics curriculum with high-quality instruction and co-ordinated assessment. The Principles and Standards for School Mathematics (NCTM, 2000) emphasizes communication “as an essential part of mathematics and mathematics education” (p.60). The Standards elaborate that all
PRINCE EDWARD ISLAND GRADE 9 MATHEMATICS CURRICULUM GUIDE
Page 11
CONTEXTS FOR LEARNING AND TEACHING
students, and EAL learners in particular, need to have opportunities and be given encouragement and support for speaking, writing, reading, and listening in mathematics classes. Such efforts have the potential to help EAL learners overcome barriers and will facilitate “communicating to learn mathematics and learning to communicate mathematically” (NCTM, p.60). To this end,
schools should provide EAL learners with support in their dominant language and English language while learning mathematics;
teachers, counsellors, and other professionals should consider the English-language proficiency level of EAL learners as well as their prior course work in mathematics;
the mathematics proficiency level of EAL learners should be solely based on their prior academic record and not on other factors;
mathematics teaching, curriculum, and assessment strategies should be based on best practices and build on the prior knowledge and experiences of students and on their cultural heritage;
the importance of mathematics and the nature of the mathematics program should be communicated with appropriate language support to both students and parents;
to verify that barriers have been removed, educators should monitor enrolment and achievement data to determine whether EAL learners have gained access to, and are succeeding in, mathematics courses.
Education for Sustainable Development Education for sustainable development (ESD) involves incorporating the key themes of sustainable development - such as poverty alleviation, human rights, health, environmental protection, and climate change - into the education system. ESD is a complex and evolving concept and requires learning about these key themes from a social, cultural, environmental, and economic perspective, and exploring how those factors are interrelated and interdependent. With this in mind, it is important that all teachers, including mathematics teachers, attempt to incorporate these key themes in their subject areas. One tool that can be used is the searchable on-line database Resources for Rethinking, found at http://r4r.ca/en. It provides teachers with access to materials that integrate ecological, social, and economic spheres through active, relevant, interdisciplinary learning.
PRINCE EDWARD ISLAND GRADE 9 MATHEMATICS CURRICULUM GUIDE
Page 12
ASSESSMENT AND EVALUATION
Assessment and Evaluation Assessment and evaluation are essential components of teaching and learning in mathematics. The basic principles of assessment and evaluation are as follows:
Effective assessment and evaluation are essential to improving student learning.
Effective assessment and evaluation are aligned with the curriculum outcomes.
A variety of tasks in an appropriate balance gives students multiple opportunities to demonstrate their knowledge and skills.
Effective evaluation requires multiple sources of assessment information to inform judgments and decisions about the quality of student learning.
Meaningful assessment data can demonstrate student understanding of mathematical ideas, student proficiency in mathematical procedures, and student beliefs and attitudes about mathematics.
Without effective assessment and evaluation it is impossible to know whether students have learned, or teaching has been effective, or how best to address student learning needs. The quality of the assessment and evaluation in the educational process has a profound and well-established link to student performance. Research consistently shows that regular monitoring and feedback are essential to improving student learning. What is assessed and evaluated, how it is assessed and evaluated, and how results are communicated send clear messages to students and others.
Assessment Assessment is the systematic process of gathering information on student learning. To determine how well students are learning, assessment strategies have to be designed to systematically gather information on the achievement of the curriculum outcomes. Teacher-developed assessments have a wide variety of uses, such as
providing feedback to improve student learning; determining if curriculum outcomes have been achieved; certifying that students have achieved certain levels of performance; setting goals for future student learning; communicating with parents about their children’s learning; providing information to teachers on the effectiveness of their teaching, the program, and the learning environment; meeting the needs of guidance and administration.
A broad assessment plan for mathematics ensures a balanced approach to summarizing and reporting. It should consider evidence from a variety of sources, including
formal and informal observations work samples anecdotal records conferences teacher-made and other tests
portfolios learning journals questioning performance assessment peer- and self-assessment.
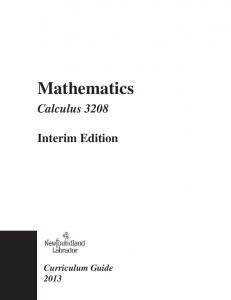
This balanced approach for assessing mathematics development is illustrated in the diagram on the next page.
PRINCE EDWARD ISLAND GRADE 9 MATHEMATICS CURRICULUM GUIDE
Page 13
ASSESSMENT AND EVALUATION
Work Samples math journals portfolios drawings, charts, tables, and graphs individual and classroom assessment pencil and paper tests
Surveys attitude interest parent questionnaires
Rubrics constructed response generic rubrics task-specific rubrics questioning
Assessing Mathematics Development in a Balanced Manner
Self-Assessment personal reflection/evaluation
Math Conferences individual group teacher-initiated child-initiated
Observations planned (formal) unplanned (informal) read aloud shared and guided math activities performance tasks individual conferences anecdotal records checklists interactive activities
There are three interrelated purposes for classroom assessment: assessment as learning, assessment for learning, and assessment of learning. Characteristics of each type of assessment are highlighted below. Assessment as learning is used
to engage students in their own learning and self-assessment; to help students understand what is important in the mathematical concepts and particular tasks they encounter; to develop effective habits of metacognition and self-coaching; to help students understand themselves as learners - how they learn as well as what they learn - and to provide strategies for reflecting on and adjusting their learning.
Assessment for learning is used
to gather and use ongoing information in relation to curriculum outcomes in order to adjust instruction and determine next steps for individual learners and groups; to identify students who are at risk, and to develop insight into particular needs in order to differentiate learning and provide the scaffolding needed; to provide feedback to students about how they are doing and how they might improve; to provide feedback to other professionals and to parents about how to support students’ learning.
PRINCE EDWARD ISLAND GRADE 9 MATHEMATICS CURRICULUM GUIDE
Page 14
ASSESSMENT AND EVALUATION
Assessment of learning is used
to determine the level of proficiency that a student has demonstrated in terms of the designated learning outcomes for a unit or group of units; to facilitate reporting; to provide the basis for sound decision-making about next steps in a student’s learning.
Evaluation Evaluation is the process of analysing, reflecting upon, and summarizing assessment information, and making judgments or decisions based upon the information gathered. Evaluation involves teachers and others in analysing and reflecting upon information about student learning gathered in a variety of ways. This process requires
developing clear criteria and guidelines for assigning marks or grades to student work; synthesizing information from multiple sources; weighing and balancing all available information; using a high level of professional judgment in making decisions based upon that information.
Reporting Reporting on student learning should focus on the extent to which students have achieved the curriculum outcomes. Reporting involves communicating the summary and interpretation of information about student learning to various audiences who require it. Teachers have a special responsibility to explain accurately what progress students have made in their learning and to respond to parent and student inquiries about learning. Narrative reports on progress and achievement can provide information on student learning which letter or number grades alone cannot. Such reports might, for example, suggest ways in which students can improve their learning and identify ways in which teachers and parents can best provide support. Effective communication with parents regarding their children’s progress is essential in fostering successful home-school partnerships. The report card is one means of reporting individual student progress. Other means include the use of conferences, notes, and phone calls.
Guiding Principles In order to provide accurate, useful information about the achievement and instructional needs of students, certain guiding principles for the development, administration, and use of assessments must be followed. The document Principles for Fair Student Assessment Practices for Education in Canada (1993) articulates five fundamental assessment principles, as follows:
Assessment methods should be appropriate for and compatible with the purpose and context of the assessment.
Students should be provided with sufficient opportunity to demonstrate the knowledge, skills, attitudes, or behaviours being assessed.
Procedures for judging or scoring student performance should be appropriate for the assessment method used and be consistently applied and monitored.
Procedures for summarizing and interpreting assessment results should yield accurate and informative representations of a student’s performance in relation to the curriculum outcomes for the reporting period.
Assessment reports should be clear, accurate, and of practical value to the audience for whom they are intended.
PRINCE EDWARD ISLAND GRADE 9 MATHEMATICS CURRICULUM GUIDE
Page 15
ASSESSMENT AND EVALUATION
These principles highlight the need for assessment which ensures that
the best interests of the student are paramount; assessment informs teaching and promotes learning; assessment is an integral and ongoing part of the learning process and is clearly related to the curriculum outcomes; assessment is fair and equitable to all students and involves multiple sources of information.
While assessments may be used for different purposes and audiences, all assessments must give each student optimal opportunity to demonstrate what he/she knows and can do.
PRINCE EDWARD ISLAND GRADE 9 MATHEMATICS CURRICULUM GUIDE
Page 16
STRUCTURE AND DESIGN OF THE CURRICULUM GUIDE
Structure and Design of the Curriculum Guide The learning outcomes in the Prince Edward Island mathematics curriculum are organized into four strands across the grades K-9. They are Number, Patterns and Relations, Shape and Space, and Statistics and Probability. These strands are further subdivided into sub-strands, which are the general curriculum outcomes (GCOs). They are overarching statements about what students are expected to learn in each strand or sub-strand from grades K-9. Strand
General Curriculum Outcome (GCO)
Number (N)
Number: Develop number sense.
Patterns and Relations (PR)
Patterns: Use patterns to describe the world and solve problems. Variables and Equations: Represent algebraic expressions in multiple ways. Measurement: Use direct and indirect measure to solve problems.
Shape and Space (SS)
3-D Objects and 2-D Shapes: Describe the characteristics of 3-D objects and 2-D shapes, and analyse the relationships among them. Transformations: Describe and analyse position and motion of objects and shapes. Data Analysis: Collect, display, and analyse data to solve problems.
Statistics and Probability (SP)
Chance and Uncertainty: Use experimental or theoretical probabilities to represent and solve problems involving uncertainty.
Each general curriculum outcome is then subdivided into a number of specific curriculum outcomes (SCOs). Specific curriculum outcomes are statements that identify the specific skills, understandings, and knowledge students are required to attain by the end of a given grade. Finally, each specific curriculum outcome has a list of achievement indicators that are used to determine whether students have met the corresponding specific outcome. In this curriculum guide, each specific curriculum outcome (SCO) is presented in a two-page format, and includes the following information:
its corresponding strand and general curriculum outcome; the scope and sequence of the specific curriculum outcome(s) from grades eight to ten (MAT421A) which correspond to this SCO; the specific curriculum outcome, with a list of achievement indicators; a list of the sections in MathLinks 9 which address the SCO, with specific achievement indicators highlighted in brackets; an elaboration for the SCO.
In the second half of this document, a curriculum guide supplement is presented which follows the primary resource, MathLinks 9.
PRINCE EDWARD ISLAND GRADE 9 MATHEMATICS CURRICULUM GUIDE
Page 17
SPECIFIC CURRICULUM OUTCOMES
NUMBER
PRINCE EDWARD ISLAND GRADE 9 MATHEMATICS CURRICULUM GUIDE
Page 18
SPECIFIC CURRICULUM OUTCOMES
SPECIFIC CURRICULUM OUTCOMES N1 – Demonstrate an understanding of powers with integral bases (excluding base 0) and whole number exponents by: representing repeated multiplication using powers; using patterns to show that a power with an exponent of zero is equal to one; solving problems involving powers. N2 – Demonstrate an understanding of operations on powers with integral bases (excluding base 0) and whole number exponents. N3 – Demonstrate an understanding of rational numbers by: comparing and ordering rational numbers; solving problems that involve arithmetic operations on rational numbers. N4 – Explain and apply the order of operations, including exponents, with and without technology. N5 – Determine the square root of positive rational numbers that are perfect squares. N6 – Determine an approximate square root of positive rational numbers that are nonperfect squares.
PRINCE EDWARD ISLAND GRADE 9 MATHEMATICS CURRICULUM GUIDE
Page 19
SPECIFIC CURRICULUM OUTCOMES
Grade 9 – Strand: Number (N) GCO:
Develop number sense. GRADE 9
GRADE 8
N1 Demonstrate an understanding of powers with integral bases (excluding base 0) and whole number exponents by: representing repeated multiplication using powers; using patterns to show that a power with an exponent of zero is equal to one; solving problems involving powers. SCO:
GRADE 10 – MAT421A AN3 Demonstrate an understanding of powers with integral and rational exponents.
N1 – Demonstrate an understanding of powers with integral bases (excluding base 0) and whole number exponents by: representing repeated multiplication using powers; using patterns to show that a power with an exponent of zero is equal to one; solving problems involving powers. [C, CN, PS, R] Students who have achieved this outcome should be able to: A.
Demonstrate the differences between the exponent and the base by building models of a given power, such as 23 and 32.
B.
Explain, using repeated multiplication, the difference between two given powers in which the exponent and base are interchanged, e.g., 103 and 310.
C.
Express a given power as a repeated multiplication.
D.
Express a given repeated multiplication as a power.
E.
Explain the role of parentheses in powers by evaluating a given set of powers, e.g., 2 , 4
2 4
F.
and 24.
Demonstrate, using patterns, that a 0 is equal to 1 for a given value of a (a 0).
G. Evaluate powers with integral bases (excluding base 0) and whole number exponents.
Section(s) in MathLinks 9 text that address the specific curriculum outcome with relevant Achievement Indicators in brackets: 3.1 (A B C D E G) 3.2 (C D E F G) 3.3 (D E G) 3.4 (A D)
[C] Communication [CN] Connections
[ME] Mental Mathematics and Estimation
[PS] Problem Solving [R] Reasoning
PRINCE EDWARD ISLAND GRADE 9 MATHEMATICS CURRICULUM GUIDE
[T] [V]
Technology Visualization
Page 20
SPECIFIC CURRICULUM OUTCOMES
SCO:
N1 – Demonstrate an understanding of powers with integral bases (excluding base 0) and whole number exponents by: representing repeated multiplication using powers; using patterns to show that a power with an exponent of zero is equal to one; solving problems involving powers. [C, CN, PS, R]
Elaboration
Students have had experience with perfect squares in relation to area in grade eight. The terms exponent, base, and power (an expression made up of an exponent and a base) are used differently in different resources. For example, the power 64 (where 6 is the base and 4 is the exponent), may be described as “six to the power of four”, “the fourth power of six”, or as “six raised to the power of four” in various textbooks. For consistency and understanding, teachers are asked to use “six to the exponent of four”, or “six to the fourth”. Students should be able to link the term squared with a 2-D area model and cubed with a 3-D volume model. This will help connect units for area and volume (e.g., square centimetres as cm2, cubic metres as m3) to measurement and geometry. It should be emphasized that sometimes the same number can be expressed in multiple ways using powers (e.g., 64 82 , 43 or 26 ). Students should be able to express 35 as 3 3 3 3 3 and 53 as 5 5 5. Students should also be able to explain the role of parentheses in powers by evaluating a given set of powers. For example:
2
4
2 2 2 2 16, where the base is –2
2 2 2 2 2 16, 4
where the base is 2
24 2 2 2 2 16, where the base is 2 Students should also be able to demonstrate that a 0 1, a 0, for a given value of a, using patterns.
PRINCE EDWARD ISLAND GRADE 9 MATHEMATICS CURRICULUM GUIDE
Page 21
SPECIFIC CURRICULUM OUTCOMES
Grade 9 – Strand: Number (N) GCO:
Develop number sense. GRADE 8
GRADE 9 N2 Demonstrate an understanding of operations on powers with integral bases (excluding base 0) and whole number exponents.
SCO:
GRADE 10 – MAT421A AN3 Demonstrate an understanding of powers with integral and rational exponents.
N2 – Demonstrate an understanding of operations on powers with integral bases (excluding base 0) and whole number exponents. [C, CN, PS, R, T]
Students who have achieved this outcome should be able to: A.
Explain, using examples, the exponent laws of powers with integral bases (excluding base 0) and whole number exponents:
a a a
a m a n a m n , m n;
a
ab
an a b b n , b 0.
m
n
m
mn
n
a mn ;
m
ambm ;
;
n
B.
Evaluate a given expression by applying the exponent laws.
C.
Determine the sum of two given powers, e.g., 52 53 , and record the process.
D.
Determine the difference of two given powers, e.g., 43 42 , and record the process.
E.
Identify the error(s) in a given simplification of an expression involving powers.
Section(s) in MathLinks 9 text that address the specific curriculum outcome with relevant Achievement Indicators in brackets: 3.2 (A B E) 3.3 (A B C D E) 3.4 (A B)
[C] Communication [CN] Connections
[ME] Mental Mathematics and Estimation
[PS] Problem Solving [R] Reasoning
PRINCE EDWARD ISLAND GRADE 9 MATHEMATICS CURRICULUM GUIDE
[T] [V]
Technology Visualization
Page 22
SPECIFIC CURRICULUM OUTCOMES
SCO:
N2 – Demonstrate an understanding of operations on powers with integral bases (excluding base 0) and whole number exponents. [C, CN, PS, R, T]
Elaboration
The primary focus at grade nine should be on the development of an understanding of the exponent laws of powers with integral bases (except base 0) and whole number exponents. Emphasis on attaching names to the laws should not be the focus of instruction. Rather, students’ understanding and ability to apply the laws is essential. Whenever possible, instruction should be designed so that students discover rules and relationships and are able to verify their discoveries. Otherwise, students may get the impression that the rules of mathematics are no more than “tricks.” At this level, practice should involve numerical bases only (extensions to literal bases will be addressed in grade ten). A clear understanding of the following exponent laws should be developed:
a a a m
n
mn
am an am n , m n
a m
ab
n
a mn
m
ambm
n
an a n,b0 b b
When questions involve the sum and difference of powers, the order of operations should be emphasized: e.g., 6 62 67. In the simplification of expressions involving powers, students should be able to identify and explain the 5
error(s): e.g., 23 25 or 53 5 4 512. Expressions should be simplified as far as possible before they are 2
evaluated, and before calculators are used.
PRINCE EDWARD ISLAND GRADE 9 MATHEMATICS CURRICULUM GUIDE
Page 23
SPECIFIC CURRICULUM OUTCOMES
Grade 9 – Strand: Number (N) GCO:
Develop number sense. GRADE 8
GRADE 9
GRADE 10 – MAT421A
N4 Demonstrate an understanding of ratio and rate.
N3 Demonstrate an understanding of rational numbers by:
N5 Solve problems that involve rates, ratios and proportional reasoning.
comparing and ordering rational numbers; solving problems that involve arithmetic operations on rational numbers.
AN2 Demonstrate an understanding of irrational numbers by:
N6 Demonstrate an understanding of multiplying and dividing positive fractions and mixed numbers, concretely, pictorially and symbolically.
representing, identifying and simplifying irrational numbers; ordering irrational numbers.
N7 Demonstrate an understanding of multiplication and division of integers, concretely, pictorially and symbolically. SCO:
N3 – Demonstrate an understanding of rational numbers by: comparing and ordering rational numbers; solving problems that involve arithmetic operations on rational numbers. [C, CN, PS, R, T, V]
Students who have achieved this outcome should be able to: A.
Order a given set of rational numbers, in fraction and decimal form, by placing them on a 3 5 number line, e.g., , –0.666…, 0.5, . 5 8
B.
Identify a rational number that is between two given rational numbers.
C.
Solve a given problem involving operations on rational numbers in fraction form and decimal form.
Section(s) in MathLinks 9 text that address the specific curriculum outcome with relevant Achievement Indicators in brackets: 2.1 (A B) 2.2 (C) 2.3 (C) 2.4 (C)
[C] Communication [CN] Connections
[ME] Mental Mathematics and Estimation
[PS] Problem Solving [R] Reasoning
PRINCE EDWARD ISLAND GRADE 9 MATHEMATICS CURRICULUM GUIDE
[T] [V]
Technology Visualization
Page 24
SPECIFIC CURRICULUM OUTCOMES
SCO:
N3 – Demonstrate an understanding of rational numbers by: comparing and ordering rational numbers; solving problems that involve arithmetic operations on rational numbers. [C, CN, PS, R, T, V]
Elaboration
a , where b is never b zero. Students have experience with ratios, integers, positive decimals and fraction operations in grades seven and eight. Negative fraction operations will be introduced in grade nine. A review of integer operations will be necessary. The placement of a negative sign in a fraction will be an extension of what students have learned in the past. It is 6 6 6 important for students to understand that and are all equivalent fractions. This becomes apparent , 2 2 2 when the division is completed and all fractions equal –3, regardless of where the negative sign is placed.
A rational number is any number that can be written as a fraction or a ratio of two integers,
Comparing and ordering rational numbers largely draws upon students’ number sense. Strategies for ordering numbers should include the following:
understanding that a negative number is always less than a positive number;
developing a number line with zero, marking the switch from positive to negative numbers, and with positioning of positive and negative benchmark fractions without conversion to decimals;
–1
1 2
0
1 4
1 2
1
comparing fractions with the same denominator, with unlike denominators, and with the same numerator; students should develop a variety of strategies to compare fractions in addition to creating equivalent denominators;
identifying fractions between any two given fractions, or decimals between any two decimals, such 1 1 1 1 as between each of the following pairs of numbers: 0.3 and 0.4, and , and . 2 3 3 2
Mental math and estimation should be used when solving these problems. In this context, calculators could be used as a means of verifying answers.
PRINCE EDWARD ISLAND GRADE 9 MATHEMATICS CURRICULUM GUIDE
Page 25
SPECIFIC CURRICULUM OUTCOMES
Grade 9 – Strand: Number (N) GCO:
Develop number sense. GRADE 8
GRADE 9
GRADE 10 – MAT421A
N4 Explain and apply the order of operations, including exponents, with and without technology. SCO:
N4 – Explain and apply the order of operations, including exponents, with and without technology. [PS, T]
Students who have achieved this outcome should be able to: A.
Solve a given problem by applying the order of operations without the use of technology.
B.
Solve a given problem by applying the order of operations with the use of technology.
C.
Identify the error in applying the order of operations in a given incorrect solution.
Section(s) in MathLinks 9 text that address the specific curriculum outcome with relevant Achievement Indicators in brackets: 3.3 (A B C) 3.4 (A B)
[C] Communication [CN] Connections
[ME] Mental Mathematics and Estimation
[PS] Problem Solving [R] Reasoning
PRINCE EDWARD ISLAND GRADE 9 MATHEMATICS CURRICULUM GUIDE
[T] [V]
Technology Visualization
Page 26
SPECIFIC CURRICULUM OUTCOMES
SCO:
N4 – Explain and apply the order of operations, including exponents, with and without technology. [PS, T]
Elaboration
The first time order of operations was taught as a specific outcome was in grade six. However, this is practised in grades seven and eight when solving problems involving a variety of operations with integers, positive decimals and fractions. In grade nine, they will extend the rules of order of operations to exponents and to negative rational numbers. The order of operations is: 1.
Brackets
2.
Exponents
3.
Divide and Multiply, in order from left to right
4.
Add and Subtract, in order from left to right
The acronym BEDMAS is often used to help students remember the order of operations. It is important for students to demonstrate their understanding of these rules, with and without the use of calculators. Student should demonstrate a competence in evaluating expressions that include fractions, fractions squared or cubed, decimals, and negative integers. Calculators can be used as a tool to check work, in order to gain an understanding of the correct sequence of keys for each student’s personal calculator. However the same sequence may be interpreted differently by another calculator. An exploration of this variation could offer an opportunity to develop a better understanding of the correct order of operations. It is important for students to know how their personal calculators process the input and that they are able to apply this knowledge to new situations. As an example, students can enter the expression 2 3 4 into their calculators. If a particular calculator gives an answer of 14, then it correctly applies the order of operations. However, if it gives an answer of 20, that student will know that his or her calculator does not apply the correct order of operations. In that case, ensure that students have checked their calculators for the proper keying sequence that models the correct order of operations. Some calculators will require additional bracketing to produce the correct answer. As an indication of understanding, students should be given steps towards an incorrect solution to a problem and be able to identify the step at which the error occurred.
PRINCE EDWARD ISLAND GRADE 9 MATHEMATICS CURRICULUM GUIDE
Page 27
SPECIFIC CURRICULUM OUTCOMES
Grade 9 – Strand: Number (N) GCO:
Develop number sense. GRADE 8
GRADE 9
N1 Demonstrate an understanding of perfect square and square root, concretely, pictorially and symbolically (limited to whole numbers).
N5 Determine the square root of positive rational numbers that are perfect squares.
N2 Determine the approximate square root of numbers that are not perfect squares (limited to whole numbers). SCO:
GRADE 10 – MAT421A AN1 Demonstrate an understanding of factors of whole numbers by determining the: prime factors; greatest common factor; least common multiple; square root; cube root.
N5 – Determine the square root of positive rational numbers that are perfect squares. [C, CN, PS, R, T]
Students who have achieved this outcome should be able to: A.
Determine whether or not a given rational number is a square number and explain the reasoning.
B.
Determine the square root of a given positive rational number that is a perfect square.
C.
Identify the error made in a given calculation of a square root, e.g., Is 3.2 the square root of 6.4?
D.
Determine a positive rational number given the square root of that positive rational number.
Section(s) in MathLinks 9 text that address the specific curriculum outcome with relevant Achievement Indicators in brackets: 2.4 (A B C D)
[C] Communication [CN] Connections
[ME] Mental Mathematics and Estimation
[PS] Problem Solving [R] Reasoning
PRINCE EDWARD ISLAND GRADE 9 MATHEMATICS CURRICULUM GUIDE
[T] [V]
Technology Visualization
Page 28
SPECIFIC CURRICULUM OUTCOMES
SCO:
N5 – Determine the square root of positive rational numbers that are perfect squares. [C, CN, PS, R, T]
Elaboration
Students in grade eight were exposed to square roots of whole numbers up to 144, including both perfect squares and non-perfect squares. They would have seen various models of perfect squares, such as square shapes drawn on grid paper or constructed with color tiles. They would have found square roots of perfect squares by prime factorization, mental computation, estimation and using the calculator. These strategies should be revisited accompanied by a discussion about when to use which strategy. In grade nine, the study of square roots is extended to finding the square root of positive rational numbers that are perfect squares, including whole numbers, fractions and decimals. Mathematicians use the symbol represent only positive roots, so the solution to
to
25 is 5, which is called the principal square root. However, when
solving an equation such as x 2 4, there are two solutions, +2 and –2, since both solutions satisfy the equation:
x2 4 x 4
x 2
Students should learn whole number perfect squares to 400 and be able to determine perfect squares beyond 400 through guess and test, using estimation strategies and/or prime factorization. For example, if a student knows that
144 12, and that
400 20, they could estimate that
256 lies somewhere between 12 and 20.
Fraction and decimal square roots will all be variations of whole number perfect squares. For example, students 36 , 25 squares, but 2.5 is not.
will be asked to find
0.25 and
1.44. Students should also be able to explain why 25 and 0.25 are perfect
Students should be able to determine a number given its square root. For example, if the square root of a number is 0.7, the number is 0.49. This relates to the fact that squares and square roots are inverse operations, a concept which should be explored. If a student finds the square root of a number and then squares it, he or she will end up where they started.
PRINCE EDWARD ISLAND GRADE 9 MATHEMATICS CURRICULUM GUIDE
Page 29
SPECIFIC CURRICULUM OUTCOMES
Grade 9 – Strand: Number (N) GCO:
Develop number sense. GRADE 8
GRADE 9
N1 Demonstrate an understanding of perfect square and square root, concretely, pictorially and symbolically (limited to whole numbers).
N6 Determine an approximate square root of positive rational numbers that are non-perfect squares.
N2 Determine the approximate square root of numbers that are not perfect squares (limited to whole numbers). SCO:
GRADE 10 – MAT421A AN1 Demonstrate an understanding of factors of whole numbers by determining the: prime factors; greatest common factor; least common multiple; square root; cube root.
N6 – Determine an approximate square root of positive rational numbers that are non-perfect squares. [C, CN, PS, R, T]
Students who have achieved this outcome should be able to: A.
Estimate the square root of a given rational number that is not a perfect square using the roots of perfect squares as benchmarks.
B.
Determine an approximate square root of a given rational number that is not a perfect square using technology, e.g., calculator, computer.
C.
Explain why the square root of a given rational number as shown on a calculator may be an approximation.
D.
Identify a number with a square root that is between two given numbers.
Section(s) in MathLinks 9 text that address the specific curriculum outcome with relevant Achievement Indicators in brackets: 2.4 (A B C D)
[C] Communication [CN] Connections
[ME] Mental Mathematics and Estimation
[PS] Problem Solving [R] Reasoning
PRINCE EDWARD ISLAND GRADE 9 MATHEMATICS CURRICULUM GUIDE
[T] [V]
Technology Visualization
Page 30
SPECIFIC CURRICULUM OUTCOMES
SCO:
N6 – Determine an approximate square root of positive rational numbers that are non-perfect squares. [C, CN, PS, R, T]
Elaboration
Students approximated the square root of non-perfect squares up to 144 in grade eight. They used the perfect square benchmarks to enable them to state between which two whole numbers the square root of a given number fell. For example,
27 lies between 5 and 6. They then were able to state that the square root was closer to 5,
because 27 is closer to 25 than to 36. Reference may have been made to the fact that the square root of non-perfect squares always result in non-terminating, non-repeating decimals which are irrational numbers, that is, a numbers that cannot be expressed in form . Calculators may have been used to see the decimal approximations, b which remain an approximation no matter how many decimals are retained in an irrational number. In grade nine, students will be required to estimate the square root of rational numbers in fraction and decimal form. Again, they will be using benchmark perfect squares to help with their estimates using various strategies. For example, 0.79 is approximately equal to 0.81, which is equal to 0.9, so understand that the answer is a little less than 0.9.
0.79 0.9. Students should also
Fractions can be addressed in a similar manner in a couple of different ways. For example,
8 is 15
9 3 8 3 , which is equal to , so . Another approach that could be used uses the fact 16 15 4 4 8 1 is a little more than , which equals 0.5. Since 0.5 is approximately equal to 0.49, which is equal to that 15 2 approximately equal to
0.7, then
8 0.7. 15
Please note that and may be both used to symbolize “approximately equal to.”
PRINCE EDWARD ISLAND GRADE 9 MATHEMATICS CURRICULUM GUIDE
Page 31
SPECIFIC CURRICULUM OUTCOMES
PATTERNS AND RELATIONS
PRINCE EDWARD ISLAND GRADE 9 MATHEMATICS CURRICULUM GUIDE
Page 32
SPECIFIC CURRICULUM OUTCOMES
SPECIFIC CURRICULUM OUTCOMES PR1 – Generalize a pattern arising from a problem-solving context using linear equations and verify by substitution. PR2 – Graph linear relations, analyse the graph and interpolate or extrapolate to solve problems. PR3 – Model and solve problems using linear equations of the form: x ax b; b, a 0; a x ax b cx ; b c , a 0; a
ax b cx d ;
a bx c d ex f ;
ax b c; a x b c;
a b, x 0 x
where a, b, c, d, e and f are rational numbers. PR4 – Explain and illustrate strategies to solve single variable linear inequalities with rational coefficients within a problem-solving context. PR5 – Demonstrate an understanding of polynomials (limited to polynomials of degree less than or equal to 2). PR6 – Model, record and explain the operations of addition and subtraction of polynomial expressions, concretely, pictorially and symbolically (limited to polynomials of degree less than or equal to 2). PR7 – Model, record and explain the operations of multiplication and division of polynomial expressions (limited to polynomials of degree less than or equal to 2) by monomials, concretely, pictorially and symbolically.
PRINCE EDWARD ISLAND GRADE 9 MATHEMATICS CURRICULUM GUIDE
Page 33
SPECIFIC CURRICULUM OUTCOMES
Grade 9 – Strand: Patterns and Relations (PR) GCO:
Use patterns to describe the world and solve problems.
GRADE 8
GRADE 9
PR1 Graph and analyse twovariable linear relations.
SCO:
GRADE 10 – MAT421A
PR1 Generalize a pattern arising from a problem-solving context using linear equations and verify by substitution.
PR1 – Generalize a pattern arising from a problem-solving context using linear equations and verify by substitution. [C, CN, PS, R, V]
Students who have achieved this outcome should be able to: A.
Write an expression representing a given pictorial, oral or written pattern.
B. Write a linear equation to represent a given context. C. Describe a context for a given linear equation. D. Solve, using a linear equation, a given problem that involves pictorial, oral and written linear patterns. E.
Write a linear equation representing the pattern in a given table of values and verify the equation by substituting values from the table.
Section(s) in MathLinks 9 text that address the specific curriculum outcome with relevant Achievement Indicators in brackets: 6.1 (A B C D E)
[C] Communication [CN] Connections
[ME] Mental Mathematics and Estimation
[PS] Problem Solving [R] Reasoning
PRINCE EDWARD ISLAND GRADE 9 MATHEMATICS CURRICULUM GUIDE
[T] [V]
Technology Visualization
Page 34
SPECIFIC CURRICULUM OUTCOMES
SCO:
PR1 – Generalize a pattern arising from a problem-solving context using linear equations and verify by substitution. [C, CN, PS, R, V]
Elaboration Students have been exposed to patterns through the interpretation of graphs of linear relations. From a pictorial pattern, students should be able to identify and write the pattern rule and create a table of values in order to write an expression to represent the situation. When an oral or written pattern is given, students should be able to write an expression directly from that pattern. Linear expressions have both a variable value and a constant value. This connection is seen in situations involving membership fees, where there is an initial fee (constant value) and a usage fee (variable value). It is important to make a clear distinction between the two. It is also necessary to describe a context represented by a given linear equation. When students are looking at a table of values, such as the following,
Term Number (n)
1
2
3
4
5
Term (t)
2
8
14
20
26
they should look at the pattern and recognize a constant increase or decrease (here an increase of 6) between the values. Students should recognize that multiplying the term number, n, by 6 always results in four more than the associated term, t. Therefore, they will need to subtract 4 from 6n. As an equation, the pattern is represented by t 6n 4. Students should verify their equation by substituting values from the table (for example, n 5, t 26). Students should use their equation to solve for any value of n or t.
PRINCE EDWARD ISLAND GRADE 9 MATHEMATICS CURRICULUM GUIDE
Page 35
SPECIFIC CURRICULUM OUTCOMES
Grade 9 – Strand: Patterns and Relations (PR) GCO:
Use patterns to describe the world and solve problems.
GRADE 8 PR1 Graph and analyse twovariable linear relations.
GRADE 9
GRADE 10 – MAT421A
PR2 Graph linear relations, analyse the graph and interpolate or extrapolate to solve problems.
RF3 Demonstrate an understanding of slope with respect to: rise and run; line segments and lines; rate of change; parallel lines; perpendicular lines. RF4 Describe and represent linear relations, using: words; ordered pairs; tables of values; graphs; equations. RF5 Determine the characteristics of the graphs of linear relations, including the: intercepts; slope; domain; range. RF8 Represent a linear function using function notation.
SCO:
PR2 – Graph linear relations, analyse the graph and interpolate or extrapolate to solve problems. [C, CN, PS, R, T, V]
Students who have achieved this outcome should be able to: A.
Describe the pattern found in a given graph.
B. Graph a given linear relation, including horizontal and vertical lines. C. Match given equations of linear relations with their corresponding graphs. D. Extend a given graph (extrapolate) to determine the value of an unknown element. E.
Interpolate the approximate value of one variable on a given graph given the value of the other variable.
F.
Extrapolate the approximate value of one variable from a given graph given the value of the other variable.
G. Solve a given problem by graphing a linear relation and analysing the graph.
Section(s) in MathLinks 9 text that address the specific curriculum outcome with relevant Achievement Indicators in brackets: 6.2 (B D E F) 6.3 (A C D E G)
[C] Communication [CN] Connections
[ME] Mental Mathematics and Estimation
[PS] Problem Solving [R] Reasoning
PRINCE EDWARD ISLAND GRADE 9 MATHEMATICS CURRICULUM GUIDE
[T] [V]
Technology Visualization
Page 36
SPECIFIC CURRICULUM OUTCOMES
SCO:
PR2 – Graph linear relations, analyse the graph and interpolate or extrapolate to solve problems. [C, CN, PS, R, T, V]
Elaboration Students will be asked to describe patterns from graphs. They will be expected to use terminology such as increase and decrease to describe the relationship between the two variables. Students have had experience with this concept in grades seven and eight, and this concept will be extended to include vertical and horizontal lines in grade nine. Vertical and horizontal lines can be represented by linear equations that involve only one variable. This concept may be difficult for students to grasp at first, therefore multiple opportunities to explore this concept must be provided. In this case, students will realize that as one variable changes, the other stays constant. This will be an indication that the graph will be a horizontal or vertical line. In previous grades, students have been exposed to discrete data only. Now, situations may include either discrete or continuous data. Discrete data can only have a finite or limited number of possible values. Generally discrete data are counts: number of students in class, number of tickets sold, or how many Christmas trees were purchased. A graph of discrete data has plotted points, but they are not joined together. Continuous data can have an infinite number of possible values within a selected range, as seen in measurements of temperature or time. Students will be asked to interpolate and extrapolate graphs in order to solve problems. Interpolation consists of estimating a value between two given values, while extrapolation consists of estimating a value beyond a given set of values. In order to extrapolate, students must extend the pattern beyond the given data. When students are interpolating and extrapolating with discrete data, the points are not to be joined when extending the pattern. The intent of this outcome is to explore the patterns and represent them by linear equations with the use of graphs and tables only. This will create the foundation for rate of change (slope) and the intercept-slope form of a linear equation, y mx b, which will be explored in later grades.
PRINCE EDWARD ISLAND GRADE 9 MATHEMATICS CURRICULUM GUIDE
Page 37
SPECIFIC CURRICULUM OUTCOMES
Grade 9 – Strand: Patterns and Relations (PR) GCO:
Represent algebraic expressions in multiple ways.
GRADE 8
GRADE 9
PR2 Model and solve problems using linear equations of the form: ax b;
PR3 Model and solve problems using linear equations of the form: ax b;
x b, a 0; a ax b c;
x b, a 0; a ax b c;
x b c, a 0; a
GRADE 10 – MAT421A RF9 Solve problems that involve systems of linear equations in two variables, graphically and algebraically.
x b c, a 0; a ax b cx;
a x b c concretely, pictorially and symbolically, where a, b and c are integers.
a x b c; ax b cx d ; a bx c d ex f ; a b, x 0 x where a, b, c, d, e and f are rational numbers.
SCO:
PR3 – Model and solve problems using linear equations of the form: x ax b; b, a 0; a x ax b cx ; b c , a 0; a ax b cx d ;
a bx c d ex f ;
ax b c; a x b c;
a b, x 0 x
where a, b, c, d, e and f are rational numbers. [C, CN, PS, V] Students who have achieved this outcome should be able to:
A.
Model the solution of a given linear equation using concrete or pictorial representations, and record the process.
B. Determine, by substitution, whether a given rational number is a solution to a given linear equation. C. Solve a given linear equation symbolically. D. Identify and correct an error in a given incorrect solution of a linear equation. E.
Represent a given problem using a linear equation.
F.
Solve a given problem using a linear equation and record the process.
Section(s) in MathLinks 9 text that address the specific curriculum outcome with relevant Achievement Indicators in brackets:
8.1 (A B C E F) 8.2 (A B C D E F) 8.3 (A B C D E F) 8.4 (A B C D E F)
[C] Communication [CN] Connections
[ME] Mental Mathematics and Estimation
[PS] Problem Solving [R] Reasoning
PRINCE EDWARD ISLAND GRADE 9 MATHEMATICS CURRICULUM GUIDE
[T] [V]
Technology Visualization
Page 38
SPECIFIC CURRICULUM OUTCOMES
SCO:
PR3 – Model and solve problems using linear equations of the form: x ax b; b, a 0; a x ax b cx ; b c , a 0; a a bx c d ex f ;
ax b cx d ;
where a, b, c, d, e and f are rational numbers. [C, CN, PS, V]
ax b c; a x b c;
a b, x 0 x
Elaboration In grade eight, students have experience solving one and two-step equations in the following forms: ax b;
x b, a 0; a
ax b c;
x b c, a 0; a
a x b c.
A review of the various informal methods used to solve equations developed in grades seven and eight may be necessary. These could include the use of algebra tiles, inspection, or systematic trials (guess and test). In grade nine, students will continue to solve equations which include integers and rational numbers, when the variable is found on both sides of the equal sign or found in the denominator, and when more than two steps are required to solve the equation. In problem-solving situations, students should be aware that once they acquire a solution, it can be checked to see if it is correct by substitution into the original equation. Proper use of vocabulary should be modelled. The following terms should be used where appropriate: relationship, equality, algebraic equation, distributive property, like terms, balancing, the zero principle, the elimination process, isolating variables, coefficient, constant, equation and expression. In this way, students will become more comfortable with the mathematical vocabulary and not find it so intimidating or confusing. Students should be able to model how the solution of a given linear equation is determined using concrete or pictorial representations. After adequate practice and understanding, students should be able to transfer the model to pencil and paper.
PRINCE EDWARD ISLAND GRADE 9 MATHEMATICS CURRICULUM GUIDE
Page 39
SPECIFIC CURRICULUM OUTCOMES
Grade 9 – Strand: Patterns and Relations (PR) GCO:
Represent algebraic expressions in multiple ways.
GRADE 8
GRADE 9
GRADE 10 – MAT421A
PR4 Explain and illustrate strategies to solve single variable linear inequalities with rational coefficients within a problem-solving context. SCO:
PR4 – Explain and illustrate strategies to solve single variable linear inequalities with rational coefficients within a problem-solving context. [C, CN, PS, R, V] Students who have achieved this outcome should be able to:
A.
Translate a given problem into a single variable linear inequality using the symbols , , or .
B. Determine if a given rational number is a possible solution of a given linear inequality. C. Generalize and apply a rule for adding or subtracting a positive or negative number to determine the solution of a given inequality. D. Generalize and apply a rule for multiplying or dividing by a positive or negative number to determine the solution of a given inequality. E.
Solve a given linear inequality algebraically and explain the process orally or in written form.
F.
Compare and explain the process for solving a given linear equation to the process for solving a given linear inequality.
G. Graph the solution of a given linear inequality on a number line. H. Compare and explain the solution of a given linear equation to the solution of a given linear inequality. I.
Verify the solution of a given linear inequality using substitution for multiple elements in the solution.
J.
Solve a given problem involving a single variable linear inequality and graph the solution.
Section(s) in MathLinks 9 text that address the specific curriculum outcome with relevant Achievement Indicators in brackets:
9.1 (A B G) 9.2 (A B C D E F G H J) 9.3 (A E I J)
[C] Communication [CN] Connections
[ME] Mental Mathematics and Estimation
[PS] Problem Solving [R] Reasoning
PRINCE EDWARD ISLAND GRADE 9 MATHEMATICS CURRICULUM GUIDE
[T] [V]
Technology Visualization
Page 40
SPECIFIC CURRICULUM OUTCOMES
SCO:
PR4 – Explain and illustrate strategies to solve single variable linear inequalities with rational coefficients within a problem-solving context. [C, CN, PS, R, V]
Elaboration Solving inequalities is a new concept in grade nine. Students will be working with linear inequalities at this point. An inequality is defined as a mathematical sentence that compares two expressions that may or may not be equal. Students need to realize that this type of problem may have many solutions rather than just one as with most linear equations. Students will build on their previous knowledge of solving linear equations and expand to inequalities where the operation rules are the same, with the exception of multiplying or dividing both sides of the inequality by a negative number. This will result in the inequality sign changing orientation. Emphasis should be placed on having students graph their solutions on a number line to understand clearly what the answer represents, that is, a set of values instead of a single solution. These solutions can be represented pictorially as a set of values on a number line. Where possible, an effort should be made to have students describe a problem or situation as an inequality. These then can be solved and represented on a number line. Many of these problems are real life situations. This is a good opportunity for teachers to discuss with students that there may or may not be limits on these inequalities that are created, depending on the context of the problem. For example, if you are discussing the speed of a vehicle, this will not be negative, so instead of saying v 10, we would have to understand that we mean 0 v 10.
PRINCE EDWARD ISLAND GRADE 9 MATHEMATICS CURRICULUM GUIDE
Page 41
SPECIFIC CURRICULUM OUTCOMES
Grade 9 – Strand: Patterns and Relations (PR) GCO:
Represent algebraic expressions in multiple ways.
GRADE 8
GRADE 9
GRADE 10 – MAT421A
PR5 Demonstrate an understanding of polynomials (limited to polynomials of degree less than or equal to 2). SCO:
PR5 – Demonstrate an understanding of polynomials (limited to polynomials of degree less than or equal to 2). [C, CN, R, V] Students who have achieved this outcome should be able to:
A.
Create a concrete model or a pictorial representation for a given polynomial expression.
B. Write the expression for a given model of a polynomial. C. Identify the variables, degree, number of terms and coefficients, including the constant term, of a given simplified polynomial expression. D. Describe a situation for a given first degree polynomial expression. E.
Match equivalent polynomial expressions given in simplified form, e.g., 4 x 3 x 2 2 is equivalent to 3 x 2 4 x 2.
Section(s) in MathLinks 9 text that address the specific curriculum outcome with relevant Achievement Indicators in brackets:
5.1 (A B C D E)
[C] Communication [CN] Connections
[ME] Mental Mathematics and Estimation
[PS] Problem Solving [R] Reasoning
PRINCE EDWARD ISLAND GRADE 9 MATHEMATICS CURRICULUM GUIDE
[T] [V]
Technology Visualization
Page 42
SPECIFIC CURRICULUM OUTCOMES
SCO:
PR5 – Demonstrate an understanding of polynomials (limited to polynomials of degree less than or equal to 2). [C, CN, R, V]
Elaboration There is a significant amount of new vocabulary introduced in this section:
A term is an expression formed from the product of numbers and/or variables, for example, 2, 3 x 2 and 4x are all terms.
A constant term is a term that does not have a variable factor.
A coefficient is the number by which the variable is multiplied.
A polynomial is an algebraic expression made up of terms connected by the operations of addition or subtraction.
The degree of a term is the sum of the exponents on the variables in a single term. For example, the degree of 4 xy 2 is 3. A variable with no exponent showing is understood to have an exponent of one.
The degree of a polynomial is the highest degree of any term in a polynomial.
All expressions with one or more terms are called polynomials. Some polynomials are named by the number of terms they contain, for example monomial (one term), binomial (two terms) and trinomial (three terms).
A review of the models used for linear equations in grade eight could be done here. Students should be familiar with the use of algebra tiles for modelling linear situations from previous grades. The introduction of a tile for x 2 will be needed so that students can represent second degree polynomials. Students should be comfortable at this stage changing from models and pictorial representations to polynomial expressions, and polynomial expressions back to models and pictorial representation. Rearranging polynomial expressions to show that some expressions are equivalent should also be included.
PRINCE EDWARD ISLAND GRADE 9 MATHEMATICS CURRICULUM GUIDE
Page 43
SPECIFIC CURRICULUM OUTCOMES
Grade 9 – Strand: Patterns and Relations (PR) GCO:
Represent algebraic expressions in multiple ways.
GRADE 8
GRADE 9
GRADE 10 – MAT421A
PR6 Model, record and explain the operations of addition and subtraction of polynomial expressions, concretely, pictorially and symbolically (limited to polynomials of degree less than or equal to 2). SCO:
PR6 – Model, record and explain the operations of addition and subtraction of polynomial expressions, concretely, pictorially and symbolically (limited to polynomials of degree less than or equal to 2). [C, CN, PS, R, V] Students who have achieved this outcome should be able to:
A.
Model addition of two given polynomial expressions concretely or pictorially and record the process symbolically.
B. Model subtraction of two given polynomial expressions concretely or pictorially and record the process symbolically. C. Apply a personal strategy for addition and subtraction of given polynomial expressions, and record the process symbolically. D. Identify equivalent polynomial expressions from a given set of polynomial expressions, including pictorial and symbolic representations. E.
Identify the error(s) in a given simplification of a given polynomial expression.
Section(s) in MathLinks 9 text that address the specific curriculum outcome with relevant Achievement Indicators in brackets:
5.2 (C D E) 5.3 (A B C)
[C] Communication [CN] Connections
[ME] Mental Mathematics and Estimation
[PS] Problem Solving [R] Reasoning
PRINCE EDWARD ISLAND GRADE 9 MATHEMATICS CURRICULUM GUIDE
[T] [V]
Technology Visualization
Page 44
SPECIFIC CURRICULUM OUTCOMES
SCO:
PR6 – Model, record and explain the operations of addition and subtraction of polynomial expressions, concretely, pictorially and symbolically (limited to polynomials of degree less than or equal to 2). [C, CN, PS, R, V]
Elaboration Students were exposed to the notion of a variable in grade five, as algebraic reasoning is a focus of the revised curriculum. As part of the continued development of algebra, students should be given a variety of ways to relate to the symbolism. One connection which may be useful to students relates to measurement situations. For example, can we add 3m 5m 2 and get 8 of something? Students should realize that the units must be the same in order to add or subtract them. This should enable them to more easily transfer to the concept of like and unlike terms. The use of algebra tiles as models will strengthen this transfer as students visualize the difference between x and x 2 or between x and 1. Students have also worked with integers and modeled operations with two colour counters, so they have experience with the idea of positive and negative numbers and the zero principle. But first, time should be spent on modeling and identifying like and unlike terms before the addition and subtraction of polynomials is introduced. It is important that when the addition and subtraction of polynomial expressions are modeled that students record the expressions symbolically at the same time. As an example, given the expression:
2x
2
3 x 1 x 2 2x 2
Combine like terms:
2x
2
x 2 3 x 2 x 1 2
Remove zeros: x2 x 3
It is important that students move from the concrete to the pictorial to the symbolic, but initially, either the concrete and symbolic, or the pictorial and symbolic should be done in tandem.
PRINCE EDWARD ISLAND GRADE 9 MATHEMATICS CURRICULUM GUIDE
Page 45
SPECIFIC CURRICULUM OUTCOMES
Grade 9 – Strand: Patterns and Relations (PR) GCO:
Represent algebraic expressions in multiple ways.
GRADE 8
SCO:
GRADE 9
GRADE 10 – MAT421A
PR7 Model, record and explain the operations of multiplication and division of polynomial expressions (limited to polynomials of degree less than or equal to 2) by monomials, concretely, pictorially and symbolically.
AN4 Demonstrate an understanding of the multiplication of polynomial expressions (limited to monomials, binomials and trinomials), concretely, pictorially and symbolically. AN5 Demonstrate an understanding of common factors and trinomial factoring, concretely, pictorially and symbolically.
PR7 – Model, record and explain the operations of multiplication and division of polynomial expressions (limited to polynomials of degree less than or equal to 2) by monomials, concretely, pictorially and symbolically. [C, CN, R, V] Students who have achieved this outcome should be able to:
A.
Model multiplication of a given polynomial expression by a given monomial concretely or pictorially and record the process symbolically.
B. Model division of a given polynomial expression by a given monomial concretely or pictorially and record the process symbolically. C. Apply a personal strategy for multiplication and division of a given polynomial expression by a given monomial. D. Provide examples of equivalent polynomial expressions. E.
Identify the error(s) in a given simplification of a given polynomial expression.
Section(s) in MathLinks 9 text that address the specific curriculum outcome with relevant Achievement Indicators in brackets:
7.1 (A B C D E) 7.2 (A C D E) 7.3 (B C D E)
[C] Communication [CN] Connections
[ME] Mental Mathematics and Estimation
[PS] Problem Solving [R] Reasoning
PRINCE EDWARD ISLAND GRADE 9 MATHEMATICS CURRICULUM GUIDE
[T] [V]
Technology Visualization
Page 46
SPECIFIC CURRICULUM OUTCOMES
SCO:
PR7 – Model, record and explain the operations of multiplication and division of polynomial expressions (limited to polynomials of degree less than or equal to 2) by monomials, concretely, pictorially and symbolically. [C, CN, R, V]
Elaboration This outcome, dealing with the multiplication and division of polynomial expressions, is restricted to expressions of no greater than second degree, to allow for the effective modeling of both operations. In other words, no part of any expression can have an exponent greater than two. The focus is on developing a deep understanding of the operations. Students should first explore multiplication and division of a monomial by a monomial, extend to multiplication and division of a polynomial by a number, and then move to multiplication and division of a polynomial by a monomial. The area model is a powerful model for students to use. They have had experience with the area model in numerical situations, such as modeling one-digit and two-digit whole number multiplication as well as multiplication with fractions. Base ten materials have typically been used for these models so the transfer to algebra tiles should be smooth. For example, this area model could be used to show 10 12, or 10 10 2 , as well as x x 2 or the related division of
x 2 2x . x
PRINCE EDWARD ISLAND GRADE 9 MATHEMATICS CURRICULUM GUIDE
Page 47
SPECIFIC CURRICULUM OUTCOMES
SHAPE AND SPACE
PRINCE EDWARD ISLAND GRADE 9 MATHEMATICS CURRICULUM GUIDE
Page 48
SPECIFIC CURRICULUM OUTCOMES
SPECIFIC CURRICULUM OUTCOMES SS1 – Solve problems and justify the solution strategy using circle properties including: the perpendicular from the centre of a circle to a chord bisects the chord; the measure of the central angle is equal to twice the measure of the inscribed angle subtended by the same arc; the inscribed angles subtended by the same arc are congruent; a tangent to a circle is perpendicular to the radius at the point of tangency. SS2 – Determine the surface area of composite 3-D objects to solve problems. SS3 – Demonstrate an understanding of similarity of polygons. SS4 – Draw and interpret scale diagrams of 2-D shapes. SS5 – Demonstrate an understanding of line and rotation symmetry.
PRINCE EDWARD ISLAND GRADE 9 MATHEMATICS CURRICULUM GUIDE
Page 49
SPECIFIC CURRICULUM OUTCOMES
Grade 9 – Strand: Shape and Space (SS) GCO:
Use direct or indirect measurement to solve problems.
GRADE 8
GRADE 9
GRADE 10 – MAT421A
SS1 Solve problems and justify the solution strategy using circle properties including: the perpendicular from the centre of a circle to a chord bisects the chord; the measure of the central angle is equal to twice the measure of the inscribed angle subtended by the same arc; the inscribed angles subtended by the same arc are congruent; a tangent to a circle is perpendicular to the radius at the point of tangency. SCO:
SS1 – Solve problems and justify the solution strategy using circle properties including: the perpendicular from the centre of a circle to a chord bisects the chord; the measure of the central angle is equal to twice the measure of the inscribed angle subtended by the same arc; the inscribed angles subtended by the same arc are congruent; a tangent to a circle is perpendicular to the radius at the point of tangency. [C, CN, PS, R, T, V] Students who have achieved this outcome should be able to:
A.
Provide an example that illustrates: the perpendicular from the centre of a circle to a chord bisects the chord; the measure of the central angle is equal to twice the measure of the inscribed angle subtended by the same arc; the inscribed angles subtended by the same arc are congruent; a tangent to a circle is perpendicular to the radius at the point of tangency.
B. Solve a given problem involving the application of one or more of the circle properties. C. Determine the measure of a given angle inscribed in a semicircle using the circle properties. D. Explain the relationship among the centre of a circle, a chord and the perpendicular bisector of the chord. Section(s) in MathLinks 9 text that address the specific curriculum outcome with relevant Achievement Indicators in brackets:
10.1 (A B C) 10.2 (A B D) 10.3 (A B)
[C] Communication [CN] Connections
[ME] Mental Mathematics and Estimation
[PS] Problem Solving [R] Reasoning
PRINCE EDWARD ISLAND GRADE 9 MATHEMATICS CURRICULUM GUIDE
[T] [V]
Technology Visualization
Page 50
SPECIFIC CURRICULUM OUTCOMES
SCO:
SS1 – Solve problems and justify the solution strategy using circle properties including: the perpendicular from the centre of a circle to a chord bisects the chord; the measure of the central angle is equal to twice the measure of the inscribed angle subtended by the same arc; the inscribed angles subtended by the same arc are congruent; a tangent to a circle is perpendicular to the radius at the point of tangency. [C, CN, PS, R, T, V]
Elaboration Students have explored many circle characteristics in grade seven including radius, diameter, circumference and area. They have developed various formulas through exploration. In grade nine, students will need to develop an understanding of terms relating to circle properties. A circle is a set of points in a plane that are all the same distance (radius) from a fixed point called the centre. A chord is a line segment with both endpoints on a circle. A central angle is an angle formed by two radii of a circle. An inscribed angle is an angle formed by two chords that share a common endpoint. An arc is a portion of the circumference of the circle. A tangent is a line that touches a circle at exactly one point, which is called the point of tangency. chord central angle tangent inscribed angle
Contexts will be explored with respect to chord properties in circles, inscribed and central angle relationships, and tangents to circles. The treatment of these circle topics is not intended to be exhaustive, but is determined to a significant extent by the contexts examined. Students will be exploring four specific properties with respect to central and inscribed angles, inscribed angles, tangents and chords. The property associated with chords is the most extensive. The perpendicular bisector of a chord passes through the centre of the circle. From the same property we can also say that the perpendicular from the centre of a circle to a chord bisects the chord. Finally, the bisector of a chord passing through the centre of a circle is perpendicular to the chord.
PRINCE EDWARD ISLAND GRADE 9 MATHEMATICS CURRICULUM GUIDE
Page 51
SPECIFIC CURRICULUM OUTCOMES
Grade 9 – Strand: Shape and Space (SS) GCO:
Describe the characteristics of 3-D objects and 2-D shapes, and analyse the relationships among them.
GRADE 8
GRADE 9
SS3 Determine the surface area of: right rectangular prisms; right triangular prisms; right cylinders to solve problems.
SS2 Determine the surface area of composite 3-D objects to solve problems.
SS5 Draw and interpret top, front and side views of 3-D objects composed of right rectangular prisms. SCO:
GRADE 10 – MAT421A M3 Solve problems, using SI and imperial units, that involve the surface area and volume of 3-D objects, including: right cones; right cylinders; right prisms; right pyramids; spheres.
SS2 – Determine the surface area of composite 3-D objects to solve problems. [C, CN, PS, R, V] Students who have achieved this outcome should be able to:
A.
Determine the area of overlap in a given concrete composite 3-D object, and explain its effect on determining the surface area (limited to right cylinders, right rectangular prisms and right triangular prisms).
B. Determine the surface area of a given concrete composite 3-D object (limited to right cylinders, right rectangular prisms and right triangular prisms). C. Solve a given problem involving surface area. Section(s) in MathLinks 9 text that address the specific curriculum outcome with relevant Achievement Indicators in brackets:
1.3 (A B C)
[C] Communication [CN] Connections
[ME] Mental Mathematics and Estimation
[PS] Problem Solving [R] Reasoning
PRINCE EDWARD ISLAND GRADE 9 MATHEMATICS CURRICULUM GUIDE
[T] [V]
Technology Visualization
Page 52
SPECIFIC CURRICULUM OUTCOMES
SCO:
SS2 – Determine the surface area of composite 3-D objects to solve problems. [C, CN, PS, R, V]
Elaboration It is important for students to be able to visualize the net of a 3-D object to calculate the surface area of that object efficiently. It is important to use concrete materials to help students visualize the relationship between the 2-D net and the 3-D object. Surface area is the sum of the areas of all the faces of a 3-D object. Some students may require a review of strategies for determining the area of 2-D shapes. Remind students that square units are used to measure area and surface area. In grade eight, students had experience calculating surface areas of right rectangular prisms, right triangular prisms, and right cylinders. In grade nine, this is extended to composite objects which are combinations of these same objects. Concrete items can be used to represent the solids when they are combined to form composite 3-D objects so students can determine what surface is hidden when the objects are combined. It will become obvious that the area of the overlap of surfaces needs to be subtracted from the original surface area of each of the original objects. The objects are all right prisms or cylinders so the hidden surfaces will be symmetrical to an opposite surface that is exposed.
Hidden Surface Hidden Surface
The students should be presented with examples of scenarios that involve real world applications of the surface area of combined objects such as buildings, containers, packaging or furniture. Some objects may also have voids (missing sections) rather than additions, such as a bookshelf or a pencil holder.
PRINCE EDWARD ISLAND GRADE 9 MATHEMATICS CURRICULUM GUIDE
Page 53
SPECIFIC CURRICULUM OUTCOMES
Grade 9 – Strand: Shape and Space (SS) GCO:
Describe the characteristics of 3-D objects and 2-D shapes, and analyse the relationships among them.
GRADE 8
GRADE 9 SS3 Demonstrate an understanding of similarity of polygons.
SCO:
GRADE 10 – MAT421A M4 Develop and apply the primary trigonometric ratios (sine, cosine, tangent) to solve problems that involve right triangles.
SS3 – Demonstrate an understanding of similarity of polygons. [C, CN, PS, R, V] Students who have achieved this outcome should be able to:
A.
Determine if the polygons in a given pre-sorted set are similar and explain the reasoning.
B. Draw a polygon similar to a given polygon and explain why the two are similar. C. Solve a given problem using the properties of similar polygons. Section(s) in MathLinks 9 text that address the specific curriculum outcome with relevant Achievement Indicators in brackets:
4.4 (A B C)
[C] Communication [CN] Connections
[ME] Mental Mathematics and Estimation
[PS] Problem Solving [R] Reasoning
PRINCE EDWARD ISLAND GRADE 9 MATHEMATICS CURRICULUM GUIDE
[T] [V]
Technology Visualization
Page 54
SPECIFIC CURRICULUM OUTCOMES
SCO:
SS3 – Demonstrate an understanding of similarity of polygons. [C, CN, PS, R, V]
Elaboration The connection between proportional reasoning and the geometric concept of similarity is very important. Similar figures provide a visual representation of proportions, and proportional reasoning enhances the understanding of similarity. To show that polygons are similar, students must compare the ratios of the corresponding side lengths and check that corresponding angles are equal. Corresponding sides are sides that have the same relative position in two geometric figures. When polygons are similar, corresponding angles are congruent and corresponding side lengths are all enlarged or reduced by the same factor (ratio). The symbol ~ is used to identify similarity. For example, ABCD ~ EFGH is read, “Trapezoid ABCD is similar to trapezoid EFGH.” A
D E B
C
H F
G
The process of reasoning is necessary for deciding how many trials you need to apply in order to eliminate any doubt that two or more polygons are similar. For example, angle measures alone cannot be the only test to determine for similarity. In the polygon above all angles are congruent and all corresponding side lengths have been 1 reduced by the same factor of . Students will be required to construct similar polygons and explain why they are 2 similar. Students should be exposed to a variety of situations, including pairs of similar figures that are varied in their orientations. The properties of similar polygons can be used to find the measures of missing sides and angles. This topic lends itself well to real life situations, such as finding heights of buildings, or distances which are normally difficult to measure directly, such as the distance across a pond. Please note this outcome should be taught in conjunction with outcome SS4.
PRINCE EDWARD ISLAND GRADE 9 MATHEMATICS CURRICULUM GUIDE
Page 55
SPECIFIC CURRICULUM OUTCOMES
Grade 9 – Strand: Shape and Space (SS) GCO:
Describe and analyse position and motion of objects and shapes.
GRADE 8
GRADE 9
SS6 Demonstrate an understanding of tessellation by: explaining the properties of shapes that make tessellating possible; creating tessellations; identifying tessellations in the environment. SCO:
GRADE 10 – MAT421A
SS4 Draw and interpret scale diagrams of 2-D shapes.
SS4 – Draw and interpret scale diagrams of 2-D shapes. [CN, R, T, V] Students who have achieved this outcome should be able to:
A.
Identify an example in print or electronic media, e.g., newspapers, the Internet, of a scale diagram and interpret the scale factor.
B. Draw a diagram to scale that represents an enlargement or reduction of a given 2-D shape. C. Determine the scale factor for a given diagram drawn to scale. D. Determine if a given diagram is proportional to the original 2-D shape and, if it is, state the scale factor. E.
Solve a given problem that involves a scale diagram by applying the properties of similar triangles.
Section(s) in MathLinks 9 text that address the specific curriculum outcome with relevant Achievement Indicators in brackets:
4.1 (A B C) 4.2 (C D) 4.3 (E)
[C] Communication [CN] Connections
[ME] Mental Mathematics and Estimation
[PS] Problem Solving [R] Reasoning
PRINCE EDWARD ISLAND GRADE 9 MATHEMATICS CURRICULUM GUIDE
[T] [V]
Technology Visualization
Page 56
SPECIFIC CURRICULUM OUTCOMES
SCO:
SS4 – Draw and interpret scale diagrams of 2-D shapes. [CN, R, T, V]
Elaboration A scale is a comparison between the actual size of an object and the size of its image, therefore a scale diagram would be a drawing that is similar to the actual figure. These scale diagrams can be either an enlargement or reduction of the actual object depending on the context. If scale factors are bigger than one, this will result in an enlargement whereas if the scale factor is less than one, it is a reduction. Students have an intuitive sense of shapes that are enlargements or reductions of each other. Students have experienced maps and pictures that have been drawn to scale, and with images produced by photocopiers and computer software. The use of computer software can allow for a great deal of flexibility in the investigation of enlargement and reduction. Methods of using graph paper, scale factors, or protractor and ruler can also be used. It should be noted that when a ratio is used to represent an enlargement or reduction, the format of the ratio is New : Original. A ratio of 2 : 1 means the new figure is an enlargement to twice the size of the original. Likewise, a ratio of 1: 3 means that the new figure is a reduction to
1 of the original, or the original is three times the size of the 3
new figure. Students should understand the relationships between the corresponding sides of similar triangles. That is, if AB BC AC ABC ~ DEF , then the following ratios are equal: . DE EF DF A D
B
C
PRINCE EDWARD ISLAND GRADE 9 MATHEMATICS CURRICULUM GUIDE
E
F
Page 57
SPECIFIC CURRICULUM OUTCOMES
Grade 9 – Strand: Shape and Space (SS) GCO:
Describe and analyse position and motion of objects and shapes.
GRADE 8
GRADE 9
SS6 Demonstrate an understanding of tessellation by: explaining the properties of shapes that make tessellating possible; creating tessellations; identifying tessellations in the environment.
SCO:
GRADE 10 – MAT421A
SS5 Demonstrate an understanding of line and rotation symmetry.
SS5 – Demonstrate an understanding of line and rotation symmetry. [C, CN, PS, V] Students who have achieved this outcome should be able to:
A.
Classify a given set of 2-D shapes or designs according to the number of lines of symmetry.
B. Complete a 2-D shape or design given one half of the shape or design and a line of symmetry. C. Determine if a given 2-D shape or design has rotation symmetry about the point at the centre of the shape or design and, if it does, state the order and angle of rotation. D. Rotate a given 2-D shape about a vertex and draw the resulting image. E.
Identify a line of symmetry or the order and angle of rotation symmetry in a given tessellation.
F.
Identify the type of symmetry that arises from a given transformation on the Cartesian plane.
G. Complete, concretely or pictorially, a given transformation of a 2-D shape on a Cartesian plane, record the coordinates and describe the type of symmetry that results. H. Identify and describe the types of symmetry created in a given piece of artwork. I.
Determine whether or not two given 2-D shapes on the Cartesian plane are related by either rotation or line symmetry.
J.
Draw, on a Cartesian plane, the translation image of a given shape using a given translation rule, such as R2, U3, or , (for right 2, up 3), label each vertex and its corresponding ordered pair and describe why the translation does not result in line or rotation symmetry.
K. Create or provide a piece of artwork that demonstrates line and rotation symmetry, and identify the line(s) of symmetry and the order and angle of rotation. Section(s) in MathLinks 9 text that address the specific curriculum outcome with relevant Achievement Indicators in brackets:
1.1 (A B H I K) 1.2 (C D E F G H I J K) 1.3 (A)
[C] Communication [CN] Connections
[ME] Mental Mathematics and Estimation
[PS] Problem Solving [R] Reasoning
PRINCE EDWARD ISLAND GRADE 9 MATHEMATICS CURRICULUM GUIDE
[T] [V]
Technology Visualization
Page 58
SPECIFIC CURRICULUM OUTCOMES
SCO:
SS5 – Demonstrate an understanding of line and rotation symmetry. [C, CN, PS, V]
Elaboration In previous grades, students have performed transformations on 2-D shapes and have created and identified tessellations. Knowledge of this will be extended to line symmetry and rotation symmetry. Line symmetry is a line that divides a figure into two reflected parts. Shapes can have no line of symmetry or multiple lines of symmetry; these can exist in any orientation (vertical, horizontal, slanted). Rotation symmetry occurs when a figure can be turned about its centre so that it fits in its original outline. The order of rotation is the number of times a figure fits onto itself in one complete turn. The angle of rotation is the minimum angle required to turn a figure onto itself. Paper folding and the Mira (transparent mirror) are encouraged when working with symmetry. When using paper folding, students can fold the shape onto itself to find the line(s) of symmetry. The Mira can be placed on the shape and when the reflection appears onto the shape, the Mira defines the line of symmetry. Rotations should be done by inspection if the centre of rotation is inside the figure or on a vertex. Some students may still require tracing paper in both situations; however, they should be encouraged to visualize the image before the transformation is performed. Similarly, when working with rotation symmetry, some students may choose to use tracing paper in order to rotate the shape about its centre to find the order and angle of rotation. This topic can provide an avenue for students to demonstrate their creativity. The designs produced can make interesting wall hangings for the classroom. The works of M.C. Esher would make an interesting research project using the Internet. For example, a simple application of Esher-like tessellations might involve examining Islamic art, which is often geometry-based. Wallpaper is a good source of designs which utilize transformational geometry and Esher-like transformations. If there is a wallpaper store close by, teachers can request old wallpaper books from discontinued designs. Students can look at the designs to find evidence of translations, reflections, and rotations, and record the transformations they observe. Many wallpaper designs incorporate multiple transformations, and some include interesting tessellations.
PRINCE EDWARD ISLAND GRADE 9 MATHEMATICS CURRICULUM GUIDE
Page 59
SPECIFIC CURRICULUM OUTCOMES
STATISTICS AND PROBABILITY
PRINCE EDWARD ISLAND GRADE 9 MATHEMATICS CURRICULUM GUIDE
Page 60
SPECIFIC CURRICULUM OUTCOMES
SPECIFIC CURRICULUM OUTCOMES SP1 – Describe the effect of: bias; use of language; ethics; cost; time and timing; privacy; cultural sensitivity on the collection of data. SP2 – Select and defend the choice of using either a population or a sample of a population to answer a question. SP3 – Develop and implement a project plan for the collection, display and analysis of data by: formulating a question for investigation; choosing a data collection method that includes social considerations; selecting a population or a sample; collecting the data; displaying the collected data in an appropriate manner; drawing conclusions to answer the question. SP4 – Demonstrate an understanding of the role of probability in society.
PRINCE EDWARD ISLAND GRADE 9 MATHEMATICS CURRICULUM GUIDE
Page 61
SPECIFIC CURRICULUM OUTCOMES
Grade 9 – Strand: Statistics and Probability (SP) GCO:
Collect, display and analyse data to solve problems.
GRADE 8
GRADE 9
SP1 Critique ways in which data is presented.
SCO:
GRADE 10 – MAT421A
SP1 Describe the effect of: bias; use of language; ethics; cost; time and timing; privacy; cultural sensitivity on the collection of data.
SP1 – Describe the effect of: bias; use of language; ethics; cost; time and timing; privacy; cultural sensitivity on the collection of data. [C, CN, R, T] Students who have achieved this outcome should be able to:
A.
Analyse a given case study of data collection, and identify potential problems related to bias, use of language, ethics, cost, time and timing, privacy, or cultural sensitivity.
B. Provide examples to illustrate how bias, use of language, ethics, cost, time and timing, privacy, or cultural sensitivity may influence the data. Section(s) in MathLinks 9 text that address the specific curriculum outcome with relevant Achievement Indicators in brackets:
11.1 (A B)
[C] Communication [CN] Connections
[ME] Mental Mathematics and Estimation
[PS] Problem Solving [R] Reasoning
PRINCE EDWARD ISLAND GRADE 9 MATHEMATICS CURRICULUM GUIDE
[T] [V]
Technology Visualization
Page 62
SPECIFIC CURRICULUM OUTCOMES
SCO:
SP1 – Describe the effect of: bias; use of language; ethics; cost; time and timing; privacy; cultural sensitivity on the collection of data. [C, CN, R, T]
Elaboration In grade eight, students critiqued a variety of ways in which to present data (bar graphs, line graphs, circle graphs, pictographs and histograms), and evaluated their strengths and limitations. Terms such as discrete and continuous data, accuracy, choice of intervals, and trends were reinforced. Students learned how to justify their conclusions and identify inconsistent and misrepresented data. In grade nine, students will continue to develop data analysis and focus on factors that affect the collection of data. Students will learn, through examples, how the presentation of data influences public perception. These influences may include bias, the use of language, ethics, cost, time and timing, privacy, and cultural sensitivity when collecting data. Students should provide examples to illustrate how this may occur.
PRINCE EDWARD ISLAND GRADE 9 MATHEMATICS CURRICULUM GUIDE
Page 63
SPECIFIC CURRICULUM OUTCOMES
Grade 9 – Strand: Statistics and Probability (SP) GCO:
Collect, display and analyse data to solve problems.
GRADE 8
GRADE 9
SP1 Critique ways in which data is presented.
SCO:
GRADE 10 – MAT421A
SP2 Select and defend the choice of using either a population or a sample of a population to answer a question.
SP2 – Select and defend the choice of using either a population or a sample of a population to answer a question. [C, CN, PS, R] Students who have achieved this outcome should be able to:
A.
Identify whether a given situation represents the use of a sample or a population.
B. Provide an example of a situation in which a population may be used to answer a question and justify the choice. C. Provide an example of a question where a limitation precludes the use of a population and describe the limitation, e.g., too costly, not enough time, limited resources. D. Identify and critique a given example in which a generalization from a sample of a population may or may not be valid for the population. Section(s) in MathLinks 9 text that address the specific curriculum outcome with relevant Achievement Indicators in brackets:
11.2 (A B C D)
[C] Communication [CN] Connections
[ME] Mental Mathematics and Estimation
[PS] Problem Solving [R] Reasoning
PRINCE EDWARD ISLAND GRADE 9 MATHEMATICS CURRICULUM GUIDE
[T] [V]
Technology Visualization
Page 64
SPECIFIC CURRICULUM OUTCOMES
SCO:
SP2 – Select and defend the choice of using either a population or a sample of a population to answer a question. [C, CN, PS, R]
Elaboration Students will need to understand the relationship between a population and a sample. The set of all individuals in the group being studied is called a population. For example, the population in a federal election is the group of all eligible voters. When data is collected from each member of the population, this is called a census. Any group of individuals selected from the population would be referred to as a sample. For example, a sample of the population in a federal election might be 100 individuals chosen from each province or territory. Since it is often impractical to gather information about entire populations, sampling is a common statistical technique. When a sample is representative of the population, the data collected from the sample leads to valid conclusions. Students will need to understand issues with respect to sampling strategies and sample size in order to properly draw inferences from sample data. By conducting experiments or simulations and examining the data collected, students should understand that larger sample sizes increase the likelihood that the statistical results will approximate the expected values of the characteristics of the population. While there are many different ways to select samples, random samples are most likely to produce valid conclusions.
PRINCE EDWARD ISLAND GRADE 9 MATHEMATICS CURRICULUM GUIDE
Page 65
SPECIFIC CURRICULUM OUTCOMES
Grade 9 – Strand: Statistics and Probability (SP) GCO:
Collect, display and analyse data to solve problems.
GRADE 8
GRADE 9
GRADE 10 – MAT421A
SP3 Develop and implement a project plan for the collection, display and analysis of data by: formulating a question for investigation; choosing a data collection method that includes social considerations; selecting a population or a sample; collecting the data; displaying the collected data in an appropriate manner; drawing conclusions to answer the question. SCO:
SP3 – Develop and implement a project plan for the collection, display and analysis of data by: formulating a question for investigation; choosing a data collection method that includes social considerations; selecting a population or a sample; collecting the data; displaying the collected data in an appropriate manner; drawing conclusions to answer the question. [C, PS, R, T, V] Students who have achieved this outcome should be able to:
A.
Create a rubric to assess a project that includes the assessment of: a question for investigation; the choice of a data collection method that includes social considerations; the selection of a population or a sample and justifying the choice; the display of the collected data; the conclusions to answer the question.
B. Develop a project plan that describes: a question for investigation; the method of data collection that includes social considerations; the method for selecting a population or a sample; the method to be used for collection of the data; the methods for analysis and display of the data. C. Complete the project according to the plan, draw conclusions and communicate findings to an audience. D. Self-assess the completed project by applying the rubric. Section(s) in MathLinks 9 text that address the specific curriculum outcome with relevant Achievement Indicators in brackets:
11.1 (A B C D)
11.3 (A B C D)
11.2 (A B C D)
11.4 (A B C D)
[C] Communication [CN] Connections
[ME] Mental Mathematics and Estimation
[PS] Problem Solving [R] Reasoning
PRINCE EDWARD ISLAND GRADE 9 MATHEMATICS CURRICULUM GUIDE
[T] [V]
Technology Visualization
Page 66
SPECIFIC CURRICULUM OUTCOMES
SCO:
SP3 – Develop and implement a project plan for the collection, display and analysis of data by: formulating a question for investigation; choosing a data collection method that includes social considerations; selecting a population or a sample; collecting the data; displaying the collected data in an appropriate manner; drawing conclusions to answer the question. [C, PS, R, T, V]
Elaboration Rubric development may be a new concept to students at this grade level. A rubric should be developed prior to the beginning of the project to clarify exactly what is expected and how the project will be assessed. A rubric should include the criteria that will be assessed and a description of each level of performance. Rubric development could be completed as a class activity. A sample framework is shown below.
Criteria
Level 1
Level 2
Level 3
Level 4
A question for investigation The choice of a data collection method that includes social considerations The selection of a population or a sample and justifying the choice The display of the collected data Conclusions to answer the question Students will require guidance when developing a plan for their project. Models of data analysis projects should be reviewed with students so they can recognize what quality work looks like. The development of a relevant question will determine the success of the project, so time will have to be devoted to assisting students in their choice of a question. In previous grades, students have been collecting, displaying and interpreting data represented in various tables and graphs. This project will consolidate prior knowledge and could be completed as an interdisciplinary or crosscurricular assignment with other subjects. Students can also draw upon data that are available through such sources as Statistics Canada, as well as other government documents and reports.
PRINCE EDWARD ISLAND GRADE 9 MATHEMATICS CURRICULUM GUIDE
Page 67
SPECIFIC CURRICULUM OUTCOMES
Grade 9 – Strand: Statistics and Probability (SP) GCO:
Use experimental or theoretical probabilities to represent and solve problems involving uncertainty.
GRADE 8
GRADE 9
SP2 Solve problems involving the probability of independent events.
SCO:
GRADE 10 – MAT421A
SP4 Demonstrate an understanding of the role of probability in society.
SP4 – Demonstrate an understanding of the role of probability in society. [C, CN, R, T] Students who have achieved this outcome should be able to:
A.
Provide an example from print or electronic media, e.g., newspapers, the Internet, where probability is used.
B. Identify the assumptions associated with a given probability and explain the limitations of each assumption. C. Explain how a single probability can be used to support opposing positions. D. Explain, using examples, how decisions based on probability may be a combination of theoretical probability, experimental probability and subjective judgment. Section(s) in MathLinks 9 text that address the specific curriculum outcome with relevant Achievement Indicators in brackets:
11.3 (A B C D) 11.4 (A B C D)
[C] Communication [CN] Connections
[ME] Mental Mathematics and Estimation
[PS] Problem Solving [R] Reasoning
PRINCE EDWARD ISLAND GRADE 9 MATHEMATICS CURRICULUM GUIDE
[T] [V]
Technology Visualization
Page 68
SPECIFIC CURRICULUM OUTCOMES
SCO:
SP4 – Demonstrate an understanding of the role of probability in society. [C, CN, R, T]
Elaboration Students going into grade nine will have had experience distinguishing between, finding and comparing experimental and theoretical probability, and expressing these probabilities as fractions, percents and decimals, for both single and independent events. In grade nine, the focus of study is for students to understand the role that probability plays in society by looking at the probability of events occurring and by examining decisions that are based on those predictions. It will be important for students to be exposed to numerous aspects of daily life where probability is used. Some examples are:
insurance premiums, which are set based on the historical data of a certain gender, age group or region making claims;
warranty periods for certain products;
number of units produced by manufacturers;
projection of winners of an election;
side effects of a drug;
number of available seats in medical school or other faculties;
scheduling of flights and crew, and fares according to the time of year;
weather forecasts.
The work of students should be focused on situations which are familiar to them. Discussions about how predictions are made (a mix of theoretical and experimental probability and subjective judgement) should be a focus. Students will quickly realize that experimental probability is the one most widely used when making predictions. The types of assumptions made when making these predictions should also be addressed.
PRINCE EDWARD ISLAND GRADE 9 MATHEMATICS CURRICULUM GUIDE
Page 69
PRINCE EDWARD ISLAND GRADE 9 MATHEMATICS CURRICULUM GUIDE
Page 70
CURRICULUM GUIDE SUPPLEMENT
Curriculum Guide Supplement This supplement to the Prince Edward Island Grade 9 Mathematics Curriculum Guide is designed to parallel the primary resource, MathLinks 9. For each of the chapters in MathLinks 9, an approximate timeframe is suggested to aid teachers with planning. The timeframe is based on a total of 176 classes, each with an average length of 40 minutes: CHAPTER
SUGGESTED TIME
Chapter 1 – Symmetry and Surface Area
16 classes
Chapter 2 – Rational Numbers
17 classes
Chapter 3 – Powers and Exponents
14 classes
Chapter 4 – Scale Factors and Similarity
21 classes
Chapter 5 – Introduction to Polynomials
16 classes
Chapter 6 – Linear Relations
16 classes
Chapter 7 – Multiplying and Dividing Polynomials
18 classes
Chapter 8 – Solving Linear Equations
17 classes
Chapter 9 – Linear Inequalities
11 classes
Chapter 10 – Circle Geometry
10 classes
Chapter 11 – Data Analysis
20 classes
Each chapter of MathLinks 9 is divided into a number of sections. In this document, each section is supported by a one-page presentation, which includes the following information:
the name and pages of the section in MathLinks 9; the specific curriculum outcome(s) and achievement indicator(s) addressed in the section (see the first half of the curriculum guide for an explanation of symbols); the student expectations for the section, which are associated with the SCO(s); the new concepts introduced in the section; literacy links, which reinforce previously learned concepts and highlight the language of mathematics; suggested problems in MathLinks 9; possible instructional and assessment strategies for the section.
PRINCE EDWARD ISLAND GRADE 9 MATHEMATICS CURRICULUM GUIDE
Page 71
PRINCE EDWARD ISLAND GRADE 9 MATHEMATICS CURRICULUM GUIDE
Page 72
UNIT PLANS
CHAPTER 1 SYMMETRY AND SURFACE AREA
SUGGESTED TIME 16 classes
PRINCE EDWARD ISLAND GRADE 9 MATHEMATICS CURRICULUM GUIDE
Page 73
UNIT PLANS
Section 1.1 – Line Symmetry (pp. 6-15) ELABORATIONS & SUGGESTED PROBLEMS Specific Curriculum Outcome(s) and Achievement Indicator(s) addressed:
POSSIBLE INSTRUCTIONAL & ASSESSMENT STRATEGIES Possible Instructional Strategies:
Encourage students to use their own drawings as examples of symmetric shapes and drawings.
Introduce figures that are interesting and unusual that exhibit line symmetry.
Make sufficient resources available and encourage students to cut out shapes and physically fold paper to see line symmetry.
Provide students with two congruent rectangles in two different colours, have them cut the rectangles in half diagonally and then place one diagonal cut of one colour over the other colour. The visual contrast in colour will identify that diagonals are not lines of symmetry in a rectangle.
Using graph paper, ask students to draw a shape and to cut it along a line of symmetry. Students exchange their drawing with another student who will complete the 2-D shape. Students should approach this by measuring from the vertices to the line of symmetry in order to place each of the mirrored vertices and complete the shape.
SS5 (A B H I K)
After this lesson, students will be expected to:
classify 2-D shapes or designs according to the number of lines of symmetry
identify the line(s) of symmetry for a 2-D shape or design
complete a shape or design given one half of the shape and a line of symmetry
create a design that demonstrates line symmetry
After this lesson, students should understand the following concepts:
line of symmetry – a line that divides a figure into two reflected pieces; sometimes called a line of reflection or an axis of symmetry; a figure may have one or more lines of symmetry, or it may have none; can be vertical, horizontal or oblique (slanted)
line symmetry – a type of symmetry where an image or object can be divided into two identical, reflected halves by a line of symmetry; identical halves can be reflected in a vertical, horizontal or oblique (slanted) line of symmetry
Possible Assessment Strategies:
For each figure, determine the line(s) of symmetry. a.
Literacy Links:
Notation – B and C are symbols used to designate the new positions of B and C after a transformation. B is read as “B prime.”
Symmetric – If a shape or design has symmetry, then it can be described as symmetric or symmetrical.
Parallelogram – A parallelogram is a four-sided figure with opposite sides parallel and equal in length.
Plane – A plane is a two-dimensional surface that extends in all directions.
b.
c.
Suggested Problems in MathLinks 9:
pp. 11-15: #1-10, 12-15, 16, 18, Math Link
PRINCE EDWARD ISLAND GRADE 9 MATHEMATICS CURRICULUM GUIDE
Page 74
UNIT PLANS
Section 1.2 – Rotation Symmetry and Transformations (pp. 16-25) ELABORATIONS & SUGGESTED PROBLEMS Specific Curriculum Outcome(s) and Achievement Indicator(s) addressed:
tell if 2-D shapes and designs have rotation symmetry
give the order of rotation and angle of rotation for various shapes
create designs with rotation symmetry
identify the transformations in shapes and designs involving line or rotation symmetry
After this lesson, students should understand the following concepts:
centre of rotation – the point about which the rotation of an object or design turns
rotation symmetry – occurs when a shape or design can be turned about its centre of rotation so that it fits onto its outline more than once in a complete turn
Remind students that one full turn is 3600, a half turn is 1800, and that a quarter turn is 900.
Have students explain, using models or diagrams, the connection between rotation symmetry and transformations. Emphasize that many examples of rotation symmetry have more than one combination of transformations that can be used to generate the figure or design.
Provide students with, or have them bring in tessellations, artwork or wallpaper designs to identify the order and angle of rotation symmetry. This would be a great cross-curricular activity with art classes.
When looking at translations of 2-D shapes on the Cartesian plane, ensure that students are exposed to a variety of shapes in order to recognize that translations do not result in line or rotation symmetry.
Possible Assessment Strategies:
On a Cartesian plane, a. Sketch a quadrilateral. b. Label and record the coordinates of its vertices. c. Translate the quadrilateral 3 units right and 2 units up. d. Label and record the coordinates of the corresponding vertices of the image. e. Determine whether the shapes are related by either rotation or line symmetry and describe why.
Determine whether or not these pairs of shapes are related by line or rotation symmetry. a. b.
Does the following tessellation have line symmetry, rotation symmetry, both or neither? Explain by describing the line or symmetry and/or the centre of rotation. If there is no symmetry, describe what changes would make the image symmetrical.
6
angle of rotation – the minimum measure of the angle needed to turn a shape or design onto itself; may be measured in degrees or fractions of a turn; is equal to 3600 divided by the order of rotation
Literacy Link:
order of rotation – the number of times a shape or design fits onto itself in one complete turn
4
Possible Instructional Strategies:
SS5 (C D E F G H I J K)
After this lesson, students will be expected to:
POSSIBLE INSTRUCTIONAL & ASSESSMENT STRATEGIES
Tessellation – A tessellation is a pattern or arrangement that covers an area without overlapping or leaving gaps. It is also known as a tiling pattern.
Suggested Problems in MathLinks 9:
pp. 20-25: #1-7, 9, 10, 12, 16, 17, 19, Math Link
PRINCE EDWARD ISLAND GRADE 9 MATHEMATICS CURRICULUM GUIDE
Page 75
UNIT PLANS
Section 1.3 – Surface Area (pp. 26-35) ELABORATIONS & SUGGESTED PROBLEMS Specific Curriculum Outcome(s) and Achievement Indicator(s) addressed:
SS2 (A B C)
SS5 (A)
After this lesson, students will be expected to:
determine the area of overlap in composite 3-D objects
find the surface area for composite 3-D objects
solve problems involving surface area
After this lesson, students should understand the following concept:
Possible Instructional Strategies:
Help students explore the concept that symmetry implies “sameness” and that opposite sides of prisms and cylinders have the same size and dimensions.
Have students explain which view relates to each side of an object and which dimension each one provides.
The use of concrete materials will promote the understanding of which surfaces overlap and which are exposed when objects are combined into composite 3-D objects.
Some objects may not appear to be composite (such as a milk carton). Students may require assistance in separating objects into familiar pieces.
surface area – the sum of the areas of all the faces of an object
Literacy Link:
POSSIBLE INSTRUCTIONAL & ASSESSMENT STRATEGIES
Composite Object – An object that is made from two or more separate objects is called a composite object.
Possible Assessment Strategies:
The scale model of a steel barn has been drawn such that 1 cm represents 0.5 m. Calculate the amount of steel needed to cover the actual barn.
Suggested Problems in MathLinks 9:
pp. 31-35: #1-10, 12, 13 or 14, one of 16-19, Math Link
4 cm 6 cm
10 cm
15 cm
The surface area of this composite figure was calculated incorrectly to be 582 cm2. The figure on the top is a cube with sides of 5 cm. The large prism on the bottom has a length of 12 cm, a width of 6 cm and a height of 8 cm. Determine the error in the calculation and give the correct solution.
Determine the surface area of a set of concrete steps. Use this information to decide how much paint would be needed to cover the steps.
45 cm 10 cm 90 cm
PRINCE EDWARD ISLAND GRADE 9 MATHEMATICS CURRICULUM GUIDE
Page 76
UNIT PLANS
CHAPTER 2 RATIONAL NUMBERS
SUGGESTED TIME 17 classes
PRINCE EDWARD ISLAND GRADE 9 MATHEMATICS CURRICULUM GUIDE
Page 77
UNIT PLANS
Section 2.1 – Comparing and Ordering Rational Numbers (pp. 46-54) ELABORATIONS & SUGGESTED PROBLEMS Specific Curriculum Outcome(s) and Achievement Indicator(s) addressed:
POSSIBLE INSTRUCTIONAL & ASSESSMENT STRATEGIES Possible Instructional Strategies:
For students experiencing difficulty, encourage the use of the number line. Ensure that students are able to visualize that opposites are the same distance from zero.
You may wish to provide students with a number line that has regular increments between integers already marked. Encourage students to mark 1 1 3 points such as , and . Have them 4 2 4 write the decimal equivalents below the fractions. This will provide a visual reference point for students to use for plotting and organizing the given values.
If students are having difficulty finding equivalent 1 fractions, start with simpler fractions, such as , 2 1 3 or , and review how to find equivalents. 3 4
Once students have found equivalent fractions, encourage them to divide the units between integers on their number lines in equal intervals to match their denominator. Alternatively, they could use the numerators and visualize them on a number line in order to place equivalent fractions in ascending or descending order.
Assist students in remembering the terms descending and ascending. Point out that descending begins with d as in down (or decreasing); the numbers go down from greatest to least. Ascending is the opposite; the numbers go up from least to greatest.
N3 (A B)
After this lesson, students will be expected to:
compare and order rational numbers
identify a rational number between two given rational numbers
After this lesson, students should understand the following concept:
rational number – a number that can be a expressed as , where a and b are integers and b 1 3 b 0; examples include 4, 3.5, , 1 and 0 2 4
Literacy Links:
Equivalent Numbers – When numbers are equivalent, they have the same value. For 24 18 12 6 example, the numbers and , , 4 3 2 1 are all equivalent. They all represent the same rational number, –6. Quotient – The quotient of two integers with unlike 9 signs is negative. This means that 12 9 9 8 8 8 and . 12 12 12 12 12
Suggested Problems in MathLinks 9:
pp. 51-54: #1-18, 20, 22, 23, Math Link
Possible Assessment Strategies:
Find three numbers which lie between each pair of numbers. a. –1 and 0 b.
1 1 and 3 2
c.
–3.6 and –3.5
d.
1 and 0.4 3
e.
0.6 and
2 3
Order the following rational numbers from smallest to largest: 2.6
PRINCE EDWARD ISLAND GRADE 9 MATHEMATICS CURRICULUM GUIDE
1 2
5 3
1.2
7 8
Page 78
UNIT PLANS
Section 2.2 – Problem Solving with Rational Numbers in Decimal Form (pp. 55-62) ELABORATIONS & SUGGESTED PROBLEMS Specific Curriculum Outcome(s) and Achievement Indicator(s) addressed:
Possible Instructional Strategies:
Ensure that students understand that the same sign rules apply when multiplying rational numbers in decimal form as when multiplying integers.
Encourage students to use a solution method that does not involve a calculator before they solve using a calculator. It is important that they can recognize a reasonable estimate and answer the question using a calculator.
For students who are having difficulty, go over the order of operations with them and encourage them to complete only one step per line, showing all of their work. This will help them keep track of where they are in the process and help you identify where they are going off track.
N3 (C)
After this lesson, students will be expected to:
perform operations on rational numbers in decimal form
solve problems involving rational numbers in decimal form
Literacy Links:
Parentheses – The word parentheses is another name for brackets. They can be used in place of a multiplication sign. For example, 4 1.5 4 1.5 .
Order of Operations Perform operations inside parentheses first. Multiply and divide in order from left to right. Add and subtract in order from left to right.
POSSIBLE INSTRUCTIONAL & ASSESSMENT STRATEGIES
Possible Assessment Strategies:
Square Brackets – In the expression 1.1 2.3 0.5 , square brackets are used for grouping because –0.5 is already in parentheses.
Share – A share is one unit of ownership in a corporation.
Suggested Problems in MathLinks 9:
For each of the following problems, estimate and then calculate the answer. a.
0.56 3.14
b.
2.75 4.13
c.
4.2 6.5
d.
8.82 6
e.
6.2 0.72 2.8 1.2
As a fundraiser, the student council ordered 130 birthday cards with a picture of the school’s logo. The cards cost the student council $1.45 each. They sold 126 cards for $2.00 each. How much profit did the student council make on their birthday card sale?
For the following set of numbers, determine the range, the median and the mean: 2.5, –8.1, –3.5, 1.8, 0.6, 5.8, –0.5
pp. 59-62: #1-13, 16, 18, 22, Math Link
PRINCE EDWARD ISLAND GRADE 9 MATHEMATICS CURRICULUM GUIDE
Page 79
UNIT PLANS
Section 2.3 – Problem Solving with Rational Numbers in Fraction Form (pp. 63-71) ELABORATIONS & SUGGESTED PROBLEMS Specific Curriculum Outcome(s) and Achievement Indicator(s) addressed:
POSSIBLE INSTRUCTIONAL & ASSESSMENT STRATEGIES Possible Instructional Strategies:
Have the class develop a list of pros and cons for decimal form vs. fraction form.
The common denominator method for division of fractions, taught in grade eight, should be extended to negative fractions. When denominators are the same, the numerators can be divided, as in the following example:
N3 (C)
After this lesson, students will be expected to:
perform operations on rational numbers in fraction form
solve problems involving rational numbers in fraction form
5 1 10 3 10 3 2 6 6 3
Literacy Link:
Time Notation – The time 1:55.27 means 1 min, 55.27 s.
Suggested Problems in MathLinks 9:
pp. 67-71: #1-10, 12, 13 or 14, 15, one of 16-18, 20, Math Link, History Link
Use patterning to justify the result for a negative multiplied by a negative using rational numbers. For example: 1 2 1 2
1 1 ? 2
1 1 1 2 2
1 2 ? 2
1 0 0 2
1 3 ? 2
Possible Assessment Strategies:
Sarah’s class started a stock market club. Each student was given a day of the week to be responsible for checking the stock market reports. This morning, Sarah found that there was little change in most of their holdings, except for Scotia Silver, which was down a quarter, and Brunswick Copper, which was up an eighth. As it happens, the price of both stocks was previously $18.00 per share. The group holds 100 shares of each type of stock. a. Is the overall value of the stocks greater or less as a result of the changes? Explain your thinking. b. If Sarah had the same stocks on a Canadian exchange, the change in value would be quoted in decimals. Represent the stock changes as decimals.
Use estimation to determine which expression has the greatest quotient: 9 3 5 3
2
1 6 1 5 8
1 5 10 6
1 1 4 2
3
PRINCE EDWARD ISLAND GRADE 9 MATHEMATICS CURRICULUM GUIDE
Page 80
UNIT PLANS
Section 2.4 – Determining Square Roots of Rational Numbers (pp. 72-81) ELABORATIONS & SUGGESTED PROBLEMS Specific Curriculum Outcome(s) and Achievement Indicator(s) addressed:
N3 (C)
N5 (A B C D)
N6 (A B C D)
POSSIBLE INSTRUCTIONAL & ASSESSMENT STRATEGIES Possible Instructional Strategies:
Point out to students that perfect squares in decimal form may be easier to visualize if written as a fraction.
Area models for square roots can be explored for fractions just as they have been for whole numbers. For example, the shaded diagram shows 4 a square (representing the whole or 1) with 9 4 shaded. The square root of is determined by 9 2 finding the dimensions of the shaded square, . 3
The square root of numbers greater than 1 is always less than the original number. For example, 64 8 and 1.21 1.1. This can lead to the misconception that this is true for all numbers. Have students investigate square roots of positive numbers that are less than one, such as 4 or 0.01. 9
After this lesson, students will be expected to:
determine the square root of a perfect square rational number
determine an approximate square root of a nonperfect square rational number
After this lesson, students should understand the following concept:
non-perfect square – a rational number that cannot be expressed as the product of two equal rational factors; for example, you cannot multiply any rational number by itself to get an answer of 3, 7 5, 1.5 or 8
Literacy Links:
Square Root – When the square root of a given number is multiplied by itself, the product is the given number. For example, the square root of 9 is 3, because 3 3 9. Square root is represented by the symbol
, for example,
Perfect Square – A perfect square can be represented as the product of two equal rational factors. The decimal 0.25 is a perfect square because it can be expressed as 0.5 0.5. The 9 is a perfect square because it can be fraction 16 3 3 expressed as . 4 4 Square Roots of Perfect Squares – The number 0.25 can be expressed as 0.5 0.5. Therefore, 9 0.25 0.5. The number can be expressed 16 3 3 as . Therefore, 4 4
9 3.
9 3 . 16 4
Order of Operations with Square Roots – Perform operations under a square root symbol before taking the square root. For example, 9 4 36 or 6.
Possible Assessment Strategies:
discovered that 2 4 and 2 4. He 2
2
concluded through guess-and-check that there are two solutions to this equation. Sarah solved the button on the same problem, using the calculator. Her solution produced only one answer. a. Is Jason’s conclusion correct? Explain why or why not. b. How can you explain the fact that Sarah’s method produced only one solution?
A square has an area of 109 cm2. What are the lengths of its sides? Round off the answer to one decimal place.
Explain how you know that
30,
1.6 and
2 5
do not produce exact answers.
Suggested Problems in MathLinks 9:
When solving the equation x 2 4, Jason
pp. 78-81: #1-16, two of 17-21, 26, 29, Math Link
PRINCE EDWARD ISLAND GRADE 9 MATHEMATICS CURRICULUM GUIDE
Identify: a. a whole number with a square root that lies between 6 and 7 b. a rational number with a square root that lies between 0.7 and 0.8
Page 81
UNIT PLANS
PRINCE EDWARD ISLAND GRADE 9 MATHEMATICS CURRICULUM GUIDE
Page 82
UNIT PLANS
CHAPTER 3 POWERS AND EXPONENTS
SUGGESTED TIME 14 classes
PRINCE EDWARD ISLAND GRADE 9 MATHEMATICS CURRICULUM GUIDE
Page 83
UNIT PLANS
Section 3.1 – Using Exponents to Describe Numbers (pp. 92-98) ELABORATIONS & SUGGESTED PROBLEMS Specific Curriculum Outcome(s) and Achievement Indicator(s) addressed:
POSSIBLE INSTRUCTIONAL & ASSESSMENT STRATEGIES Possible Instructional Strategies:
Present students with a power that has a negative base and an exponent too large for the calculator to handle. Ask students if the power evaluates to a positive or negative number. Students must think about whether the exponent is odd or even.
Investigate the relationship between pairs of powers such as 63 and 36 , and 58 and 85.
Provide 25 tiles and 30 cube-a-links. Have students explore the number of tiles required to make squares and the number of cube-a-links required to make cubes. Students should investigate squares with sides of 1, 2, 3, 4 and 5 tiles. They should also investigate cubes with sides of 1, 2 and 3 cube-a-links. As an extension, a cube with a side of 4 could be done by the whole class after predicting how many cube-a-links would be required to build it.
N1 (A B C D E G)
After this lesson, students will be expected to:
represent repeated multiplication with exponents
describe how powers represent repeated multiplication
After this lesson, students should understand the following concepts:
power – an expression made up of a base and an exponent base
exponent 7
4 power
base – the number you multiply by itself in a power
Possible Assessment Strategies:
exponent – the number of times you multiply a base in a power
Model the difference between 32 and 23.
exponential form – a shorter way of writing repeated multiplication, using a base and an exponent; 5 5 5 in exponential form is 53
John wants to use his calculator to find 94 , but the 4 key is missing. a. Explain how he can use his calculator to find the answer to this question even though the 4 is missing. b. Suppose the 9 key is missing instead. Explain how he might now use the calculator to find the answer.
When simplified, 103 has four digits. How many
Literacy Link:
Reading Powers – There are several ways to read powers. You can read 25 in the following ways: two to the fifth two to the exponent five
Suggested Problems in MathLinks 9:
pp. 96-98: #1-14, 16, Math Link
digits does 203 and 403 have? Why?
Find a value for a and a value for b which would make 3a 9b true. Are there any other values for a and b that would work?
Use patterning to help you find the last digit when simplifying each of the following. a.
4100
b.
2101
c.
550
Express 25 as a power where the exponent is 2 and the base is a. positive b. negative
Why is 62 called a square number while 63 is called a cube number?
PRINCE EDWARD ISLAND GRADE 9 MATHEMATICS CURRICULUM GUIDE
Page 84
UNIT PLANS
Section 3.2 – Exponent Laws (pp. 99-107) ELABORATIONS & SUGGESTED PROBLEMS Specific Curriculum Outcome(s) and Achievement Indicator(s) addressed:
N1 (C D E F G)
N2 (A B E)
POSSIBLE INSTRUCTIONAL & ASSESSMENT STRATEGIES Possible Instructional Strategies:
Ensure that students are using parentheses around negative bases. Remind students to keep the parentheses until the final answer is found. Remind them that removing the brackets may create a different expression altogether.
Some students may approach questions by simplifying what is in the brackets first and then applying repeated multiplication or a power law. This process is acceptable but students should be encouraged to make use of the rules applying to exponents. This will often result in a simpler calculation.
Some students may have a difficult time knowing what a common error is in exponents, particularly if students are making that error. You may wish to provide them with examples of common errors and have them identify the error and correct it. Some samples are:
After this lesson, students will be expected to:
explain the exponent laws for a product of powers a quotient of powers a power of a power a power of a product a power of a quotient
Literacy Links:
Factored Form – Another term for repeated multiplication is factored form.
Multiplying Powers – When multiplying powers with the same base, add the exponents to write the product as a single power.
a a a m
n
mn
Dividing Powers – When dividing powers with the same base, subtract the exponents to write the quotient as a single power. am an am n
Raising a Power to an Exponent – When a power is raised to an exponent, multiply the exponents to write the expression with a single exponent.
a m
a mn
Raising a Product to an Exponent – When a product is raised to an exponent, you can rewrite each factor in the product with the same exponent.
ab
n
m
ambm
Raising a Quotient to an Exponent – When a quotient is raised to an exponent, you can rewrite each number in the quotient with the same exponent. n
a a n, b0 b b
24 25 220
2
28 22 24
5 2 58
3
6
29
4
When working with powers, special cases should be noted, e.g., when there is no exponent, a 1 is understood: 5 51.
Have students state the exponent laws in their own words, with an example to illustrate.
Possible Assessment Strategies:
Why is the expression 24 24 53 5 3 105 10 4 easy to simplify mentally?
Solve each of the following mentally.
n
Raising a Quantity to an Exponent of Zero – When the exponent of the power is 0, the value of the power is 1, if the base is not equal to 0.
a.
46 44 40
b.
79 77 7
c.
145 145 145 4
3
2
Simplify 24 3 4 to a single base, using an exponent law.
The prime factorization of 1024 is 2 2 2 2 2 2 2 2 2 2. Write 1024 as the product of two powers of 2 in as many ways as possible.
a0 1, a 0
Suggested Problems in MathLinks 9:
pp. 105-107: #1-21
PRINCE EDWARD ISLAND GRADE 9 MATHEMATICS CURRICULUM GUIDE
Page 85
UNIT PLANS
Section 3.3 – Order of Operations (pp. 108-113) ELABORATIONS & SUGGESTED PROBLEMS Specific Curriculum Outcome(s) and Achievement Indicator(s) addressed:
N1 (D E G)
N2 (A B C D E)
N4 (A B C)
After this lesson, students will be expected to:
use the order of operations on expressions with powers
apply the laws of exponents
Literacy Links:
POSSIBLE INSTRUCTIONAL & ASSESSMENT STRATEGIES Possible Instructional Strategies:
Some students may benefit by using the acronym BEDMAS as a guide in simplifying expressions which involve the order of operations.
Encourage students to complete only one step at a time and show their work.
Ensure that students have checked their calculators for the proper keying sequence that models the correct order of operations. Some calculators require additional bracketing for the correct answer.
Students should demonstrate an understanding of exponent laws through explanations of inappropriate use of exponent laws, such as
Coefficient – A coefficient is a number that multiplies an expression. In 5 4 , the 2
2 3 2
coefficient is –5.
Order of Operations – The order of operations is brackets exponents (powers) divide and multiply in order from left to right add and subtract in order from left to right
23 36.
Possible Assessment Strategies:
Using a calculator, convert the following Fahrenheit temperatures to Celsius, using the formula 5 C F 32 . Round off the answer to one 9 decimal place, where necessary. a. 100F b. –150F c. 680F
Use the laws of exponents to simplify and evaluate:
Suggested Problems in MathLinks 9:
3
pp. 111-113: #1-11, 14, 15, 18, Math Link
a.
3 2
b.
1 3
4
2
22
Yvan made an error in simplifying the following expression. Find the mistake, show the correct procedure and determine the correct answer.
15 5
4
2 5 3 22 5 2 2
4
81 4 25 110
Use a calculator to simplify the expression 56.3 22.5 . Round off the answer to two 4.2 10.5 5.9 decimal places.
PRINCE EDWARD ISLAND GRADE 9 MATHEMATICS CURRICULUM GUIDE
As an extension, simplify the following expression: 1 3 5 10 2 5 1 2 1 4 5
Page 86
UNIT PLANS
Section 3.4 – Using Exponents to Solve Problems (pp. 114-119) ELABORATIONS & SUGGESTED PROBLEMS Specific Curriculum Outcome(s) and Achievement Indicator(s) addressed:
N1 (A D)
N2 (A B)
N4 (A B)
POSSIBLE INSTRUCTIONAL & ASSESSMENT STRATEGIES Possible Instructional Strategies:
Some students may have a difficult time with a variable as an exponent. Develop several concrete examples before introducing the variable exponent.
As a class, develop a formula for when the population would triple each year. This will provide some scaffolding to assist students in solving problems that involve exponential expressions.
Encourage students to use repeated multiplication and extend the pattern before writing the expression in exponential form.
After this lesson, students will be expected to:
solve problems that require combining powers
use powers to solve problems that involve repeated multiplication
Suggested Problems in MathLinks 9:
pp. 118-119: #1-7, 9, 11, Math Link
Possible Assessment Strategies:
PRINCE EDWARD ISLAND GRADE 9 MATHEMATICS CURRICULUM GUIDE
Jim lives in the downtown area of a city where the houses are very close together. He wants to paint a window on the second floor. The window sill is 3.5 m above the ground. The only ladder available is 5 m long. The space between the houses is only 2 m, and the window is on the side of the house. a. If he places a ladder at the height of the window sill, how far away from the house will the base of the ladder need to be? Round off the answer to one decimal place. b. If he places the ladder as far away from the from the house as the house next door will allow, how far up the side of the house will the ladder reach? Round off the answer to one decimal place. c. Does the length of the ladder make it suitable for painting the window?
Page 87
UNIT PLANS
PRINCE EDWARD ISLAND GRADE 9 MATHEMATICS CURRICULUM GUIDE
Page 88
UNIT PLANS
CHAPTER 4 SCALE FACTORS AND SIMILARITY
SUGGESTED TIME 21 classes
PRINCE EDWARD ISLAND GRADE 9 MATHEMATICS CURRICULUM GUIDE
Page 89
UNIT PLANS
Section 4.1 – Enlargements and Reductions (pp. 130-138) ELABORATIONS & SUGGESTED PROBLEMS Specific Curriculum Outcome(s) and Achievement Indicator(s) addressed:
identify enlargements and reductions, and interpret the scale factor
draw enlargements and reductions to scale
After this lesson, students should understand the following concepts:
Possible Instructional Strategies:
Have students discuss and make notes about what a scale factor of 1, less than 1 and greater than 1 means.
Use an overhead and apply a scale factor of 1, less than 1 and greater than 1 to an image. For each image, have students identify whether it is an enlargement, a reduction or neither, and then make a connection to the scale factor used to create the image.
Have students verbalize the meaning of scale factor. You might ask students to calculate the magnification for different objective lenses in a microscope. Prompt students to observe that as the magnification (scale factor) increases, the image is enlarged.
Encourage students to use scale factors that are natural numbers to describe enlargements and reductions. This may help them to understand, for example, that a scale factor of 2 means that the image is twice as large as the original.
Encourage students to reference an example of an enlargement or reduction to help explain how to determine the scale factor.
SS4 (A B C)
After this lesson, students will be expected to:
POSSIBLE INSTRUCTIONAL & ASSESSMENT STRATEGIES
enlargement – an increase in the dimensions of an object by a constant factor; can be 2-D or 3-D; for example, each dimension of this enlargement is twice the length of the original
scale factor – the constant factor by which all dimensions of an object are enlarged or reduced in a scale drawing; the dimensions of this rectangle are multiplied by 3, so the scale factor is 3
reduction – a decrease in the dimensions of an object by a constant factor; can be 2-D or 3-D; each dimension of this reduction is half the length of the original
Possible Assessment Strategies:
Draw an enlargement of the flag of the Czech Republic using a scale factor of 3.
For the second image, is the scale factor equal to 1? greater than 1? less than 1? Explain how you know.
Explain how you could determine if Figure B is an accurate enlargement of Figure A.
Problems in MathLinks 9:
pp. 135-138: #1-9, 11, 13, Math Link
Figure A
PRINCE EDWARD ISLAND GRADE 9 MATHEMATICS CURRICULUM GUIDE
Figure B
Page 90
UNIT PLANS
Section 4.2 – Scale Diagrams (pp. 139-145) ELABORATIONS & SUGGESTED PROBLEMS Specific Curriculum Outcome(s) and Achievement Indicator(s) addressed:
POSSIBLE INSTRUCTIONAL & ASSESSMENT STRATEGIES Possible Instructional Strategies:
Remind students to convert to the same units when determining the scale factor. Some students may need a reminder about the difference in expressing a ratio and a proportion.
Some students may need help to review whether to divide or multiply to find the missing value in a proportion.
Show students who struggle with the concept of scale an actual set of objects, in which one is double the size of the other. Have students verbalize what double the size means.
If the picture of an object is given with the actual object, determine the scale factor. For example, take a picture in class with a group of students and then measure the height of one of the students. Have students determine the scale factor present, and then use it to determine the heights of the others in the picture.
Students can be given a 2-D shape on graph paper and then asked to come up with a procedure to either reduce or enlarge the diagram.
SS4 (C D)
After this lesson, students will be expected to:
identify scale diagrams and interpret the scale factor
determine the scale factor for scale diagrams
determine if a given diagram is proportional to the original shape
After this lesson, students should understand the following concepts:
scale – a comparison between the actual size of an object and the size of its image; can be represented as a ratio, as a fraction, as a percent, in words, or in a diagram; for example, the scale 1: 32 means that 1 cm on a diagram represents 32 cm on the actual object
scale diagram – a drawing that is similar to the actual figure or object; may be smaller or larger than the actual object, but must be in the same proportions
Literacy Link:
An actual laptop has a width of 42 cm. Determine the scale factor used in the image of the laptop.
A driving distance is 600 km. The distance shown on a map is 4 cm. a. Express the map scale in words. b. What is the scale factor? Express the answer as a fraction.
Calculate the missing value in each proportion.
Proportion – A proportion is a relationship that shows two ratios are equal. It can be written in fraction form or in ratio form. For example, the ratio 1 girl to 4 students is the same as 5 girls to 1 5 20 students. As a proportion, write or 4 20 1: 4 5 : 20. The corresponding parts of each ratio are in the same units.
Suggested Problems in MathLinks 9:
Possible Assessment Strategies:
pp. 142-145: #1-12, three of 13-18, 19, Math Link
PRINCE EDWARD ISLAND GRADE 9 MATHEMATICS CURRICULUM GUIDE
a.
1 x 8 624
b.
1 25.2 50 y
c.
1 15.3 z 1224
Page 91
UNIT PLANS
Section 4.3 – Similar Triangles (pp. 146-153) ELABORATIONS & SUGGESTED PROBLEMS Specific Curriculum Outcome(s) and Achievement Indicator(s) addressed:
POSSIBLE INSTRUCTIONAL & ASSESSMENT STRATEGIES Possible Instructional Strategies:
Some students may benefit from tracing the triangles to compare angles and sides or to use tick marks or dashes to identify the corresponding angles and sides. This may help in setting up the ratios.
Some students may find it helpful to redraw a diagram containing two triangles as two separate triangles. Students may also find it helpful to redraw the triangles so that the orientations are the same.
SS4 (E)
After this lesson, students will be expected to:
determine similar triangles
determine if diagrams are proportional
solve problems using the properties of similar triangles
After this lesson, students should understand the following concepts:
corresponding angles and corresponding sides – have the same relative position in geometric figures A D
B
Possible Assessment Strategies:
Triangle ABC has vertices A(3,7), B(7,7) and C(3,10). Triangle DEF has vertices D(–1, 4), E(–9,4) and F(–1,10). Determine the scale factor.
The two triangles in the following diagram are similar. Determine the width of the river. Round off the answer to the nearest tenth.
Use similar triangles to find the height of the tree.
Determine if these two triangles are similar.
C
E F For these triangles, the corresponding angles are:
A and D
B and E
C and F
and the corresponding sides are: AB and DE BC and EF AC and DF
similar figures – have the same shape but different size; have equal corresponding angles and proportional corresponding sides
Literacy Link:
Notation – The symbol ~ means “is similar to.” For example, ABC ~ EFG reads as “triangle ABC is similar to triangle EFG.”
4
5
5.4
3 9 7.2
Suggested Problems in MathLinks 9:
pp. 150-153: #1-11, two of 12-15, Math Link
PRINCE EDWARD ISLAND GRADE 9 MATHEMATICS CURRICULUM GUIDE
Page 92
UNIT PLANS
Section 4.4 – Similar Polygons (pp. 154-159) ELABORATIONS & SUGGESTED PROBLEMS Specific Curriculum Outcome(s) and Achievement Indicator(s) addressed:
POSSIBLE INSTRUCTIONAL & ASSESSMENT STRATEGIES Possible Instructional Strategies:
Consider the following strategies when planning lessons: Concrete materials will support understanding of comparison of corresponding angles. Promote reasoning strategies where students have to prove that polygons have equal corresponding angles and proportional sides. Polygons of differing levels of difficulty can be presented to extend student thinking. Constructing polygons on grid paper and then copying the same polygon on to larger or smaller grid paper will create a similar figure. Technology can facilitate constructions by using the tools for enlarging and reducing figures.
It is important that students understand that there are two conditions are necessary for polygons to be similar – angles must be equal in measure and side lengths must be proportional. Contrast that with triangles for which only one of these conditions is necessary to prove similarity.
Some students may benefit from tracing similar polygons to compare angles and sides.
Some students may benefit from verbalizing how to determine if the polygons are similar.
Ensure students understand that the order in which they write their proportions must be consistent. For example, small to large in the first polygon equals small to large in the second polygon.
Rectangles can be tested for similarity in the following way: Place two rectangles on top of each other with the smaller one fitting in to a corner of the larger one. Draw the diagonal of the larger rectangle and if it passes through both shapes and is also the diagonal of the smaller rectangle, then the rectangles are similar.
Present a set of polygons of the same shape that have a variety of sizes and orientations, and ask students to sort them by identifying those that are similar.
SS3 (A B C)
After this lesson, students will be expected to:
identify similar polygons and explain why they are similar
draw similar polygons
solve problems using the properties of similar polygons
After this lesson, students should understand the following concept:
polygon – a two-dimensional closed figure made of three of more line segments
Literacy Links:
Notation – M is read “M prime.”
Regular Polygon – A regular polygon has all sides equal and all angles equal.
Suggested Problems in MathLinks 9:
pp. 157-159: #1-7, two of 8-12, Math Link
Possible Assessment Strategies:
A photograph measuring 12.5 cm by 17.5 cm needs to be enlarged by a ratio of 1.5. What will be the new dimensions of the photograph?
A baseball coach wants to have the diagram of a baseball diamond that is similar to a real baseball diamond. A real baseball diamond is a square with side lengths of 27.4 m. Construct the diagram using a ratio of 1: 0.005.
PRINCE EDWARD ISLAND GRADE 9 MATHEMATICS CURRICULUM GUIDE
Page 93
UNIT PLANS
PRINCE EDWARD ISLAND GRADE 9 MATHEMATICS CURRICULUM GUIDE
Page 94
UNIT PLANS
CHAPTER 5 INTRODUCTION TO POLYNOMIALS
SUGGESTED TIME 16 classes
PRINCE EDWARD ISLAND GRADE 9 MATHEMATICS CURRICULUM GUIDE
Page 95
UNIT PLANS
Section 5.1 – The Language of Mathematics (pp. 174-182) ELABORATIONS & SUGGESTED PROBLEMS Specific Curriculum Outcome(s) and Achievement Indicator(s) addressed:
POSSIBLE INSTRUCTIONAL & ASSESSMENT STRATEGIES Possible Instructional Strategies:
Have students underline the prefixes of each type of polynomial to help them focus on the link to the number of terms.
Remind student that the degree is linked to the variable, which is why a number or value that is constant has a degree of zero.
Show an algebra-tile model and ask for its matching expression, or give an expression and have students model it. Ensure that all students understand the relationship between the algebratile model and the symbolic approach. A conversion chart is shown:
PR5 (A B C D E)
After this lesson, students will be expected to:
use mathematical terminology to describe polynomials
create a model for a given polynomial expression
After this lesson, students should understand the following concepts:
algebra – a branch of mathematics that uses symbols to represent unknown numbers or quantities
term – an expression formed by the product of numbers and/or variables; 9x is a term representing the product of 9 (coefficient) and x (variable); a constant value, such as 5, is also a term
polynomial – an algebraic expression made up of terms connected by the operations of addition or subtraction; 3 x 2 4 has two terms, 3 x 2 and 4 are connected by the operation of addition.
x2
x
1
x 2
–x
–1
Possible Assessment Strategies:
degree of a term – the sum of the exponents on the variables in a single term (monomial); for example, 3xz, or 3 x1z1, has degree 2, since
Write an expression, in compact form, for each of the following. a.
1 1 2; 5 x 2 y and 2b 3 are terms of degree 3
degree of a polynomial – the degree of the highest-degree term in a polynomial; in 7a 2 3a the degree of the first term is 2, and the degree of the second term is 1, so the degree of the polynomial is 2
b.
Literacy Links:
Types of Polynomials – Some polynomials have specific names: Monomial – one term Binomial – two terms Trinomial – three terms All expressions with one or more terms are called polynomials. Polynomial means many terms. Writing Polynomials – When a term has more than one variable, the variables are usually written in alphabetical order. Examples are 5ab and 12 x 2 y 3 .
b
b a b
b.
b
b
a
Suggested Problems in MathLinks 9:
Write an expression that is as compact as possible for the perimeter of each of the following figures. a. a b b
pp. 178-182: #1-15, 17-26, Math Link
PRINCE EDWARD ISLAND GRADE 9 MATHEMATICS CURRICULUM GUIDE
a
Create a polynomial expression for each of the following descriptions. a. a polynomial of degree 2, with a constant of –4 b. a binomial with a coefficient of 4 c. a binomial with no constant term
Page 96
UNIT PLANS
Section 5.2 – Equivalent Expressions (pp. 183-189) ELABORATIONS & SUGGESTED PROBLEMS Specific Curriculum Outcome(s) and Achievement Indicator(s) addressed:
POSSIBLE INSTRUCTIONAL & ASSESSMENT STRATEGIES Possible Instructional Strategies:
Encourage students to write symbolic expressions for each concrete model they build. Always match symbols to models.
It is important that students learn that algebra tiles can represent any variable, not only x.
Students may be successful in simplifying expressions, but make sign errors in writing the final expression. It may be beneficial to review the effects the operational sign has on a term that is being rewritten. As an example, 4 3 x can be rewritten as 3 x 4.
PR6 (C D E)
After this lesson, students will be expected to:
use algebra tiles and diagrams to show whether expressions are equivalent
identify equivalent expressions that are polynomials
combine like terms in algebraic expressions
After this lesson, students should understand the following concept:
like terms – terms that differ only by their numerical coefficients; examples of like terms are 3x and –2x, 6 y 2 and 4 y 2 , –5xy and yx, and 17 and –8
Literacy Links:
Writing Terms – Even if a term has two variables, it always only has one coefficient. For example, a term would be written as 6 xy , not as 2 x 3 y .
Coefficients of 1 and –1 – Any term with a variable having a coefficient of 1 can be written without its numerical coefficient. However, the sign must remain. Examples are: 1x x
Possible Assessment Strategies:
1x x
b.
4 p 5 p 3 p
A rectangular flower garden has a length of 8 cinder blocks and a width of 9 bricks. a. Find an expression for the perimeter of the flower garden. b. Find the perimeter of the flower garden when each cinder block is 25 cm long and each brick is 15 cm long.
Determine whether each pair of polynomials is equal or not equal. a.
3x x 2 2
x 2 3x 2
b.
7 2x x 2
x 2 2x 7
c.
3x 5
5 3x
2
1x x Coefficients without a sign are positive. 2
2 p 3q p 4q
1x x 2
Simplify: a.
2
Descending Order – In algebra, terms are often arranged in descending order by degree. For example, 3 y 4 y 2 1 is written as 4 y 2 3 y 1
Determine the perimeter of each of the following polygons. 2n 1
a.
or 4 y 2 3 y 1. This makes it easier to compare expressions. Answers are usually written in this way.
n3
Suggested Problems in MathLinks 9:
5y 4
b.
pp. 187-189: #1-13, 15-17, 19-22, Math Link
x 2x 3 3y 1
PRINCE EDWARD ISLAND GRADE 9 MATHEMATICS CURRICULUM GUIDE
Identify the like terms: 5 x 2 , 3xy, 2 x 2 , 2x
Page 97
UNIT PLANS
Section 5.3 – Adding and Subtracting Polynomials (pp. 190-199) ELABORATIONS & SUGGESTED PROBLEMS Specific Curriculum Outcome(s) and Achievement Indicator(s) addressed:
POSSIBLE INSTRUCTIONAL & ASSESSMENT STRATEGIES Possible Instructional Strategies:
When subtracting polynomials, remind students that they are adding the opposite of each of the terms of the second polynomial, not just its first term, which is a common mistake.
Show students that they can check subtraction by using addition (a b c can be checked using the addition c b a ). This technique is preferable to repeating the subtraction.
PR6 (A B C)
After this lesson, students will be expected to:
add polynomial expressions
subtract polynomial expressions
solve problems using the addition and subtraction of polynomials
Suggested Problems in MathLinks 9:
Possible Assessment Strategies:
pp. 195-199: #1-20, 24, Math Link
Write each of the steps in the problems which follow, using symbols, and explain each step. a. +
b. –
+
Simplify each of the following, using your own strategy. a. b.
2x 5 x 3 x 2x 3m 2mn 4 m 2 2
2
2
2
Determine the errors in the student’s work:
2x
2
3x 2 x 2 x 1
2x 3 x 2 x x 1 2
2
x 2 2x 1
PRINCE EDWARD ISLAND GRADE 9 MATHEMATICS CURRICULUM GUIDE
Page 98
UNIT PLANS
CHAPTER 6 LINEAR RELATIONS
SUGGESTED TIME 16 classes
PRINCE EDWARD ISLAND GRADE 9 MATHEMATICS CURRICULUM GUIDE
Page 99
UNIT PLANS
Section 6.1 – Representing Patterns (pp. 210-219) ELABORATIONS & SUGGESTED PROBLEMS Specific Curriculum Outcome(s) and Achievement Indicator(s) addressed:
POSSIBLE INSTRUCTIONAL & ASSESSMENT STRATEGIES Possible Instructional Strategies:
Provide students with the opportunity to explore various patterns by explaining each pattern using words and writing an equation to represent a situation. For example, the relationship between the number of bricks, b, around a square fire pit and side lengths, s, is represented by the equation b 4s 4.
Students should be able to develop the ability to write equations for situations which are described in words. For example, Ralph rents snowboards for $10.50 per hour, but requires a $25 non-refundable deposit. Write an equation that shows the relationship between c, the cost and h, the number of hours. Students should be able to calculate the total cost as equal to $25 deposit + $10.50 per hour, written as c 25 10.50h.
PR1 (A B C D E)
After this lesson, students will be expected to:
represent pictorial, oral and written patterns with linear equations
describe contexts for given linear equations
solve problems that involve pictorial, oral and written patterns using a linear equation
verify linear equations by substituting values
Literacy Links:
Linear Relation – A linear relation is a relation that appears as a straight line when graphed. y 6 4 2
Possible Assessment Strategies: x 0
4
6
Reading Linear Equations – In the equation s 3n 2,
2
3 is a numerical coefficient; s and n are variables; –2 is a constant.
Regular Heptagon – A regular heptagon has seven sides of equal length.
For each of the following equations, make a table of values. Analyse the table of values to determine whether the equation represents a graph that is linear or non-linear. a.
y 4x 3
b.
y 3x 2
c.
y 7x 4
Write a linear equation to represent the pattern in the given table of values. Describe a context for the equation.
Suggested Problems in MathLinks 9:
x
y
1
10.50
2
11.00
3
11.50
4
12.00
pp. 216-219: #1-13, Math Link
PRINCE EDWARD ISLAND GRADE 9 MATHEMATICS CURRICULUM GUIDE
Your class is planning a trip to the zoo. The school will have to pay $200 for the bus plus $5 per student. How much will it cost for 32 students?
Page 100
UNIT PLANS
Section 6.2 – Interpreting Graphs (pp. 220-230) ELABORATIONS & SUGGESTED PROBLEMS Specific Curriculum Outcome(s) and Achievement Indicator(s) addressed:
POSSIBLE INSTRUCTIONAL & ASSESSMENT STRATEGIES Possible Instructional Strategies:
Discuss that estimating from a graph is useful when an exact value is not necessary, and using an equation is useful when a more precise answer is required.
Encourage students who need help to interpolate and extrapolate values to use a ruler and draw a vertical line from the x-axis to the graphed line, and then draw a horizontal line to the y-axis.
Ensure that students understand the difference between discrete and continuous data.
Check that students understand when it is reasonable to use interpolation or extrapolation and when it is not reasonable. Remind students that both are used to estimate values.
Provide students with various graphs and linear relations and ask them to match the graph with the equation.
PR2 (B D E F)
After this lesson, students will be expected to:
describe patterns found in graphs
extend graphs to determine an unknown value
estimate values between known values on a graph
estimate values beyond known values on a graph
After this lesson, students should understand the following concepts:
interpolate – estimate a value between two given values; interpolation should be used only when it makes sense to have values between given values; for example, an interpolation of 5.4 people does not make sense extrapolate – estimate a value beyond a given set of values; extrapolation should be used only when it makes sense to have values beyond given values
Possible Assessment Strategies:
Given the following graph, describe the pattern and write the equation. Describe a situation that could result in the graph.
Mary is getting in shape. The first day she does 9 sit-ups, the second day she does 13, the third day 17, and so on. Write an equation to represent this situation. If she continues in this way, how many sit-ups will she do on the 15th day? the 25th day? It is reasonable to continue this pattern forever?
Literacy Links:
Commission – Commission is a form of payment for services. Salespeople who earn commissions are paid a percent of their total sales. For example, a clothing store might pay a commission of 10% of sales.
Continuous Graph – On a graph, a line joining the points shows that the data are continuous. This means that it is reasonable to have values between the given data points.
Describing Variables – When describing variables on a graph, express the y-variable in terms of the x-variable.
Suggested Problems in MathLinks 9:
pp. 226-230: #1-11, 13-15, Math Link
PRINCE EDWARD ISLAND GRADE 9 MATHEMATICS CURRICULUM GUIDE
Page 101
UNIT PLANS
Section 6.3 – Graphing Linear Relations (pp. 231-243) ELABORATIONS & SUGGESTED PROBLEMS Specific Curriculum Outcome(s) and Achievement Indicator(s) addressed:
POSSIBLE INSTRUCTIONAL & ASSESSMENT STRATEGIES Possible Instructional Strategies:
Encourage students to explain how to determine whether a graph and an equation represent the same relationship.
Encourage students to use the table of values to help determine the coefficient and constant values in an equation. Check that students are able to derive the equation using this method.
Ensure that students understand the difference between the graphs for a vertical line and a horizontal line, together with their corresponding equations.
Direct students to make sure they title and label the axes on graphs to assist them in making connections between the different representations and interpreting the solutions.
PR2 (A C D E G)
After this lesson, students will be expected to:
graph linear relations
match equations of linear relations with graphs
solve problems by graphing a linear relation and analysing the graph
Literacy Link:
Expressing Quantities – Certain quantities, such as 35 m below the surface, can be expressed in different ways. In a table and a graph, use the negative value, –35.
Suggested Problems in MathLinks 9:
pp. 238-243: #1-13, Math Link
Possible Assessment Strategies:
You have just purchased a new cell phone. The phone plan costs $10 per month and $0.15 per text message. Create a graph to represent the situation. Use your graph to determine the cost of sending 100 text messages.
A taxi cab charges the rates shown in the accompanying table:
Length of Trip (km)
5
10
15
Total Cost ($)
9.25
15.50
21.75
a. b. c. d. e. f.
Use the graph to answer the following questions.
a. b. c. d.
PRINCE EDWARD ISLAND GRADE 9 MATHEMATICS CURRICULUM GUIDE
Plot these points on a coordinate plane. Determine if these points should be joined. Determine the equation. Explain why the graph does not start at the origin. Using the graph, find the length of a trip which costs $25. Using the graph, find the cost of a 12-km trip.
Create a table of values. Describe the pattern found in the graph. Describe a situation that the graph might represent. Write a linear equation for the graph.
Page 102
UNIT PLANS
CHAPTER 7 MULTIPLYING AND DIVIDING POLYNOMIALS
SUGGESTED TIME 18 classes
PRINCE EDWARD ISLAND GRADE 9 MATHEMATICS CURRICULUM GUIDE
Page 103
UNIT PLANS
Section 7.1 – Multiplying and Dividing Monomials (pp. 254-263) ELABORATIONS & SUGGESTED PROBLEMS Specific Curriculum Outcome(s) and Achievement Indicator(s) addressed:
POSSIBLE INSTRUCTIONAL & ASSESSMENT STRATEGIES Possible Instructional Strategies:
Encourage students to model the problems using algebra tiles, particularly those who experience difficulty working with the algebraic approach. In this way, they can compare their algebraic response to their model to verify the answer.
Remind students that the sign rules for multiplying and dividing monomials with positive and negative signs are the same as those used for multiplying and dividing integers.
Reinforce the concept that when opposite-signed tiles are used in the area model, the inside of the rectangle will always be negative.
Students need to understand that when two different variables are involved in the monomials, the exponent rules cannot be applied.
PR7 (A B C D E)
After this lesson, students will be expected to:
multiply a monomial by a monomial
divide a monomial by a monomial
Literacy Links:
Monomial – A monomial has one term. For n4 are all example, 5, 2x, 3s 7 , –8cd and 3 monomials. Inscribed Circle – An inscribed circle fits exactly into another figure so that the edges of the two figures touch, but do not intersect.
Suggested Problems in MathLinks 9:
pp. 259-263: #1-19, Math Link
Possible Assessment Strategies:
PRINCE EDWARD ISLAND GRADE 9 MATHEMATICS CURRICULUM GUIDE
Find the product of each pair of monomials. a.
4n 3n
b.
5k 2k
c.
5 x 6y
Find the quotient of each pair of monomials. a.
16 x 3 8 x
b.
24 y 4 12y 3
c.
18ab 3b
Page 104
UNIT PLANS
Section 7.2 – Multiplying Polynomials By Monomials (pp. 264-271) ELABORATIONS & SUGGESTED PROBLEMS Specific Curriculum Outcome(s) and Achievement Indicator(s) addressed:
POSSIBLE INSTRUCTIONAL & ASSESSMENT STRATEGIES Possible Instructional Strategies:
Ensure that all students understand the relationship between the rectangle dimensions and the polynomials they represent, as well as the rectangle area and the polynomial product it represents.
You may wish to use the term distribute at this early stage and carry through with it throughout the chapter. Tell students that they distribute by multiplying the monomial by each term in the polynomial. Then can then apply this method throughout the chapter.
PR7 (A C D E)
After this lesson, students will be expected to:
multiply a polynomial by a monomial
Literacy Links:
Distributive Property – The distributive property allows you to expand algebraic expressions. Multiply the monomial by each term in the polynomial. a b c ab ac
To model 3 2 x 1 , repeated addition could be used:
Binomial – A binomial is a polynomial with two terms, such as 6 y 2 3 or 3 x 5.
Suggested Problems in MathLinks 9:
pp. 268-271: #1-13, 15, 16, Math Link
Possible Assessment Strategies:
Write the dimensions and area for the rectangle shown.
Draw a rectangle to show the area represented by each product, and then record the solution using symbols. a.
length x 1, width 4
b.
length 2x, width 3x
Determine the error in the multiplication problem 4m m 2 4m 2 2 and correct the solution.
Use the distributive property to expand each expression.
a.
5m 2m 3
b.
n n 1
c.
1.3 x 2x 5
d.
m 2 3m
e.
4.1k 5.3 3k
The length of a cement pad on a playground is 3 m longer than the width. The width is 5x. a. Write an expression for the area of the cement pad. b.
PRINCE EDWARD ISLAND GRADE 9 MATHEMATICS CURRICULUM GUIDE
If x 2 m, what is the area of the cement pad? Page 105
UNIT PLANS
Section 7.3 – Dividing Polynomials By Monomials (pp. 272-277) ELABORATIONS & SUGGESTED PROBLEMS Specific Curriculum Outcome(s) and Achievement Indicator(s) addressed:
POSSIBLE INSTRUCTIONAL & ASSESSMENT STRATEGIES Possible Instructional Strategies:
PR7 (B C D E)
After this lesson, students will be expected to:
divide a polynomial by a monomial
Suggested Problems in MathLinks 9:
Ensure that all students understand the relationship between the algebra-tile components and the symbolic representation of polynomial division.
Possible Assessment Strategies:
pp. 275-277: #1-11, 14, Math Link
Consider the expression x 2 5 x. a.
Model x 2 5 x using algebra tiles.
b.
Create a rectangle where x is one of the dimensions. Identify the other dimension. Write a division sentence for the situation.
c. d.
The inside rectangle in the diagram below is a flower garden. The shaded area is a concrete walkway around it. The area of the flower garden is given by the expression 2 x 2 4 x, and the area of the large rectangle, including the walkway and the flower garden, is 3 x 2 6 x. 3x
x
a.
Use the information provided to find an expression for each of the missing dimensions of each rectangle. Find the dimensions and the area of the flower garden if x 2.3 m.
b.
Find the area of the walkway if x 2.3 m.
c.
Consider the following. Evaluate the expression
b.
Perform the division and evaluate the simplified expression for x 6.
c. d.
Compare the two results. What do you notice? Was it easier to evaluate the expression before or after the division? Explain.
Find the missing terms in the multiplication problem 3x
PRINCE EDWARD ISLAND GRADE 9 MATHEMATICS CURRICULUM GUIDE
2x 2 6 x for x 6. 2x
a.
4 6x 2
.
Determine the error in the division problem 12y 6 2y and correct the solution. 6
Page 106
UNIT PLANS
CHAPTER 8 SOLVING LINEAR EQUATIONS
SUGGESTED TIME 17 classes
PRINCE EDWARD ISLAND GRADE 9 MATHEMATICS CURRICULUM GUIDE
Page 107
UNIT PLANS
Section 8.1 – Solving Equations: ax b, ELABORATIONS & SUGGESTED PROBLEMS Specific Curriculum Outcome(s) and Achievement Indicator(s) addressed:
POSSIBLE INSTRUCTIONAL & ASSESSMENT STRATEGIES Possible Instructional Strategies:
Use diagrams and concrete materials to help students understand the steps needed to solve a linear equation.
When solving equations, it may be necessary to review why, when a decimal number is in the denominator of a coefficient, we multiply by that decimal number. As an example, show them that m 1 10 is the same as m 10. You multiply by 3 3 m the reciprocal. Link this to the fact that 25 is 2.4 1 the same as m 25. To clear out the 2.4 denominator, you multiply by 2.4.
Review the concept of opposites and perhaps have students write in one extra step when copying their 137.2 is the same equations to show that 13.4 t 1 as 13.4 137.2. It makes it visually easier to t see the multiplicative inverse, or the reciprocal, of t.
Some students may benefit from identifying the value of each variable before attempting to solve a written problem. This may assist students in linking the equation to the values, thereby facilitating student success.
PR3 (A B C E F)
After this lesson, students will be expected to:
model problems with linear equations that can be solved using multiplication and division
solve linear equations with rational numbers using multiplication and division
Literacy Links:
Equation – An equation is a statement that two mathematical expressions have the same value. y Examples of equations include 3 x 2, 1 and 2 z 2.7. In the equation 1.2d 3.5 1.6,
d is the variable, which represents an unknown number; 1.2 is a numerical coefficient; which multiplies the variable, and 3.5 and –1.6 are constants.
Opposite Operations – An opposite operation “undoes” another operation. Examples of opposite operations are addition and subtraction; multiplication and division. Opposite operations are also called inverse operations. Regular Polygon – A regular polygon has equal sides and equal angles. For example, a regular pentagon has five equal sides. Each angle measures 1080.
1080
Possible Assessment Strategies:
0
108 1080
1080
1080
Suggested Problems in MathLinks 9:
x a b, b (pp. 292-303) a x
pp. 301-303: #1-12, 14, 17, 19, 23, Math Link
PRINCE EDWARD ISLAND GRADE 9 MATHEMATICS CURRICULUM GUIDE
Your school is selling almonds as a fund-raiser. The almonds sell for $1.00 per box, and the school receives 40% of the proceeds. How many boxes must be sold in order for the school to make $12,000. Solve each of the following equations a.
3 x 0.6
b.
m 0.15 5
c.
0.32 0.08 p
Page 108
UNIT PLANS
Section 8.2 – Solving Equations: ax b c , ELABORATIONS & SUGGESTED PROBLEMS Specific Curriculum Outcome(s) and Achievement Indicator(s) addressed:
POSSIBLE INSTRUCTIONAL & ASSESSMENT STRATEGIES Possible Instructional Strategies:
PR3 (A B C D E F)
After this lesson, students will be expected to:
model problems with linear equations involving two operations
solve linear equations with rational numbers using two operations
Some students may need to be directed to find key words in word problems to assist them in identifying the relevant parts to be used to design an equation.
Possible Assessment Strategies:
Solve each of the following equations. a.
x 1 5 2 3 6
b.
5t 0.20 0.60
c.
x 1 3 1 2 6
Suggested Problems in MathLinks 9:
x b c (pp. 304-313) a
pp. 310-313: #1-13, 15, 16, 19, Math Link
Brenda and Rob both want to buy a portable CD player which costs $135. Brenda has $45 and saves $15 per week. Rob has $70 and saves $13 per week. Who will be able to buy the CD player first?
When a number is tripled, then increased by 13, the result is 82. Find the number.
The cost of a banquet at Nick’s Catering is $215 plus $27.50 per person. If the total cost of a banquet was $2827.50, how many people were invited?
Hyan has saved $300 more than two-thirds of the cost of the down payment on a used car. If he has $1240 saved, how much is the down payment?
PRINCE EDWARD ISLAND GRADE 9 MATHEMATICS CURRICULUM GUIDE
Page 109
UNIT PLANS
Section 8.3 – Solving Equations: a x b c (pp. 314-321) ELABORATIONS & SUGGESTED PROBLEMS Specific Curriculum Outcome(s) and Achievement Indicator(s) addressed:
POSSIBLE INSTRUCTIONAL & ASSESSMENT STRATEGIES Possible Instructional Strategies:
PR3 (A B C D E F)
After this lesson, students will be expected to:
model problems with linear equations that include grouping symbols on one side
solve linear equations that include grouping symbols on one side
3 y 5 , 4 g 2 and 2 a 4 .
Possible Assessment Strategies:
Literacy Links:
Distributive Property – The distributive property is a b c ab ac.
Fraction Bar – A fraction bar acts as a grouping symbol and as a division symbol. The expression t 1 1 can be written as t 1 or t 1 5. 5 5 Trapezoid – A trapezoid is a quadrilateral with exactly two parallel sides.
Suggested Problems in MathLinks 9: pp. 318-321: #1-12, 14, 15, 17, 20, 22, Math Link
You may want to check students’ understanding of the distributive property by asking them to remove the brackets from expressions such as 2 x 3 ,
Verify that the solution to each equation is correct. a.
3 x 5 18; x 11
b.
0.2 x 3 1.4; x 4
Solve each of the following equations. a.
2 x 4 12
b.
3 m 0.5 2.1
c.
1.2 x 1.3 2.4
d.
3 1 x 8 7 4 2
e.
x 14 1 2 4 2
f.
x 2 7 3 18
The perimeter of a square is 49.2 cm. The side length of the square is represented by the expression (x + 4.1) cm. What is the value of x?
Two cars leave Calgary at the same time, travelling in opposite directions. Their average speeds differ by 5 km/h. After 2 h, they are 210 km apart. Find the speed of each car.
PRINCE EDWARD ISLAND GRADE 9 MATHEMATICS CURRICULUM GUIDE
Page 110
UNIT PLANS
Section 8.4 – Solving Equations: ax b cx , ax b cx d ,
a bx c d ex f (pp. 322-329) ELABORATIONS & SUGGESTED PROBLEMS Specific Curriculum Outcome(s) and Achievement Indicator(s) addressed:
POSSIBLE INSTRUCTIONAL & ASSESSMENT STRATEGIES Possible Instructional Strategies:
Many students will find it easier to solve equations with integer values rather than fractions. Ask prompting questions to help students eliminate fractions in equations.
Remind students of the importance of checking their solution to an equation to verify that the left side and the right side of the equation are equal.
Students should be encouraged to identify multiple methods that they are comfortable with when solving equations; however, one solid method is sufficient.
PR3 (A B C D E F)
After this lesson, students will be expected to:
model problems with linear equations that include variables on both sides
solve linear equations that include variables on both sides
Suggested Problems in MathLinks 9:
pp. 326-329: #1-12, 14, 15, 18, 25, Math Link
Possible Assessment Strategies:
Each side of a quadrilateral is 2 cm longer than the preceding side. If the perimeter is 44 cm, what is the length of the longest side of the quadrilateral?
The length of a rectangle is 21 cm. The length is 1 cm more than twice the width. What is the width of the rectangle?
The perimeter of the rectangle below is 14 cm. Find the dimensions of the sides. 6 2x 2 x
PRINCE EDWARD ISLAND GRADE 9 MATHEMATICS CURRICULUM GUIDE
Solve and check. a.
3x 6 x 4
b.
3 2 z 7z 12 4z
c.
2 2s 1 6 2 s 3 3s 1 3
d.
1 b5 4b 2
The Guardian can be delivered to your house for $0.20 per copy plus a $25.00 delivery fee. The Globe and Mail can be delivered to your house for $0.30 per copy plus a $20.00 delivery fee. Determine how many copies need to be delivered in order for the two costs to be the same.
Page 111
UNIT PLANS
PRINCE EDWARD ISLAND GRADE 9 MATHEMATICS CURRICULUM GUIDE
Page 112
UNIT PLANS
CHAPTER 9 LINEAR INEQUALITIES
SUGGESTED TIME 11 classes
PRINCE EDWARD ISLAND GRADE 9 MATHEMATICS CURRICULUM GUIDE
Page 113
UNIT PLANS
Section 9.1 – Representing Inequalities (pp. 340-349) ELABORATIONS & SUGGESTED PROBLEMS Specific Curriculum Outcome(s) and Achievement Indicator(s) addressed:
represent single-variable linear inequalities verbally, algebraically and graphically
determine if a given number is a possible solution of a linear inequality
After this lesson, students should understand the following concepts:
Possible Instructional Strategies:
Explore the differences among the inequality symbols , , and and how to represent them on a number line.
Some students need extra experience with inequalities that have variables on the right side. Review the equivalent forms.
Discuss the differences and similarities between algebraic sentences such as 2 x 1 5 and 2 x 1 5.
PR4 (A B G)
After this lesson, students will be expected to:
POSSIBLE INSTRUCTIONAL & ASSESSMENT STRATEGIES
inequality – a mathematical statement comparing expressions that may not be equal; can be written using the symbols , , , or
Possible Assessment Strategies:
boundary point – separates the values less than from the values greater than a specified value; may or may not be a possible value in a solution an open circle shows that the boundary point is not included in the solution
1 2 0 a closed circle shows that the boundary point is included in the solution 0
1
a.
b.
3 3 7
c.
0.345 0.34
Write an inequality for each of the following graphs. a. –6
–4
–2
0
2
4
6
–6
–4
–2
0
2
4
6
–6
–4
–2
0
2
4
6
b.
c.
Suggested Problems in MathLinks 9:
3 5
1 2 0 Algebraically, using mathematical symbols. For example, x 0.75.
Metric Tonne (t) – A metric tonne is a measurement of mass that equals 1000 kg.
In the last history test, Jane’s grade was more than a passing grade (50%) and less than an A– (80%). a. Represent Jane’s possible grade on the test, using a number line. b. In the next test, she increased her grade by 10%. Represent Jane’s possible grade on the second test, using a number line.
2
Representing an Inequality – Inequalities can be expressed in three ways: Verbally, using words. For example, “all numbers greater than or equal to 0.75.” Graphically, using visuals, such as diagrams and graphs. For example,
2
Literacy Links:
Replace each with a digit to make each sentence true. Explain why your choice is correct.
pp. 346-349: #1-17, 19, 21, Math Link
PRINCE EDWARD ISLAND GRADE 9 MATHEMATICS CURRICULUM GUIDE
Represent each of the following using a number line. a. all integers that are greater than 5 b. all real numbers that are less than or equal to
Page 114
UNIT PLANS
Section 9.2 – Solving Single-Step Inequalities (pp. 350-359) ELABORATIONS & SUGGESTED PROBLEMS Specific Curriculum Outcome(s) and Achievement Indicator(s) addressed:
POSSIBLE INSTRUCTIONAL & ASSESSMENT STRATEGIES Possible Instructional Strategies:
PR4 (A B C D E F G H J)
After this lesson, students will be expected to:
solve single-step linear inequalities and verify solutions
compare the processes for solving linear equations and linear inequalities
compare the solutions of linear equations and linear inequalities
solve problems involving single-step linear inequalities
After this lesson, students should understand the following concept:
Possible Assessment Strategies:
solution of an inequality – a value or set of values that satisfies an inequality; the solution set can contain many values
Suggested Problems in MathLinks 9:
Have students start with a statement they know to be true, such as 5 2. Have them apply the operations of addition, subtraction, multiplication and division of to both sides of the inequality. Use the outcomes of this activity to generalize rules for solving inequalities.
pp. 356-359: #1-18
List three values that would make each inequality or combination of inequalities true. a.
x 4
b.
x 3
c.
x 2 and x 5
Solve each inequality. a.
x 5 12
b.
2 x 9
c.
7.4 x 6.2
d.
x 4.2 3.5
e.
4 x 16
f.
1.3 x 16.9
Write and solve an inequality to determine the values of x that give the rectangle shown an area of no more than 25 square units. Are there values of x that would not be possible for the length of the rectangle? Explain.
5
x2
PRINCE EDWARD ISLAND GRADE 9 MATHEMATICS CURRICULUM GUIDE
Page 115
UNIT PLANS
Section 9.3 – Solving Multi-Step Inequalities (pp. 360-367) ELABORATIONS & SUGGESTED PROBLEMS Specific Curriculum Outcome(s) and Achievement Indicator(s) addressed:
POSSIBLE INSTRUCTIONAL & ASSESSMENT STRATEGIES Possible Instructional Strategies:
PR4 (A E I J)
Have students model inequalities using concrete objects or diagrams of a tipped balance.
After this lesson, students will be expected to:
Possible Assessment Strategies:
solve multi-step linear inequalities and verify their solutions
compare the processes for solving linear equations and linear inequalities
solve problems involving multi-step linear inequalities
Verify whether 14, 9, 2, 1, 3, 5, 9 are solutions to the inequality 2 x 5 7. Solve the inequality and graph the solution on a number line. Check to determine how many of the numbers from the set would be part of the graphical solution.
Suggested Problems in MathLinks 9:
Taylor received 77%, 70%, 81% and 78% on her first four mathematics tests. What mark will she need to get on the fifth test in order to achieve at least an 80% average?
pp. 365-367: #1-14
PRINCE EDWARD ISLAND GRADE 9 MATHEMATICS CURRICULUM GUIDE
Graph the following inequalities on a number line. a.
3 x 2 20
b.
7 3 x 22
c.
2
d.
2 5 x 2 x 16
2 1 x 3 2
Explain why 3n 2 7 and 3n 4 13 do not have any solutions in common. Modify both inequalities so that they have exactly one solution in common.
Page 116
UNIT PLANS
CHAPTER 10 CIRCLE GEOMETRY
SUGGESTED TIME 10 classes
PRINCE EDWARD ISLAND GRADE 9 MATHEMATICS CURRICULUM GUIDE
Page 117
UNIT PLANS
Section 10.1 – Exploring Angles in a Circle (pp. 378-385) ELABORATIONS & SUGGESTED PROBLEMS
POSSIBLE INSTRUCTIONAL & ASSESSMENT STRATEGIES
Specific Curriculum Outcome(s) and Achievement Indicator(s) addressed:
Possible Instructional Strategies:
Have students compare the measures of inscribed and central angles in a circle. Ask them to describe the relationship in their own words.
Provide students with an arc and ask them to find the radius of the circle from which that arc was taken.
SS1 (A B C)
After this lesson, students will be expected to:
describe a relationship between inscribed angles in a circle
relate the inscribed and central angle subtended by the same arc
After this lesson, students should understand the following concepts:
chord – a line segment with both endpoints on a circle
central angle – an angle formed by two radii of a circle
inscribed angle – an angle formed by two chords that share a common endpoint
arc of a circle – a portion of the circumference
Possible Assessment Strategies:
Find BCD and BED
A
B
280
C D
E chord central angle
arc
A surveillance camera is taping people coming through the entrance of the school. While reviewing the tape, school administrators realized that the camera was broken. When shopping for a new one, the cameras available had a field of view of 400 compared to the broken one which had a field of view of 800. Where should they position the new camera to cover the same region?
inscribed angle
Literacy Links:
Subtend – an angle that subtends an arc or a chord is an angle that “stands on” or is formed by the endpoints of the arc or chord.
Major and Minor Arcs – A major arc is more than a semicircle. A minor arc is less than a semicircle.
Notation – Identical markings on angles indicates that the measures of the angles are equal.
Suggested Problems in MathLinks 9:
pp. 382-385: #1-11, 13, 15, 16, Math Link
PRINCE EDWARD ISLAND GRADE 9 MATHEMATICS CURRICULUM GUIDE
Page 118
UNIT PLANS
Section 10.2 – Exploring Chord Properties (pp. 386-393) ELABORATIONS & SUGGESTED PROBLEMS Specific Curriculum Outcome(s) and Achievement Indicator(s) addressed:
describe the relationship among the centre of a circle, a chord and the perpendicular bisector of the chord
Literacy Link:
Possible Instructional Strategies:
Encourage students to draw a number of chords with their perpendicular bisectors to discover the relationship between them.
When introducing the term perpendicular bisector for students, it might help if students note that bi means two and sector sounds like section.
SS1 (A B D)
After this lesson, students will be expected to:
POSSIBLE INSTRUCTIONAL & ASSESSMENT STRATEGIES
Perpendicular Bisector – A perpendicular bisector passes through the midpoint of a line segment at 900.
Possible Assessment Strategies:
You have just purchased a new umbrella to put in the centre of your wooden circular picnic table. You want to place the umbrella in the centre of the table, but the hole is not cut. Explain how you would figure out where to cut the hole for your new umbrella. The diagram represents the water level in a pipe. The surface of the water from one side of the pipe to the other measures 30 mm and the inner diameter of the pipe 44 mm. What is the depth of the water? Round off the answer to one decimal place.
Suggested Problems in MathLinks 9:
pp. 389-393: #1-6, 7 or 8, 9, 11, 12, 14, 16, Math Link
The radius of the circle measures 6 cm. If the distance between the centre and the chord (CD) is 4 cm, what is the length of the chord AB? Round off the answer to one decimal place.
A
D C B
PRINCE EDWARD ISLAND GRADE 9 MATHEMATICS CURRICULUM GUIDE
Page 119
UNIT PLANS
Section 10.3 – Tangents to a Circle (pp. 394-403) ELABORATIONS & SUGGESTED PROBLEMS Specific Curriculum Outcome(s) and Achievement Indicator(s) addressed:
POSSIBLE INSTRUCTIONAL & ASSESSMENT STRATEGIES Possible Instructional Strategies:
SS1 (A B)
After this lesson, students will be expected to:
relate tangent lines to the radius of a circle
After this lesson, students should understand the following concept:
tangent to a circle – a line that touches a circle at exactly one point; the point where the line touches the circle is called the point of tangency tangent line
point of tangency
O
Literacy Links:
Supplementary Angles – Supplementary angles add up to 1800.
Notation – The Greek letter is theta. It is often used to indicate the measure of an unknown angle.
Suggested Problems in MathLinks 9:
pp. 399-403: #1-8, 11, 13, 15, Math Link
Provide students with a handout of four circles with labelled centres to explore the following circle properties. Ask students to draw two non-parallel chords in the same circle. Using the triangle from the geometry set draw a line perpendicular to each chord passing through the centre. Measure each part of the divided chords. What is noticed about the measurements? Show that the perpendicular bisector of a chord will pass through the centre of the circle and that the bisector of a chord passing through the centre of a circle will bisect the chord. Provide opportunities for students to draw and measure central and inscribed angles subtended by the same arc and draw conclusions from their answers. Ask students to place a point outside of one of the circles and ask them to draw the two possible tangents to the circle. From the point where each tangent touches the circle (point of tangency), ask students to draw a line to the centre of the circle. Students should then measure the angle formed by the tangent and the radius. What is noticed about these measurements? Ask students to draw a diameter on one of the circles. They should then draw and measure an inscribed angle subtended by the semicircle. What is noticed about this measurement?
Possible Assessment Strategies: The radius of the earth is 6400 km. If a bird is 1500 m in the air, how far is it from the horizon? Express the answer in kilometres, rounded off to one decimal place.
PRINCE EDWARD ISLAND GRADE 9 MATHEMATICS CURRICULUM GUIDE
Page 120
UNIT PLANS
CHAPTER 11 DATA ANALYSIS
SUGGESTED TIME 20 classes
PRINCE EDWARD ISLAND GRADE 9 MATHEMATICS CURRICULUM GUIDE
Page 121
UNIT PLANS
Section 11.1 – Factors Affecting Data Collection (pp. 414-421) ELABORATIONS & SUGGESTED PROBLEMS Specific Curriculum Outcome(s) and Achievement Indicator(s) addressed:
SP1 (A B)
SP3 (A B C D)
POSSIBLE INSTRUCTIONAL & ASSESSMENT STRATEGIES Possible Instructional Strategies:
Use the following statement to discuss the presence of bias with the class. Based on the survey completed by Mac World last month, 90% of the population prefers Apple over PC computers.
In groups, have students develop a biased and an unbiased question to gather information. Have students share their questions and discuss as a class whether they are biased or unbiased.
After this lesson, students will be expected to:
identify how bias, use of language, ethics, cost, time and timing, privacy, and cultural sensitivity may influence the collection of data
write and analyse appropriate survey questions
Literacy Links:
Possible Assessment Strategies:
Survey – A survey is used to collect opinions and/or information.
Advertising Claims – An advertising claim gives information about the performance of a product or service. The claim is designed to encourage you to buy. The claim may be true, false or a little of both.
Ethics – Ethics involves judgments of right and wrong. For example, cheating on a test is wrong.
Decide whether each sample is biased or unbiased and explain your choice. a. Question to answer: What is your favourite sport? Sample is chosen from people attending a soccer game. b. Question to answer: What is your favourite soft drink? Sample is chosen by picking names from a telephone book.
You want to find the average height of the students in your school. Explain two ways a sample could be selected, one of which is biased and the other unbiased.
Even that which seems the most commonplace of questions for some groups can be considered sensitive to others. Why do you think these may be sensitive questions for certain groups or individuals? a. Which of the following do you consider to be the most comfortable running shoe: Nike, Adidas or Puma? b. How often do you go on a family vacation? c. Which of the following is your favourite meat product: chicken, pork or beef? d. What is your favourite card game?
Suggested Problems in MathLinks 9:
pp. 418-421: #1-10, 12, Math Link
PRINCE EDWARD ISLAND GRADE 9 MATHEMATICS CURRICULUM GUIDE
Page 122
UNIT PLANS
Section 11.2 – Collecting Data (pp. 422-429) ELABORATIONS & SUGGESTED PROBLEMS Specific Curriculum Outcome(s) and Achievement Indicator(s) addressed:
SP2 (A B C D)
SP3 (A B C D)
POSSIBLE INSTRUCTIONAL & ASSESSMENT STRATEGIES Possible Instructional Strategies:
Some students may not understand the difference between a population and a sample. Reinforce the meaning of each term using a familiar example. Stress the importance of the context to help determine the population or the sample.
The use of Census at School, http://www19.statcan.gc.ca/r000-eng.htm, to gather information on various topics on Canadian youth, such as what is your favourite subject, height, weight, eye color, or TV habits can be used as a resource in this section. Census at School offers students an excellent opportunity to be involved in the collection and analysis of their own data and to experience what a census is like.
After this lesson, students will be expected to:
identify the difference between a population and a sample
identify different types of samples
justify using a population or a sample for given situations
determine whether results from a sample can be applied to a population
After this lesson, students should understand the following concepts:
Possible Assessment Strategies:
population – all of the individuals in a group are being studied; for example, the population in a federal election is the group of all eligible Canadian voters
sample – any group of individuals selected from the population; for example, a sample of the population in a federal election might be 100 individuals chosen from each province or territory
Literacy Link:
How could the above question be changed to make the information acquired more useful? Give reasons for your decision.
For each situation, identify the population and indicate if you would survey the population or just a sample. a. Vito’s restaurant would like to know which lunch menu item its customers would prefer. b. You would like to know how many people in your math class like country music. c. Health Canada would like to find out reasons why some Canadians chose not to get the H1N1 vaccine.
Given the following scenarios, what problems can you see with the generalizations that were made? a. The school cafeteria takes a survey about what snacks would be offered at break time during the school day. The cafeteria worker handed out a survey to every fourth person who came through the line on a particular day and gathered the data. It was concluded from this that students would like to see more granola bars offered during the breaks. b. The student council surveys students about how best to spend the activities budget for the coming year. It randomly surveys students at a basketball game. Student council concluded more money should be spent on athletic teams.
Hypothesis – A hypothesis is a statement put forward to guide an investigation.
Suggested Problems in MathLinks 9:
Consider the following survey question: Should elementary, intermediate and high school students be allowed to use calculators on all of their math tests? Yes _____ No _____
pp. 426-429: #1-10, 12, 13, Math Link
PRINCE EDWARD ISLAND GRADE 9 MATHEMATICS CURRICULUM GUIDE
Page 123
UNIT PLANS
Section 11.3 – Probability in Society (pp. 430-439) ELABORATIONS & SUGGESTED PROBLEMS Specific Curriculum Outcome(s) and Achievement Indicator(s) addressed:
SP3 (A B C D)
SP4 (A B C D)
POSSIBLE INSTRUCTIONAL & ASSESSMENT STRATEGIES Possible Instructional Strategies:
Some students might find it helpful to review the calculations for mean, median and mode.
Ask students to recall what they know about the difference between experimental probability and theoretical probability. Clarify any misunderstandings.
Students should be given the opportunity to explore the media to find examples of predictions based on probability in everyday life.
Students should be given the opportunity to explore decision making based on probability. They should use a sample to determine the probability of an event and use the results and subjective judgment to make predictions and explain the reasonableness of the predictions, based on any assumptions that they made. If at all possible, the reasonableness of the predictions should be tested.
As a class, look for examples in the media where probability is used to support or reject a position.
Have students access the web site www.climate.weatheroffice.ec.gc.ca/ ClimateData/canada_e.html and search for data about their hometown to make predictions for the current month (e.g., precipitation amounts, mean temperature). Discuss any assumptions they may have had when making these predictions and explain the limitations of these assumptions.
After this lesson, students will be expected to:
identify and explain assumptions linked to probabilities
explain decisions based on probabilities
After this lesson, students should understand the following concept:
biased sample – does not represent the population; can make survey results inaccurate
Literacy Links:
Assumption – An assumption is something taken for granted, as if it were true.
Generalize – To generalize means to make a broad statement from known facts.
Suggested Problems in MathLinks 9:
pp. 435-439: #1-12, 14, Math Link
Possible Assessment Strategies:
Nancy surveyed 100 students about the popularity of different categories of books. The table displays the results:
a.
b.
PRINCE EDWARD ISLAND GRADE 9 MATHEMATICS CURRICULUM GUIDE
Category
Total
History
10
Mystery
28
Science Fiction
36
Sports
16
Teen Romance
10
From the results, predict how many of the 350 students in a neighbouring school will choose science fiction. Show your calculations. Is your prediction reasonable? Explain why or why not. What assumption did you make?
Page 124
UNIT PLANS
Section 11.4 – Developing and Implementing a Project Plan (pp. 440-443) ELABORATIONS & SUGGESTED PROBLEMS Specific Curriculum Outcome(s) and Achievement Indicator(s) addressed:
SP3 (A B C D)
SP4 (A B C D)
POSSIBLE INSTRUCTIONAL & ASSESSMENT STRATEGIES Possible Assessment Strategies:
After this lesson, students will be expected to:
develop a research project plan
complete a research project according to a plan, draw conclusions and communicate findings
self-assess a research project by applying a rubric
PRINCE EDWARD ISLAND GRADE 9 MATHEMATICS CURRICULUM GUIDE
The following represents a list of ideas for use in the development of a statistics project. a. Find out how much time is spent per week on each subject area when doing homework. Does this change from grade seven to grade nine? b. Find out what type of transportation students in your school use to get to school. Does it differ by grade level? c. Find out the most popular types of after-school activities of students in your school. Does it differ by grade level? Is there a difference in preference between males and females? d. Find out how many hours of sunshine per month your community receives. Compare this with two other communities in the province and suggest reasons for the differences. e. Find out what the five favourite cereals of students are in your class or school. This question could also include adults to compare adults versus student performances in cereal consumption. Compare this with sales volume at the local supermarket to determine how the class compares to the rest of the community. f. Find out the favourite kind of jeans for kids in your age group. Use the result of the survey to write a recommendation to a local store regarding their ordering of the types of jeans. A comparison could also be made for various age groups. g. Ask the student council or community council to suggest issues they would like investigated. Use this as a source for project work. h. Collect data to look for a relationship between average grade on students’ last report card and time spent watching television time spent on homework shoe size i. Conduct a survey to find out information related to students’ favourite NHL team students’ favourite musical instrument students’ favourite potato chip flavour or chocolate bar
Page 125
PRINCE EDWARD ISLAND GRADE 9 MATHEMATICS CURRICULUM GUIDE
Page 126
GLOSSARY OF MATHEMATICAL TERMS
GLOSSARY OF MATHEMATICAL TERMS
A
acute angle – an angle that is between 00 and 900
algebra – a branch of mathematics that uses symbols to represent unknown numbers or quantities
angle of rotation – the minimum measure of the angle needed to turn a shape or design onto itself; may be measured in degrees or fractions of a turn; is equal to 3600 divided by the order of rotation
0
arc of a circle – a portion of the circumference of a circle; a minor arc is less than a semicircle, and a major arc is more than a semicircle minor arc AB A B
C
boundary point – separates the values less than from the values greater than a specified value; may or may not be a possible value in a solution an open circle shows that the boundary point is not included in the solution of x 1
1
2
a closed circle shows that the boundary point is included in the solution of x 1
0
1
2
C
central angle – an angle formed by two radii of a circle; the vertex of the angle is at the centre of the circle, and the endpoints are on the circle
D chord central angle major arc CD
area – the number of square units contained in a two-dimensional region
assumption – something taken for granted, as though it were true
B
base – the number used as a factor for repeated multiplication; in 46 , the base is 4
biased sample – does not represent the population; can make survey results inaccurate
binomial – an expression with two terms, such as 6 y 2 3 or 2 x 5 y
bisect – divide into two equal parts
bisector – a line or line segment that cuts an angle or line segment into two equal parts A
B
centre of rotation – the point about which the rotation of an object or design turns
chord – a line segment with both endpoints on a circle
circumference – the boundary of, or distance around, a circle; this is a linear measurement; it is often represented by the variable C
coefficient – see numerical coefficient
common denominator – a common multiple of the denominators of a set of fractions; a common 1 1 denominator for and is 6 because a 2 3 common multiple of 2 and 3 is 6
common multiple – a common multiple is a number that is a multiple of two or more numbers; for example, common multiples of 3 and 5 include 0, 15 and 30
bisector
PRINCE EDWARD ISLAND GRADE 9 MATHEMATICS CURRICULUM GUIDE
Page 127
GLOSSARY OF MATHEMATICAL TERMS
For these triangles, the corresponding angles are:
composite object – an object made from two or more separate objects
A and D
B and E
C and F
and the corresponding sides are: AB and DE BC and EF AC and DF
congruent – identical in size and shape
constant – a known value in an equation or an expression; in the equation 3n 2 3, –2 and 3 are constants
convenience sample – a group of individuals that is chosen because its members are easy to access
coordinate grid – a grid made of intersecting vertical and horizontal lines; also called a Cartesian plane
coordinate pair(s) – see coordinates
D
degree of a polynomial – the degree of the highest-degree term in a polynomial; in 7a 2 3a the degree of the first term is 2, and the degree of the second term is 1, so the degree of the polynomial is 2
degree of a term – the sum of the exponents on the variables in a single term (monomial); for example, 3xz, or 3 x1z1, has degree 2, since 1 1 2; 5 x 2 y and 2b 3 are terms of degree 3
coordinates – an ordered pair, x, y , is a pair
of numbers used to locate a point on a coordinate grid; coordinates are the values in an ordered pair; the x-coordinate is the distance from the vertical or y-axis; the y-coordinate is the distance from the horizontal or x-axis
diagonal – a line joining two non-adjacent vertices of a polygon
diagonal
x-coordinate
3,2
y
y-coordinate
diameter – the distance across a circle through its centre; represented by the variable d
x
distributive property – the rule that states a b c ab ac for all real numbers a, b and c
E
corresponding angles and corresponding sides – have the same relative position in geometric figures A
B
enlargement – an increase in the dimensions of an object by a constant factor; can be 2-D or 3-D; for example, each dimension of this enlargement is twice the length of the original
equation – a statement that two mathematical expressions are equal and have the same value
D
C
E
F
PRINCE EDWARD ISLAND GRADE 9 MATHEMATICS CURRICULUM GUIDE
Page 128
GLOSSARY OF MATHEMATICAL TERMS
I
equilateral triangle – a triangle with three equal sides
inequality – a mathematical statement comparing expressions that may not be equal; can be written using the symbols > (greater than), < (less than), (greater than or equal to), (less than or equal to) or (not equal to)
inscribed angle – an angle formed by two chords that share a common endpoint; the vertex and endpoints are on the circle
ethics – involves judgments of right and wrong behaviour; for example, cheating on a test is wrong, or unethical
experimental probability – the probability of an event occurring based on experimental results
exponent – the number of times you multiply a base in a power by itself; for example, in 23 , 3 is the exponent, so the base is multiplied by itself three times: 2 2 2 8
exponential form – a shorter way of writing repeated multiplication, using a base and an exponent; 5 5 5 in exponential form is 53
extrapolate – estimate a value beyond a given set of values; extrapolation should be used only when it makes sense to have values beyond given values
inscribed angle
interior angle
interpolate – estimate a value between two given values; interpolation should be used only when it makes sense to have values between given values; for example, an interpolation of 5.4 people does not make sense
isosceles triangle – a triangle with exactly two equal sides
G
generalize – to infer a general principle or make a broad statement from known facts
H
heptagon – a 2-D shape with seven sides
hypotenuse – the side opposite the right angle in a right triangle
L
hypotenuse
interior angle – an angle that is formed inside a polygon by two sides meeting at a vertex
hypothesis – a proposition put forward to guide an investigation
like terms – terms that differ only by their numerical coefficients; they have the same variable(s) raised to the same exponent(s); examples of like terms are 3x and –2x, 6 y 2 and 4 y 2 , –5xy and yx, and 17 and –8
PRINCE EDWARD ISLAND GRADE 9 MATHEMATICS CURRICULUM GUIDE
line of symmetry – a line that divides a figure into two reflected pieces; sometimes called a line of reflection or an axis of symmetry; a figure may have one or more lines of symmetry, or it may have none; can be vertical, horizontal or oblique (slanted) Page 129
GLOSSARY OF MATHEMATICAL TERMS
line symmetry – a type of symmetry where an image or object can be divided into two identical, reflected halves by a line of symmetry; identical halves can be reflected in a vertical, horizontal or oblique (slanted) line of symmetry
linear equation – an equation whose graph is a straight line
linear relation – a relation that appears as a straight line when graphed
O
oblique – slanted, rather than vertical or horizontal
octagon – a 2-D shape with eight sides
opposite operations – operations that “undo” other operations; sometimes called inverse operations, examples of opposite operations are addition and subtraction, multiplication and division, and squaring and taking the square root
opposites – two numbers or expressions with the same numeral(s), but with different signs; for example, +2 and –2, and 3 x 2 and 3 x 2 are opposites
order of operations – the correct sequence of steps for a calculation: Brackets, Exponents, Divide and Multiply in order from left to right, Add and Subtract in order from left to right
order of rotation – the number of times a shape or design fits onto itself in one complete turn
M
mean – a measure of central tendency calculated by finding the sum of a set of values divided by the number of values in the set; for example, for the set of values 6, 8, 5, 9 and 12, the mean is 6 8 5 9 12 8 5
median – a measure of central tendency determined by the middle number in a set of data after the data have been arranged in order; for the data 2, 5, 6, 8 and 9, the median is 6; for the data 1, 3, 5, 7, 9 and 10, the median is 6
mode – a measure of central tendency determined by the most frequently occurring number in a set of data; there can be more than one mode; for the data 3, 5, 7, 7 and 9, the mode is 7; for the data 2, 2, 4, 6, 6, 8 and 11, the modes are 2 and 6
monomial – an algebraic expression with one n4 are term; for example, 5, 2x, 3s 2 , –8cd and 3 all monomials
4
P
parallelogram – a four-sided figure with opposite sides that are parallel and equal in length
pentagon – a 2-D shape with five sides
perfect square – a number that is the product of two identical rational factors; 2 2 4, so 4 is a perfect square, and 6 6 36, so 36 is a perfect square
perimeter – the distance around the outside of a two-dimensional shape or figure
perpendicular – describes lines that intersect at right angles (900)
N
non-perfect square – a rational number that cannot be expressed as the product of two equal rational factors; for example, you cannot multiply any rational number by itself to get an answer of 7 3, 5, 1.5 or ; the square root of a non-perfect 8 square is a non-repeating, non-terminating decimal
6
right angle
numerical coefficient – a number that multiples the variable; in the expression 3n, the numerical coefficient is 3
PRINCE EDWARD ISLAND GRADE 9 MATHEMATICS CURRICULUM GUIDE
Page 130
GLOSSARY OF MATHEMATICAL TERMS
perpendicular bisector – a line that divides a line segment in half and is at right angles to it
plane – a two-dimensional flat surface that extends in all directions
polygon – a two-dimensional closed figure made of three of more line segments
proportion – an equation that says that two ratios or two rates are equal; it can be written in 1 5 or in ratio form as fraction form as 4 20 1: 4 5 : 20
Pythagorean relationship – the relationship between the lengths of the sides of a right triangle; the sum of the areas of the squares attached to the legs of the triangle equals the area of the square attached to the hypotenuse
c2 b2
a2
a2 b2 c 2
polynomial – an algebraic expression formed by adding or subtracting terms; 3 x 2 4 has two
Q
terms, 3 x 2 and 4 are connected by the operation of addition
population – all of the individuals in a group that are being studied; for example, the population in a federal election is the group of all eligible Canadian voters
quadrilateral – a polygon that has four sides
R
radius – a line segment joining the centre of a circle to the outside edge; it can also refer to the length of this line segment and may be represented by the variable r
random – an event in which every outcome has an equal chance of occurring
prime factorization – a number written as the product of its prime factors; for example, the prime factorization of 18 is 2 3 3
random sample – a sample of individuals chosen randomly from the whole population as a way of representing the whole population; stratified samples and systematic samples are types of random samples
prime factors – factors that are prime numbers; for example, the prime factors of 10 are 2 and 5
ratio – a comparison of two quantities with the same units
probability – the likelihood or chance of an event occurring; probability can be expressed as a ratio, fraction or percent
rational number – a number that can be a expressed as , where a and b are integers and b 1 3 b 0; examples include 4, 3.5, , 1 and 0 2 4
power – an expression made up of a base and an exponent base
exponent 7
4 power
PRINCE EDWARD ISLAND GRADE 9 MATHEMATICS CURRICULUM GUIDE
Page 131
GLOSSARY OF MATHEMATICAL TERMS
reciprocal – the multiplier of a number to give a 3 product of 1; for example, is the reciprocal of 4 4 3 4 because 1 3 4 3
reduction – a decrease in the dimensions of an object by a constant factor; can be 2-D or 3-D; each dimension of this reduction is half the length of the original
regular polygon – a polygon with all sides equal and all interior angles equal
repeating decimal – a decimal number with a digit or group of digits that repeats forever; repeating digits are shown with a bar: 0.4 0.444... and 3.12 3.121212...
right triangle – a triangle containing a 90 angle
rotation symmetry – occurs when a shape or design can be turned about its centre of rotation so that it fits onto its outline more than once in a complete turn
scale factor – the constant factor by which all dimensions of an object are enlarged or reduced in a scale drawing; the dimensions of this rectangle are multiplied by 3, so the scale factor is 3
similar figures – figures that have the same shape but different size; they have equal corresponding angles and proportional corresponding sides
simulate – to create a model that reflects a particular situation
solution of an inequality – a value or set of values that satisfies an inequality; the solution set can contain many values
square root – one of two equal factors of a ; for example, 9 is the number; the symbol is square root of 81 because 9 9 81
stratified sample – a sample that is created by dividing the population into distinct groups and then choosing the same fraction of members from each group
subtend – lying opposite to; for example, in the subtends the angle ACB figure, the arc AB
0
C
B
S
sample – any group of individuals selected from the population; for example, a sample of the population in a federal election might be 100 individuals chosen from each province or territory
AB
A
scale – a comparison between the actual size of an object and the size of its image; can be represented as a ratio, as a fraction, as a percent, in words, or in a diagram; for example, the scale 1: 32 means that 1 cm on a diagram represents 32 cm on the actual object scale diagram – a drawing that is similar to the actual figure or object; may be smaller or larger than the actual object, but must be in the same proportions
PRINCE EDWARD ISLAND GRADE 9 MATHEMATICS CURRICULUM GUIDE
supplementary angles – angles that add up to 1800
a
b
a b 1800
surface area – the sum of the areas of all the faces of an object; the number of square units needed to cover a 3-D object
Page 132
GLOSSARY OF MATHEMATICAL TERMS
survey – a question or questions asked of a sample of the population to gather opinions
symmetry – an object or image has symmetry if it is balanced and can fit onto itself either by reflection or rotation
systematic sample – a sample created by choosing individuals at fixed intervals from an ordered list of the whole population
transformation – a change in a figure that results in a different position or orientation; examples are translations, reflections and rotations
translation – a slide along a straight line y
T
x
tangent to a circle – a line that touches a circle at exactly one point; the line is perpendicular to the radius at that point; the point where the line touches the circle is called the point of tangency
trapezoid – a quadrilateral with one pair of parallel sides
trinomial – a polynomial with three terms; x 2 3 x 1 is a polynomial
tangent line
point of tangency
O
term – a number, a variable, or an expression formed by the product of numbers and/or variables; 9x is a term representing the product of 9 (coefficient) and x (variable); a constant value, such as 5, is also a term; the expression 5 x 3 has two terms, 5x and 3
terminating decimal – a decimal number in which the digits stop; 0.4, 0.86 and 0.25 are terminating decimals
tessellation – a pattern or arrangement that covers an area or a plane without overlapping or leaving gaps; also called a tiling pattern
V
variable – a letter that represents an unknown number
vertex – the point where two or more edges of a figure or object meet; the plural is vertices
vertex vertex
theoretical probability – the expected probability of an event occurring; the ratio of the number of expected favourable outcomes to the total number of possible outcomes for an event
PRINCE EDWARD ISLAND GRADE 9 MATHEMATICS CURRICULUM GUIDE
volume – the amount of space an object occupies; measured in cubic units
voluntary response sample – a sample where the whole population is invited to participate
Page 133
PRINCE EDWARD ISLAND GRADE 9 MATHEMATICS CURRICULUM GUIDE
Page 134
SOLUTIONS TO POSSIBLE ASSESSMENT STRATEGIES
SOLUTIONS TO POSSIBLE ASSESSMENT STRATEGIES SECTION 1.1
SECTION 2.1
a.
b.
Answers may vary. Possible answers are: a.
3 1 1 , , 4 2 4
b.
3 5 11 , , 8 12 24
c.
–3.575, –3.55, –3.525
d.
7 11 23 , , 20 30 60
e.
37 19 13 , , 60 30 20
7 1 5 , , 1.2, , 2.6 8 2 3
SECTION 2.2
c.
SECTION 1.2
Although the are some exceptions, in general, the shapes will not be related by rotation or line symmetry.
a. b.
The tessellation does not have line symmetry, because of the alternating colours of the N’s. In order to have line symmetry, all N’s would have to be the same colour. The tessellation does, however have rotation symmetry, with centre of rotation in the middle of the diagram.
Estimated answers may vary. Calculated answers are: a. –2.58 b. 1.38 c. –27.3 d. 1.47 e. –6.38
$63.50
range 13.9 mean 0.2 median 0.6
line symmetry neither
SECTION 1.3
SECTION 2.3
a.
The overall value of the stocks dropped $12.50. Scotia Silver dropped –0.25 and Brunswick Copper was up +0.125.
b.
9 3 9 5 3 5 2
1 6 44 1 5 8 35
148.5 m2
In calculating the surface area, hidden surfaces were not accounted for. The correct answer should be 532 cm2.
3
7200 cm2
PRINCE EDWARD ISLAND GRADE 9 MATHEMATICS CURRICULUM GUIDE
1 5 93 10 6 25
1 1 1 4 2 2
Page 135
SOLUTIONS TO POSSIBLE ASSESSMENT STRATEGIES
44 1 1, 1, and the other answers are 35 2 negative, the expression with the largest quotient 1 6 44 is 2 1 . 5 8 35
Since
SECTION 2.4
a. b.
Jason’s conclusion is correct, since both of his solutions work in the original equation. The square root button on a calculator only gives the principal, or positive, square root of a number.
10.4 cm
The numbers 30, 1.6 and
Answers may vary. Possible solutions are: a. 37, 38, 39, 40, 41, 42, 43, 44, 45, 46, 47 or 48 b. any rational number between 0.49 and 0.64, 1 such as 0.5, or 2 SECTION 3.1
There are many answers. The smallest pair of whole number answers is a 2, b 1. Any pair where a 2b will work.
a. b. c.
6 2 5
a.
52
b.
5
The number 62 can be modelled by drawing a square with side length 6 and 63 can be modelled by drawing a cube with side length 6. SECTION 3.2
Applying the exponent laws, we get 20 50 101. This equals 1 1 10, which has a product of 10.
a. b. c.
64
1024 12 322 22 162 42 82
16 7 145
SECTION 3.3 32 :
23 :
a. b. c.
–12.20C –26.10C 200C
a. b.
–36 4
Yvan should have simplified the second bracket before applying the exponent to the bracket. The correct procedure is:
15 5
a.
He can find 9 4 by calculating 9 9 9 9.
b.
Since 9 3 3, he can find 9 4 by writing it as 3 3 3 3 3 3 3 3 , or writing it as 38 , and using the calculator to get the answer.
2
2 are not perfect 5
squares.
1.75
4 33
. This is the same as cubing the first
number and multiplying by 1000, or adding three zeroes. Since 23 8 (one digit) and 43 64
2
4
2
SECTION 3.4
3
3
2 5 3 7 81 49 130
We can write 203 as 2 10 and 403 as
4 10
4
a. b. c.
3.6 m 4.6 m No, the ladder is too long.
(two digits), we can see that 203 has four digits (8000) and 403 has five digits (64,000).
PRINCE EDWARD ISLAND GRADE 9 MATHEMATICS CURRICULUM GUIDE
Page 136
SOLUTIONS TO POSSIBLE ASSESSMENT STRATEGIES
SECTION 4.1
Answers may vary. Possible solutions are: a.
x 2 5x 4
b.
4x 1
c.
x 2 3x
SECTION 5.2
The scale factor is greater than 1, since the second image is larger than the first image.
If we measure all corresponding features of each image and find that the scale factor is constant, then it is an accurate enlargement. In this example, it is accurate with a scale factor of 3. SECTION 4.2
1 10
a.
a.
3 p 7q
b.
6p
a.
18b 16c
b.
670 cm
a. b. c.
equal not equal not equal
a.
6n 4 4 x 10 y 14
b.
5 x and 2 x 2 2
SECTION 5.3
x 2 2x 3
a.
For a distance of 1 cm shown on the map, the actual distance is 150 km.
b.
1 15,000,000
a. b. c.
78 1260 80
x 1
Form and cancel all zero pairs
x 1 2x 2
b.
x 1 2 x 2
Find the opposite of the second expression and add it to the first expression
3x 1
SECTION 4.3
2
19.7 m
6m
The triangles are similar with a scale factor of 1.8.
SECTION 4.4
18.75 cm by 26.25 cm
The diagram will be a square with side lengths of 13.7 cm.
Form and cancel all zero pairs
a.
5x 2 7x
b.
4m 2 2mn 2
2x
2
3x 2 x 2 x 1
2x 2 3 x 2 x 2 x 1 x 2 4x 3
SECTION 5.1
a.
3 x 5y
b.
6 x 2y
a.
2a 4b
b.
2a 3b
PRINCE EDWARD ISLAND GRADE 9 MATHEMATICS CURRICULUM GUIDE
Page 137
SOLUTIONS TO POSSIBLE ASSESSMENT STRATEGIES
SECTION 6.1
a.
b.
c.
y 4 x 5; 65 sit-ups, 105 sit-ups
x
y
It is not reasonable to continue this pattern forever, as the human body has limits when it comes to physical activity.
–3
–15
SECTION 6.3
–2
–11
–1
–7
0
–3
1
1
2
5
3
9
x
y
–3
27
–2
12
–1
3
0
0
1
3
2
12
3
27
x
y
–3
–25
–2
–18
–1
–11
0
–4
1
3
2
10
3
17
linear
$25
a.
not linear
linear
y 0.5 x 10; A possible context might be the following: It costs $10 to buy a 12-inch pizza, plus an extra 50¢ per topping. Write an expression for the cost of a pizza with x toppings. $360
b. c.
y 1.25 x 3
d.
Taxi companies charge a flat fee for the use of the service. In this case, the flat fee is $3. 17.6 km $18
e. f.
a.
SECTION 6.2
This is the linear relation s 4t . A possible situation might be: A car, starting from rest, is increasing its speed by 4 m/s every second. Write an expression for the speed of the car after t seconds.
PRINCE EDWARD ISLAND GRADE 9 MATHEMATICS CURRICULUM GUIDE
Since the length of a trip is a continuous variable, the points should be joined.
b. c.
t
d
0
4
20
4
40
4
60
4
A linear relation whose graph is a horizontal line. A possible situation might be: A person who is 4 m from his home sees a friend and decides to stop and have a chat for a minute. Sketch a graph showing how far he is from home after t seconds.
Page 138
SOLUTIONS TO POSSIBLE ASSESSMENT STRATEGIES
d.
d4
SECTION 7.3 SECTION 7.1
a-b.
a.
12n 2
b.
10k 2
c.
30 xy
a.
2 x 2
c.
x 5
b.
2y
d.
c.
6a
x 2 5x x 5 x
a.
Dimensions of large rectangle: 3 x by x 2
b. c.
Dimensions of small rectangle: x by 2 x 4 Dimensions: 2.3 m by 8.6 m; Area: 19.78 m2 9.89 m2
a.
9
SECTION 7.2
2 x 2 by 4; Area 8 x 8
a.
b.
4x 4
6x 2
b.
9; The simplified expression is x 3.
c. d.
The results are equal. It’s easier to evaluate the expression after the division because the calculation is much simpler, as it only requires addition.
3 x 2 x 4 6 x 2 12 x
12y 6 2y 1 6
SECTION 8.1
30,000 boxes a.
x 0.2
b.
m 0.75
c.
p4 SECTION 8.2
4m m 2 4m 2 8m
a.
10m 2 15m
b.
n 2 n
c.
2.6 x 2 6.5 x
d.
3m 2 6m
e.
12.3k 15.9k
a.
25 x 2 15 x
b.
130 m2
a.
x 1
b.
t 0.08
c.
x
25 3
It will take Brenda 6 weeks and Rob 5 weeks to purchase the CD player. So, Rob can buy it first.
23
95 people
$1410
2
SECTION 8.3
PRINCE EDWARD ISLAND GRADE 9 MATHEMATICS CURRICULUM GUIDE
a.
3 11 5 3 6 18
b.
0.2 4 3 0.2 7 1.4
a.
x 10
Page 139
SOLUTIONS TO POSSIBLE ASSESSMENT STRATEGIES
b.
m 0.2
b.
x 11
c.
x 0.7
c.
x 1.2
d.
x 18
d.
x 7.7
e.
x 4
e.
x 4
x
f.
x 13
f.
5 6
8.2
50 km/h and 55 km/h
5 x 2 25; x 3 The value of x would also have to be greater than –2, since the dimensions of the rectangle, 5 and x 2, must be positive, so 2 x 3.
SECTION 8.4
SECTION 9.3
14 cm
10 cm
at least 94%
3 cm by 4 cm
The solution is x 6, therefore the only solutions from the given set are –14 and –9.
a.
x5
b.
z 1
c.
s 2
d.
b6
–6
50 copies
b.
Answers may vary. Possible solutions are: a. 1, 2, 3 b. 1, 2, 3, 4, 5, 6 c. 6, 7, 8, 9 a. 50
a.
x3
b.
x 2
c.
3 x 5
90
a. –6
–4
–2
0
2
4
–4
–2
0
2
4
6
Answers may vary. Possible solutions are: a. ..., –7, –6, –5, –4 b. –2, –1, 0, 1, ... c. –2, –1, 0, 1, 2, 3, 4 a.
–2
0
2
4
6
–2
0
2
4
6
–2
0
2
4
6
–2
0
2
4
6
–4 9 4
–4
x7
PRINCE EDWARD ISLAND GRADE 9 MATHEMATICS CURRICULUM GUIDE
–4
SECTION 10.1
BCD 560 , BED 280
Twice as far back from the door as was the original camera.
SECTION 9.2
–4
The solution to the inequality 3n 2 7 is n 3 and the solution to the inequality 3n 4 13 is n 3. Since neither solution includes the number 3, they have no solution in common. In order to have exactly one solution in common, change the inequalities to 3n 2 7 and 3n 4 13.
6
b. –6
6
x 2
–6 60
4
80
b.
2
x
–6 d.
0
x 5 –6
c.
–2
x6 –6
SECTION 9.1
a.
–4
SECTION 10.2
Draw two chords on the table and determine the perpendicular bisector of each chord. Where the two perpendicular bisectors meet will be the centre of the circle.
5.9 mm Page 140
SOLUTIONS TO POSSIBLE ASSESSMENT STRATEGIES
SECTION 11.2
8.9 cm SECTION 10.3
Split the question up into three parts – one question referring to elementary students, one referring to intermediate students and one referring to high school students. The expectations regarding calculator use are different at each level.
a. b.
138.6 km SECTION 11.1
a. b.
Biased, since the question was asked at a soccer game. Unbiased, since the people are randomly chosen.
Unbiased – randomly choose a class from each grade in your school Biased – select all members of the basketball team
a.
b.
c. d.
If students come from a low socio-economic background, these brands of running shoes may be inaccessible to them. If students come from a low socio-economic background, they may not go on family vacations. Some cultures do not eat certain types of meat. Also, vegetarians do not eat meat. Some people do not play cards due to their religious beliefs.
PRINCE EDWARD ISLAND GRADE 9 MATHEMATICS CURRICULUM GUIDE
c.
a.
b.
Vito’s customers, survey a sample Students in your math class, survey the population Canadians, survey a sample Surveying only students in the cafeteria would mean that these students were probably happy with its snacks. The students who did not like the snacks would probably not be in the cafeteria. They should have surveyed more widely in the school. Students at a basketball game would be more likely to look for more athletic opportunities. They should have surveyed more widely in the school. SECTION 11.3
a.
36%; 350 36% 126
b.
126 students would choose science fiction Not necessarily, because the students in one school may not be representative of the students in another school.
Page 141
PRINCE EDWARD ISLAND GRADE 9 MATHEMATICS CURRICULUM GUIDE
Page 142
REFERENCES
REFERENCES American Association for the Advancement of Science [AAAS-Benchmarks]. Benchmark for Science Literacy. New York, NY: Oxford University Press, 1993. Banks, James A. and Cherry A. McGee Banks. Multicultural Education: Issues and Perspectives. Boston: Allyn and Bacon, 1993. Black, Paul and Dylan Wiliam. “Inside the Black Box: Raising Standards Through Classroom Assessment.” Phi Delta Kappan, 20, October 1998, pp.139-148. British Columbia Ministry of Education. The Primary Program: A Framework for Teaching, 2000. Davies, Anne. Making Classroom Assessment Work. British Columbia: Classroom Connections International, Inc., 2000. Hope, Jack A. et. al. Mental Math in the Primary Grades. Dale Seymour Publications, 1988. National Council of Teachers of Mathematics. Mathematics Assessment: A Practical Handbook. Reston, VA: NCTM, 2001. National Council of Teachers of Mathematics. Principles and Standards for School Mathematics. Reston, VA: NCTM, 2000. New Brunswick Department of Education. Mathematics: Grade 9 Curriculum (draft). January 2010. Rubenstein, Rheta N. Mental Mathematics Beyond the Middle School: Why? What? How? September 2001, Vol. 94, Issue 6, p. 442. Shaw, Jean M. and Mary Jo Puckett Cliatt. “Developing Measurement Sense.” In P.R. Trafton (ed.), New Directions for Elementary School Mathematics (pp. 149–155). Reston, VA: NCTM, 1989. Steen, Lynn Arthur (ed.). On the Shoulders of Giants – New Approaches to Numeracy. Washington, DC: National Research Council, 1990. Van de Walle, John A. and Louann H. Lovin. Teaching Student-Centered Mathematics, Grades 5-8. Boston: Pearson Education, Inc. 2006. Western and Northern Canadian Protocol. Common Curriculum Framework for K-9 Mathematics, 2006.
PRINCE EDWARD ISLAND GRADE 9 MATHEMATICS CURRICULUM GUIDE
Page 143