is a hoarse voice like a lullaby sung as interlude expressions in certain songs, and the âwetâ expression is used in pop music for temporally emotional emphasis.
Gradually Changing Expression of Singing Voice based on Morphing Tomoko Yonezawa1),2) , Noriko Suzuki3) , Kenji Mase2),1) , Kiyoshi Kogure1) 1) ATR Intelligent Robotics and Communication Laboratories 2) Nagoya University 3) ATR Media Information Science Laboratories
We have developed a method for synthesizing a singing voice by gradually changing the musical expression based on speech morphing. This paper shows the advantages of this method in comparison with the approach of binary discrete transformation between two expressions, confirmed by statistical analyses of perception tests. In order to synthesize different expressional strengths of a singing voice, a “normal” (without expression) voice of a particular singer is used as the base of morphing, and three different expressions, “dark,” “whispery” and “wet,” are used as the target. Through our experiments, we confirmed i) the proposed morphing algorithm effectively interpolates the expressional strength of a singing voice, ii) an approximate equation of the perceptual sense can be used to calculate the morph ratio at a perceptually linear interval, and iii) our gradual transformation method can generate a natural singing voice from the interpolation of two different expressions.
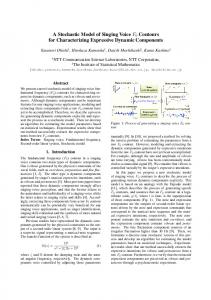
1. Introduction One of the critical expectations placed on personified robotics and agents is the ability to produce an expressive voice, so naturalness of voice is a key design challenge that must be met. A naturally expressed voice has variously transformed expressions. Recent approaches to speech synthesis with emotional expressions include rule-based methods such as those mentioned by Schr¨oder[1] and corpus-based methods such as CHATAKO[2]. While rule-based methods mainly address prosody controls, corpus-based methods cover vocal sound. However, there are gaps between the different expressions or emotions achieved by each corpus. To solve this problem, we have developed a method for gradually changing expression by using speech morphing. By focusing on the effectiveness of vocal sound without prosodic features, our approach thus achieves the purpose of its name: Expressive Singing Voice Morphing (ESVM). Cano et al.[3] proposed a karaoke system for singing voice morphing between different singers, from the user’s voice to the voice of a professional singer. Sogabe et al.[4] and Matsui et al.[5] investigated the sound morphing of emotional speech by a particular speaker. The former research used different singers, and the latter included different values of speech speed and F 0 . Thus the previous research efforts in sound morphing provided new synthesized sound; in contrast, our research aims to vary and smooth out the expression in the voice of a particular singer by using the same singer, speed, and F 0 . Figure 1 shows an example of the anticipated advantages: while the strength of the original vocal expression gradually transforms, corpus-based voice synthesis provides binary dis-
morph ratio
Abstract
(divided into from N to ∞)
{yone, noriko, mase, kogure}@atr.jp 1.0
original binary gradual
(0.83) (0.67) (0.5) (0.33) (0.17)
0.0
Figure 1: Example of Advantage achieved with Morphing Expression crete transformation depending on categories of vocal expression. In contrast to the discontinuity of the existing methods, our approach can accurately approximate natural expression. In this paper, we explain the synthesizing method of ESVM by a speech morphing algorithm[6] using STRAIGHT[7] and confirm the effectiveness of interpolation and extrapolation of the singing voice. We then approximate MOS (mean opinion score) values for perceptually linear synthesis of the singing voice expressions. Finally, we discuss the advantage of the gradual transformation’s naturalness of expression through a comparison with binary discrete transformation.
2. ESVM Synthesis We collected variously expressed singing voices by a particular singer for use in singing voice synthesis based on varying strength with morphing technology. It is possible to synthesize the voice parameters, but we focused on vocal synthesis from the existing data for a more natural expression. Voice morphing is an appropriate synthesis technique for maintaining individuality and naturalness at the same time. We recorded the singing voice of a female amateur singer in her twenties at a sampling frequency of 44.1 kHz. The singer was instructed to sing in four types of expressions: “normal,” “dark,” “whispery,” and “wet” (Table 1) while keeping each expression consistent in her singing. Among various expressions, we selected the above four from the viewpoint of the technical skill involved in the song types. Here, “dark” emphasizes expressiveness like that produced by an opera singer, “whispery” is a hoarse voice like a lullaby sung as interlude expressions in certain songs, and the “wet” expression is used in pop music for temporally emotional emphasis. The amateur singer sang a Japanese nursery rhyme, “Furusato” (“Hometown”), with an accompaniment that arranges speech speed and F 0 in the same way. We synthesized the variously expressed morphed singing voices by applying STRAIGHT Morphing. As shown from A-1 to A-3 in Table 2, we first synthesized morphed singing sounds expressed at various strengths by using “normal” as the base and the three types of singing voice as the targets. Then, as shown from B-1 to B-3 in Table 2, we synthesized morphed singing sounds with two kinds of expressions by using each pair of expressed voices as both the base and the target. To adopt not only interpolation but also extrapolation for
Similarity Comparing with "normal"
Table 1: Expression Types in Recorded Voices singing instruction flat, without expressions entirely like interior tongue vowel including more white noise entirely nasal voice
Table 2: ESVM Synthesis A-1 A-2 A-3
base normal normal normal
target dark whispery wet
B-1 B-2 B-3
base whispery wet wet
7 6 5 MOS
expression “normal” “dark” “whispery” “wet”
4 3 2
target dark dark whispery
the emphasized expressions, the morphing rate was set to 0 or less and to 1 or more. As sufficient steps for tracing the shape of interpolation, we set the morphing rates from -0.333 (-2/6) to 1.333 (8/6) over eleven steps with equal intervals of 0.167 (1/6).
3. Perception Test of ESVM In this section we evaluate 1) the perceptual effect and the naturalness of the linearly interpolated expression of a singing voice, 2) whether an approximate expression enables perceptually linear interpolation, and 3) whether the interpolation of the expressional strength enables natural transformation between different expressions of a singing voice. 3.1. Consistent ESVM: Experiment #1 and #2 3.1.1. Experiment #1: Linear (Original) Interpolation To examine the effect of the morphed singing voice, we conducted a perception experiment. In this test, we aimed to verify that the morphing method enables perceptual interpolation and extrapolation even when the base and target have the same singer, the same speed, and the same F 0 . Hypotheses: We proposed three hypotheses: ?1) that expressions of the singing voice are different from each other, ?2) that the morphed voice made from the two expressed voices is different from “normal,” and ?3) that the expression level is changed by morphing. Method: The subjects listened to stimulating sounds in randomized order through headphones attached to a Windows 2000 PC and gave subjective evaluations in seven grades: “completely suitable, very suitable, somewhat suitable, indeterminate, somewhat unsuitable, very unsuitable, completely unsuitable” for the instructed criteria on the GUI of the Tcl/Tk program. Subjects: Thirteen people aged in their twenties to lowerthirties (six females and seven males). Stimulating Sounds: We adopted the synthesized morphed sound shown in Table 2 and four original sounds: “normal,” “dark,” “whispery” and “wet.” As a sample of the morphed voice, we selected six morae, “Ko Bu Na Tsu Ri Shi,” in the morphed song from the synthesized song data described in Section 2. Speech speed was about 2.0 morae/second, and the F 0 range was approximately 300 Hz to 450 Hz on average in each musical interval. The length of each sound was about 3.0 seconds. Procedure: The experiment was conducted through each of the tests described below. ?1) Subjects evaluated sounds using the seven grades listed above in pairwise comparison between normal and [normal, dark, whispery or wet] while each pair was continuously played back. ?2) Subjects identified each member of the pair [normal, (morphed voice from B-1 to 3)] continuously played back at the
1 normal dark
normal whisper
natural wet
Figure 2: Pairwise Comparison between “normal” and Expressions Table 3: T-test between the Identification of “normal” and [“dark,” “whispery” or “wet”] (α = 0.01) “dark” t(12) = 15.0 p < .01
“whispery” t(12) = 10.2 p < .01
“wet” t(12) = 24.0 p < .01
seven grades. ?3) Subjects listened to the morphed sound of A-1 in Table 2 and judged two evaluation items, I) expression of “dark” and II) naturalness, according to the seven grades. They did the same experiments for A-2 as “whispery” and A-3 as “wet.” In preparation for evaluating an item, subjects were instructed to listen to a control “dark” sound before this experiment to confirm what is defined as “dark.” They were also instructed to base the criterion of naturalness on how much they feel the sound resembles a human voice. Results in Simple Linear Interpolation: The MOS averages of the identification results of perception test ?1) compared with “normal” are shown in Figure 2. To verify the difference between “normal” and the other sounds, Table 3 shows T-test results between the identification of [“normal”, “dark,” “whispery” or “wet.”] These results indicate that the expressed singing voice is accurately perceived as different from “normal” in perceptual feeling. Perception test ?2) shows that expressional morphing between two expressed voices gives a new expression that is different from “normal.” Figure 3 shows that the morphed voices from B-1 to B-3 at a morphing ratio of around 0.5 are comparatively more similar to “normal” than are the voices at other ratios. Therefore, we focused on morphing ratios of 0.33 to 0.67 for B-1 to B-3 to verify that “normal” is similar to B-1, B-2 and B-3 by T-test (Table 4.) The results show that a synthesized voice is significantly different from “normal” even at a morphing ratio of around 0.5. The results of perception test ?3) (Figure 4) show that MOS averages of the expressional strength correspond to the morphing ratio. Figure 5 displays the naturalness of the morphed sound. Although we estimated MOS values to be higher at the morphing ratios of 0 and 1, a deeper expression was not recognized as natural in the cases of A-1 and A-3. It is possible that a morphed voice with a continuous hard expression was recognized as an artificial voice. Thus we confirmed that our hypotheses were correct in this experiment. These results indicate that the morphing of a singing voice can supply rich expression by varying the kind and strength of expressions in the perceptual measure. 3.1.2. Experiment #2: Reciprocal Sigmoid Interpolation In Figure 4, MOS values change steeply around a morph ratio of 0.5. We assume that the MOS values of ESVM strength by linear interpolation are approximated into a sigmoid expression (Equation (1), where x is the morph ratio), especially for the morph ratios between 0.0 and 1.0.
Evaluation of Similarity Comparing with "normal"
Strength of Expression
7
7 B-1 B-2 B-3
6
5 MOS
MOS
5
6
4
4
3
3
2
2
1
A-1 A-2 A-3
1 -0.33 -0.17
0
0.17 0.33 0.5 0.67 0.83 morph ratio
1
1.17 1.33
-0.33 -0.17
Figure 3: Similarity of Morphing Sound Synthesized between Expressed Voices
0.50(3/6) 0.67(4/6)
B-2 t(12) = 9.96 p < .01 t(12) = 7.25 p < .01 t(12) = 5.33 p < .01
B-3 t(12) = 9.06 p < .01 t(12) = 9.80 p < .01 t(12) = 9.68 p < .01
5 + 1.5 (1) 1 + e−6x+3 To synthesize ESVM in perceptually linear MOS values, we propose using a morph ratio computed by Equation (2), in which a is the original morph ratio at a regular interval, from the reciprocal function of Equation (1). „ « compensated = 0.5 − 1 log 1 − 1 (0 < a < 1) (2) morph ratio 6 a M OS ≈
To prove the linear perception with a compensated morph ratio as proposed, we conducted the perception experiment described below. Hypothesis: Expressions of a singing voice are interpolated to be perceptually linear when the morph ratio is set by Equation (2). Subjects: Nineteen people aged in their twenties to thirties (seven females and twelve males). Stimulating Sounds: We synthesized the singing voices in seven steps from 0 to 1 with compensated intervals of morph ratio: 0, 0.39, 0.45, 0.5, 0.55, 0.61, 1. The prepared singing voices, called A-1-sig, were synthesized from the base and target by a method similar to A-1 in Table 2, with A-2-sig and A-3-sig, which are the same as A-1-sig. Method and Procedure: Same as test ?3) in Experiment #1. Results of Reciprocal Sigmoid Interpolation: The MOS averages of the expressional strength shown in Figure 6 seem to be linear compared with the MOS values in Figure 4. To verify the adequacy of the MOS value’s approximation by Equation (1), we calculated R-square values (Table 5) and compared them. As a result, each R-square value for A-1 to 3 shows that Equation (1) has improved the adequacy. We next verified that the morph ratio computed by Equation (2) leads to perceptual linearity. In comparing A-1-sig to 3 with A-1 to 3 in the linear approximation, we can see that each Rsquare value has improved, as we intended in this experiment. These results demonstrate that our hypothesis is correct. 3.2. Gradual Expression using ESVM: Experiment #3 To verify the effectiveness of ESVM interpolation as the strength of the expression changes with time, we focused on the naturalness of the singing voices with/without interpolation. By adopting “whispery,” which was natural in the results of test
1
1.17 1.33
Naturalness 7 6 5 MOS
0.33(2/6)
B-1 t(12) = 9.70 p < .01 t(12) = 12.8 p < .01 t(12) = 7.23 p < .01
0.17 0.33 0.5 0.67 0.83 morph ratio
Figure 4: Evaluation of Expressional Strength
Table 4: T-test of Identification between [“normal”, from B-1 to 3] (α = 0.01) morph ratio
0
4 3 2
A-1 A-2 A-3
1 -0.33 -0.17
0
0.17 0.33 0.5 0.67 0.83 morph ratio
1
1.17 1.33
Figure 5: Evaluation of Naturalness ?3), we compared i) the singing voices smoothly morphed between “normal” and “whispery” to ii) the singing voices suddenly switched between them. In this experiment we also evaluated iii) the effectiveness of the reciprocal sigmoid interpolation of the morph ratio. Hypotheses: 1) The gradual change of the expressional strength between “normal” and “whispery” is more natural than the sudden binary switch between them. 2) The reciprocal sigmoid interpolation more effectively achieves naturalness of the singing voice than linear interpolation. Method: Subjects evaluated the naturalness of the expressional change in the stimulating sound by using the seven grades given above. Subjects: Same as Experiment #2. Stimulating Sounds: To verify the hypotheses, we set up three conditions of the method of expressional change: Switch is sudden binary change, Linear is linear change, and rec-Sigmoid is the reciprocal sigmoid change of the morph ratio. The first one is a currently used conventional method, while the latter two are proposed here. We focused on the “whispery” singing voice, which is basically natural as mentioned in Section 3.1.1. Corresponding to each condition, we applied the morph ratio shown in Table 6 to each mora, “Ko Bu Na Tsu Ri Shi.” These were connected at each end of the morae at zero cross points cut from A-20 and A-2-sig0 , which were synthesized in six steps of morph ratio. We eliminated the effect of the order by averaging the results of a) “normal” to “whispery” and b) “whispery” to “normal.” Procedure: Subjects listened to the morphed sound of A-1 in Table 2 and evaluated the naturalness of expressional change, according to the seven grades based on the criterion of how much they feel the sound resembles a human voice. Results of Perception Test with Expressive Change: Figure 7 shows the averages of MOS values of naturalness. We intended to show in a standardized way the results among the three methods by using analyses of variance (ANOVA) with repeated measurement (α = 0.01, φ = 18, 2). There were significant differences among Switch, Linear and recSigmoid (ANOVA, F=35.249, p