Graph Aggregation : Application to Social Networks Amine Louati∗ Marie-Aude Aufaure∗∗ Yves Lechevallier∗∗∗ ∗
University Paris-Dauphine - Lamsade, Place du Maréchal de Lattre de Tassigny, F-75775 Paris 16 cedex, France
[email protected] ∗∗ Laboratoire MAS Ecole Centrale de Paris Grande Voie des Vignes Chatenay-Malabry, France
[email protected], ∗∗∗ INRIA-Rocquencourt,Domaine de Voluceau 78150 Rocquencourt
[email protected] Abstract. In the enterprise context, people need to exploit and mainly visualize different types of interactions between heterogeneous objects. Graph model seems to be the most appropriate way to represent those interactions. However, the extracted graphs have in general a huge size which makes it difficult to analyze and visualize. An aggregation step is needed to have more understandable graphs in order to allow users discovering underlying information and hidden relationships between entities. In this work, we propose new measures to evaluate the quality of summaries based on an existing algorithm named k-SNAP that produces a summarized graph according to user-selected node attributes and relationships.
1
Introduction
Data manipulated in an enterprise context are structured data as well as unstructured content such as e-mails, documents, etc. Graphs are a natural way of representing and modeling such data in a unified manner (structured semi-structured and unstructured ones). The main advantage of such structure resides in its dynamic aspect and its capability to represent relations, even multiple ones, between objects. People need to visualize different types of interactions between heterogeneous objects (e.g. product and site, customers and products, people interaction like social networks, etc.). In order to analyze these interactions and facilitate their visualization, it is relevant to modulate such interaction by using a graph structure. However, graphs extracted are often large, with thousands or even millions of nodes and edges. As a result, it is almost impossible to understand the information encoded in these graphs by mere visual inspection. In order, to facilitate the visualization and data interpretation, it seems interesting to perform an operation of summarization. The objective of graph summarization is to produce small and understandable summaries and can highlight communities in the network, which greatly facilitates the interpretation. Today, summarization has
Graph Aggregation
attracted a lot of interest in the database community therefore, it should use not only the relations between nodes but also the characteristics of each one, and very few algorithms are adapted to such complex graphs. In this context, we propose a general tool for graphs summarization which takes into account the heterogeneity of our data. This tool is based on an existing technique called k-SNAP (Tian et al. (2008)) that integrates an interactive querying scheme by allowing users to customize the summaries based on user-selected node attributes and relationships. The remainder of this paper is organized as follows: After a brief review of the existing graph aggregation methods in section 2, we focus our critique on k-SNAP method to identify the missing components that limit the use of this technique in practice. Section 4 describes the global architecture of our summarization tool. The formalism of the new proposed measures that evaluate the quality of summaries is presented in Section 5. Experimental results are interpreted in Section 6, and Section 7 contains our concluding remarks.
2
Graph Aggregation Algorithms
When graphs of extracted social networks are large, effective graph aggregation and visualization methods are helpful for the user to understand the underlying information and structure. Graph Aggregation Algorithms produce small and understandable summaries and can highlight communities in the network, which greatly facilitates its interpretation. The automatic detection of communities in a social network can provide this kind of graph aggregation. The community detection is a clustering task, where a community is a cluster of nodes in a graph (Girvan and Newman (2002), Newman and Girvan (2004)), such as the nodes of the cluster must be more connected with inside nodes, than with nodes outside of the cluster (see found Schaeffer (2007) and Santo (2010) for extended reviews). The first class of clustering algorithms are the partitional algorithms, which try to find a partition of a set of data, with a given number of clusters, using jointly, most of the time, similarity or a dissimilarity measures and a quality criterion of the obtained partition. The most popular partitional algorithm (with several variants), the k-means clustering (MacQueen (1967)), tries to find a partition of the set of objects which minimizes the sum-of-square criterion which adds the dissimilarities from each object to the center of its own cluster. Several (di)similarity measures can be defined in the social network context, like those based on the Jaccard index, which measures similarity between the sets of neighbors of the two nodes, but other measures can be defined (Schaeffer (2007) and Santo (2010)). Hierarchical clustering algorithms try to organize data into a hierarchical structure, and are divided into agglomerative and divisive algorithms, depending on whether the partition is coarsened, or refined, at each iteration. The basic idea beyond agglomerative algorithms is simple: at the starting point, the objects to cluster are their own classes, and then at each stage we merge the two most similar clusters. Of course a dissimilarity measure between two clusters is mandatory, and for a given dissimilarity measure d between objects, several clusterdissimilarities exist. The result of the clustering process is a dendrogram, which can be cut to give one single partition. Divisive clustering algorithms, split the dataset iteratively or recursively into smaller and smaller clusters, with respect to a quality criterion. The most popular method for divisive hierarchical clustering of social networks uses the notion of edge betweenness (Freeman (1977)), because finding the connecting edges between communities is also
A. Louati et al.
finding these communities. The algorithm given in Girvan and Newman (2002) splits the network into clusters by removing, step by step, the edge with the higher betweenness value. The use of a stopping criterion which measures the improvement at each step should permit to stop when no improvement is gained with an iteration. In most cases the modularity defined by Newman (2004) is used. SuperGraph (Rodrigues et al. (2006)) employs hierarchical graph partitioning to visualize large graphs. Specially designed for graphs, spectral algorithms (Von Luxburg (2006)) are based on the notion of connected components. These algorithms work with a Laplacian matrix based on the adjacency (or weight) matrix (Shi and Malik (2000), Ng et al. (2001)). If the graph of the social network contains k completely disjoints communities (i.e. without any link between them), called connected components, then the k eigenvectors which their eigenvalue are equal 0 are the indicator vectors of the k connected components. If the clusters of the social network do not contain “clean” connected components (i.e. if there are links between existing communities), then a simple clustering on the k eigenvectors associated to the k least eigenvalues, can retrieve the k communities. Some other algorithms use statistical methods to study graph characteristics, such as degree distributions (Newman (2003)), hop-plots (Chakrabarti et al. (2007)) and clustering coefficients (Watts and Strogatz (1998)). The results are often useful but difficult to control and especially to exploit. Methods for mining frequent graph patterns (Yan and Han (2002)) are also used to understand the characteristics of large graphs. Washio and Motoda (Newman (2003)) provide an elegant review on this topic. However, all the previous algorithms use only on links between nodes of the graph, and do not take into account the internal values contained in each node, while classical clustering algorithms applied on tables of values, work only on these values ignoring completely the possible links between individuals. An algorithm which can take into account both kinds of information would be very valuable. Designed for graphical graph aggregation the k-SNAP algorithm Tian et al. (2008), in its divisive version, begins with a grouping based on attributes of the nodes, and then tries to divide the existing groups according to their neighbors groups, to minimize a loss information measure and find the summary of size k with the best quality. We discuss k-SNAP algorithm in the next section.
3
Discussions
Most existing work such as algorithms already mentioned, are rather methods of structural partitioning that completely ignore the attributes associated with nodes and also the multirelation aspect of social network, which makes interpretation very difficult. The summarization operation should use not only structural information related to graph organization but it should also take into consideration semantic information including among other nodes description in form of attributes (for instance, student node may be characterized by the attributes: sex, department, class . . .) and interaction types between them (different kind of relationship). These additional knowledge may guide the process of network aggregation and can also provide more relevant analysis according to different perspectives and point of view. Although k-SNAP summarization method provides useful features that can help users to extract and to understand the underlying information encoded in large graphs, two key components are missing and this limits the practical application of this technique in many cases.
Graph Aggregation
First, the k-SNAP approach only deals with categorical node attributes. But in the real world especially in a business context, many node attributes are numerical, such as the age of the employees or the number of e-mails exchanged between users in an enterprise network. Simply running the graph summarization method on the numerical attributes will result in summaries with large sizes (at least as large as the number of distinct numerical values). On the other hand, k-SNAP is not practical with the presence of a large number of attributes mainly with multiple modalities. In this case, it produces scattered and non informative summaries formed by a large number of groups with small size (at least as large as the cardinal of Cartesian product of all modalities). The second missing component that affects the usability of k-SNAP, is the restriction of aggregation on homogeneous graphs where nodes should be characterized by the same description i.e, the graph is composed by a one type of object so, we dispose a single set of attributes defined for all nodes. Nevertheless, new requirements related to the enterprise context appear ; actually, people need to analyze different types of interactions between heterogeneous objects to exploit them for commercial purposes: sending product recommendations to a targeted customer and guide preferences. Also for organizational purposes: learn about the roles of individuals (eg who hold the information, who is the responsible, who is the expert) and their interactions (eg, who works with whom). Thus, the graphs collected are no longer homogeneous but rather heterogeneous as they are extracted from relational databases Soussi et al. (2010); such graph contains several kinds of relations and objects. Each object owns a set of characteristics which can be different from object to another. In this work, we not limit ourselves to homogeneous graphs but we consider also other kind of graphs among other heterogeneous ones. Our aggregation process is established in two steps like k-SNAP: the first step is based only on attributes (A-compatible grouping) and the second step is based on relationships ((A, R)-compatible grouping).
4
Architecture overview
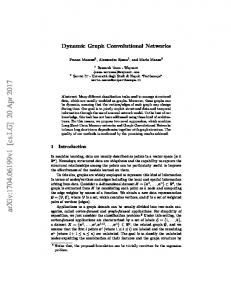
Figure 1 shows the global architecture of our graph aggregation tool along with its key components. This architecture highlights the multi strategies and scenarios aspects of this system according to the input graph. The objective is to summarize any type of graph; heterogeneous or homogeneous and even without knowledge. First, we start by importing a graph to aggregate. A pre-treatment is conducted to detect the nature of this graph. Once identified, the aggregation operation is launched. We emphasize the notion of interactivity by giving to the user the possibility to intervene by selecting a scenario of analysis according to her point of view. Homogeneous Graph This is the most common case, wherein the graph represents a social network formed by a single community of entities (e.g., student community, readers community . . .). These entities are characterized by the same set of attributes. However, in some cases, retrieved graphs may be without knowledge (nodes are not attributed) which makes k-SNAP operation as it is, powerless to analyze these kind of graphs. Therefore, a phase of clustering seems to be necessary to generate an initial partition. The obtained partition is considered similar to that one obtained
A. Louati et al.
F IG . 1 – Global architecture.
from the A-compatible grouping step and it will be used later as an input for the aggregation step. In this first step, the user can choose one method of clustering among two: dynamic hard clustering (De Carvalho et al. (2012)) or initPartition (a priori partition). Dynamic hard clustering is a clustering algorithm appropriate to graphs issued from multiple relationships. It is able to partition nodes by taking into account their relational description given by multiple dissimilarity matrices. Concerning initPartition, it is also a clustering algorithm applied to classic graphs which nodes are not described by a set of attributes. Once the partition is generated, we execute the second step of the algorithm ensured by the function of (A, R)-compatible grouping in which user can also choose an evaluation measure among two. On the other side, if nodes are described by a set of attributes, two cases arise : (1) All attributes are categorical: this is the standard case of data sets, one joins the conventional operation of aggregation k-SNAP. (2) Presence of numerical attribute(s): we perform a discretization of numerical attributes in order to transform them into categorical attributes with few modalities. For this, we use the Gap Test algorithm. Heterogeneous Graph By Heterogeneous Graphs we mean, a kind of graph which is formed by different types of entities i.e, they do not represent a single community thus, they are not characterized by the same list of attributes. Typically, this type of graph describes the interactions between multiple corporate entities. A relational database can be a rich source for building such as graph (Soussi et al. (2011)). Knowing that the user chooses the set of attributes from a list,
Graph Aggregation
if this list is not generic especially since each attribute describes a subset of nodes and not all, the A-compatible grouping step may not be applicable. A trivial solution is to consider only the set of common attributes by searching the common denominator of all node types. Another possibility is to make conceptual classification using a formal concept analysis. Once the Galois lattice is built, the idea is to select a level wherein there is no redundancy between concepts in term of attributes. The graph partition will be made by putting the set of individuals related to each concept in a separate group. Regardless of the type of the input graph, homogeneous, heterogeneous or even without knowledge, all these scenarios converge to (A, R)-compatible grouping which is the last step in the aggregation process. Given that (A, R)-compatible grouping function is based on relations between nodes like k-SNAP, the user can choose according to her point of view one evaluation measure among two as shown in Figure (Fig 1). The first measure is a measure of homogeneity, and the second is a measure of heterogeneity. Both are different from the measure proposed by k-SNAP method. In the next section, we formally describe the principle of these measures and present our algorithm.
5
Quality measures proposed
Prior to presenting our quality measures, let us look at how the evaluation measure k-SNAP is formulated. Recall that this measure denoted 4 is based on the notion of participation ratio of each pair of group (Ci , Cj ) according to a relationship of type Rt (Tian et al. (2008)). The aggregation operation chooses at each step, the group that makes the most contribution to the 4 value with one of its neighbor groups according to the relationship Rt to be cutted into only two subgroups until the size of the grouping is equal to k. The evaluation measure of k-SNAP is defined as follows : but first, note that all calculations will be made from the incidence matrix t At = (ai,j )1