is a graph with an edge between any two IP addresses that ... P2P applications, and show that it can identify P2P traffic with ... application to assist in classifying its traffic. ... Even a single backbone link contains enough information ... link of a commercial US Tier-1 ISP at the Palo Alto Internet .... both as client and server.
Graph-based P2P Traffic Classification at the Internet Backbone Marios Iliofotou∗ , Hyun-chul Kim† , Michalis Faloutsos∗, Michael Mitzenmacher§, Prashanth Pappu¶ , and George Varghese‡ ∗
†
University of California, Riverside CAIDA and Seoul National University ‡ University of California, San Diego § Harvard University ¶ Conviva, Inc.
Abstract—Monitoring network traffic and classifying applications are essential functions for network administrators. In this paper, we consider the use of Traffic Dispersion Graphs (TDGs) to classify network traffic. Given a set of flows, a TDG is a graph with an edge between any two IP addresses that communicate; thus TDGs capture network-wide interactions. Using TDGs, we develop an application classification framework dubbed Graption (Graph-based classification). Our framework provides a systematic way to harness the power of network-wide behavior, flow-level characteristics, and data mining techniques. As a proof of concept, we instantiate our framework to detect P2P applications, and show that it can identify P2P traffic with recall and precision greater than 90% in backbone traces, which are particularly challenging for other methods.
I. I NTRODUCTION An important task when monitoring and managing large networks is classifying flows according to the application that generates them. Such information can be utilized for network planning and design, QoS and traffic shaping, and security. In particular, detecting P2P traffic is a potentially important problem for ISPs that want to manage such traffic, and for specific groups such as the entertainment industry in legal and copyright disputes. Detecting P2P traffic also has particular interest since it represents a large portion of the Internet traffic, with more than 40% of the overall volume in some networks [11]. Most current application classification methods can be naturally categorized according to their level of observation: payload-based signature-matching methods [16], [14], flowlevel statistical approaches [6], [18], or host-level methods, such as BLINC [13], [24]. Each existing approach has its own pros and cons, and no single method clearly emerges as a winner. Relevant problems that need to be considered include identifying applications that are new, and thus without a known profile; operating at backbone links [2], [13]; and detecting applications that intentionally alter their behavior. Flow-level and payload-based approaches require per application training and will thus not detect traffic from emerging protocols. Hostbased approaches can detect traffic from new protocols [13], but have weak performance when applied at the backbone [2]. In addition, most tools including BLINC [13] (which has 28 parameters) require fine-tuning and careful selection of
parameters [2]. We discuss the limitations of previous methods in more detail in §IV. In this paper, we use the network-wide behavior of an application to assist in classifying its traffic. To model this behavior, we use graphs where each node is an IP address, and each edge represents a type of interaction between two nodes. We use the term Traffic Dispersion Graph or TDG to refer to such a graph [10]. While we recognize that some previous efforts [3], [5] have used graphs to detect worm activity, they have not explored the full capabilities of TDGs for application classification. We propose a classification framework, dubbed Graption, as a systematic way to combine network-wide behavior and flow-level characteristics. Graption first groups flows using flow-level features, in an unsupervised and agnostic way, i.e., without using application-specific knowledge. It then uses TDGs to classify each group of flows. As a proof of concept, we instantiate our framework and develop a P2P detection method, which we call “Graption-P2P”. Compared to other methods, Graption-P2P is easy to configure and requires very little a priori knowledge (mainly a few intuitive parameters). The experimental part of our paper shows that: • Graption-P2P identifies over 90% of P2P traffic with precision greater than 95% in backbone traces. • Graption-P2P performs better than BLINC in P2P identification at the backbone. For example, Graption-P2P identifies 95% of BitTorrent traffic while BLINC identifies only 25%. • Even a single backbone link contains enough information to generate TDGs that can be used to classify traffic. In addition, TDGs of the same application seem fairly consistent across different times and locations. The rest of the paper is organized as follows. In §II we define TDGs, and identify TDG-based metrics that differentiate between applications. In §III we present the Graption framework and our instantiation, Graption-P2P. In §IV we discuss related work. In §V we conclude the paper. II. T RAFFIC D ISPERSION G RAPHS Definition. Throughout this paper, we assume that packets can be grouped into flows using the standard 5-tuple {srcIP,
Name TR-PAY1 TR-PAY2 TR-ABIL
Date/Time 2004-04-21/17:59 2004-04-21/19:00 2002-09 /(N/A)
Duration 1 hour 1 hour 1 month
Flows 38,808,604 37,612,752 2,057,729
TABLE I S ET OF BACKBONE TRACES FROM THE C OOPERATIVE A SSOCIATION FOR I NTERNET D ATA A NALYSIS (CAIDA). S TATISTICS FOR THE TR-ABIL TRACE , ARE REPORTED ONLY FOR THE FIRST FIVE - MINUTE INTERVAL .
srcPort, dstIP, dstPort, protocol}. Given a group of flows S, collected over a fixed-length time interval, we define the corresponding TDG to be a directed graph G(V, E), where the set of nodes V corresponds to the set of IP addresses in S, and there is a link (u, v) ∈ E from u to v if there is a flow f ∈ S between them. In this paper, we consider bidirectional flows. We define a TCP flow to start on the first packet with the SYN flag set (referred to as the SYN-packet), so that the initiator and the recipient of the flow are defined for the purposes of direction. For UDP flows, direction is decided upon the first packet of the flow. Data Set. To study TDGs, we use three backbone traces from a Tier-1 ISP and the Abilene (Internet2) network. These traces are summarized in Table I. All data are IP anonymized and contain traffic from both directions of the link. The TRPAY1 and TR-PAY21 traces were collected from an OC48 link of a commercial US Tier-1 ISP at the Palo Alto Internet eXchange (PAIX). The TR-ABIL trace is a publicly available data set collected from the Abilene (Internet2) academic network connecting Indianapolis with Kansas City. The Abilene trace consists of five randomly selected five-minute samples taken every day for one month, and covers both day and night hours as well as weekdays and weekends. Ground Truth. We used a Payload-based Classifier (PC) to establish the ground truth of flows for the TR-PAY1 and TRPAY2 traces. Both traces contain up to 16 bytes of payload in each packet, thereby allowing the labeling of flows using the signature matching techniques described in [2], [13]. Running the PC over the TR-PAY1 and TR-PAY2 traces we find 14% of the traffic to be P2P, 28% Web, 6% DNS, and the rest to belong to other applications, such as Email, FTP, NTP, SNMP, etc. For our study, we remove the 2% of traffic that remained unclassified and the 28% that contained no payload. A. Identifying P2P TDGs Identifying the right metrics to compare graph structures is a challenging question that arises in many disciplines [17]. Our approach is to consider several graph metrics, each capturing a potentially useful characteristic, until a set of metrics is found that distinguishes the target graphs. To select an appropriate set of metrics, we generate a large number of TDGs using all our traces (Table I), thus observing TDGs over two different locations at the backbone. For the 1 The authors thank CAIDA for providing this set of traffic traces. Additional information for these traces can be found in the DatCat, Internet Measurement Data Catalog [26], indexed under the label “PAIX”.
TR-PAY1 and TR-PAY2 traces, we use the payload-based classifier (PC) in order to select which flows belong to each TDG. Since the TR-ABIL trace does not have any payload information, we use port numbers [2] to assign flows to applications. We can use port numbers for the TR-ABIL trace since it was collected in 2002 where most P2P applications used their default port numbers [7], [12]. We only use the TR-ABIL trace to verify our TDG observations over a second location in the backbone and we do not use it in the final evaluation of our classifier. By using the month-long TR-ABIL trace, we can study the consistency of TDGs over different times of the day and over weekdays and weekends. We observe TDGs over 5-minute intervals. This interval length gives good classification results and stability of TDG metrics over time. For each TDG we generate a diverse set of metrics. Our metrics capture various aspects of TDGs including the degree distribution, degree correlations, connected components, and distance distribution. For additional details about these metrics we refer the reader to [9], [17]. To select the right set of metrics we use various graph visualizations and trial and error. Finding a less ad hoc approach is beyond the scope of this work. Two TDG visualization examples are shown in Figure 1. We see that FastTrack (P2P) has a denser graph than HTTPS, or a higher average degree, where the average node degree k¯ is given by k¯ = 2|E|/|V |. We utilize two other metrics that capture the directionality of the edges in the graph and the distances between nodes. The directionality is useful since we know that pure clients only initiate traffic, pure servers should never initiate traffic, and that some P2P nodes play both roles. To capture this quantitatively, we define InO to be the percentage of nodes in the graph that have both incoming and outgoing edges. The distance between two nodes is defined as the length of their shortest path in the graph. The diameter of a graph is defined as the maximum distance between all pairs of nodes, which is sensitive as a metric [17]. For a more robust metric, we use the effective diameter (EDiam), which we define as the 90-th percentile of all pairwise distances in the graph. From our measurements, we empirically derive the following two rules for detecting P2P activity. Rule 1: k¯ > 2.8 and InO > 1%; Rule 2: InO > 1% and EDiam > 11. With these simple rules, we can correctly identify all P2P TDGs from both backbone locations (Abilene backbone and Tier-1 ISP). Intuitively, P2P hosts need to be connected with a large set of peers in order to perform tasks such as answering content queries and sharing files, which can explain the higher average degree compared to client-server applications. An additional characteristic of P2P applications is the duality of roles, with many hosts acting both as client and server. The duality of roles is in turn captured by the high InO value. We further speculate that the decentralized architecture of some P2P applications (such as BitTorrrent), can explain the high diameters in some P2P TDGs. Additional speculations on why these three metrics effectively capture P2P behavior is provided in [9] and are omitted due to space limitations.
402 1330
1840
1814
1787
and then use graph metrics on the remaining traffic. In addition to port inspection, we can also examine the payload of a flow in order to verify that it follows the expected application-layer interactions. As a future work, our goal is to select metrics that can further help to separate between collaborative applications (e.g., DNS) and P2P. We discuss similar topics again is §III-C. We do not claim that our thresholds are universal, but our measurements suggest that small adjustments to these simple parameters allow our methodology to work on different backbone links. Furthermore, the three thresholds (InO, EDiam, and average degree) are observed to remain stable over time.
1785
1562
1408
884
1933 1593
1841
1815
1582
1788
1786
403 1329 1315
1279
1261
1510
1594
1583
910
998
476
1153 719 831 1316
1280
1262
1006
14 807 694 999
716
994
618
443
1357
808
523
658
639
1724 1559 1509
1358 1954
1133
718 1124
1442
640
284
943 753
928
1680
13
717
619
444
1233
1636 486 1681
1609
323 1150
728 1390
1766
137
1576 735
192
586 3 657
285 1361 745 1391
1767
453
601 1455 442
325 1596
1149
251
389 1154 342
1586
191
117
1597
1867
585
656 136
1566 932
1216 1205
118
454
1665
1188 947 388 1761 1307
1222 513 780 1619
110
607 1569
1614
495
960
1223
1600 1463
974 1826
946 900
398 1210 1522
310
55 1560
1314
1783 1898 1187 1686
740
418 1802 934
1590 1838
692
1199 1691 1638
56
779
1001
1437
1529
876
1464
1687
680
1512 60 1429
1858
1902
750 469 1528
1470 399
309 33 130 377 490 749
1568
531 1206
417 1526 592 1859
1335
783 611
249
198
574
1641
899 959 1114
1670
965
565
669
49 1309
1364 357
1207
647 834 1818
489
671 958 1552 1057
1939 422 746 1424
748 1387
465
1453 1946 280 1097 69 1301
1827
1320
1373
1816 1192
508
757 915 1776 1622
1284 85 544
522
330 1864
1803
665
32
1491
691
1177 1906 144
1324 1202 1234 954
86
1618
131
1385 148 1029
50 1392
891 1115 1056 1431
1203
470 545
61
70
520
1685
356
1439 1180 1592 1690 1248 1393
199 1715 370 970 401
166
1487
355 1551 317 1805 527 855 423
1503
253 778
1817
1578
916 195
143 1113 911
519
279
409 1834
1616
427 846
145 1642
1266 723
1459
1474
1395 1182
1862
446 1384
684 1896
528 711 1499 1258 1028 149
1200
1882 1336
62
73
990
499 1643
546 425
1723 1121
789
1250
552
1449 1036
313 111 1008 187 1806
1661 1716
1919
74
991
210 1419
1621 59
1089
1160
581 252 387 599 1625
1644
1169 1445
882 1916
212 316
119 580
197
704 77 1084
1117
1769
1360
209
696 887 8
1208 312
1722 1268 345
596 393
1645
896 1733 1126
385
1648
282 1186
790
1027
112
792
1707 426
1185
1215
1069
215
186
413
400 1753 982 1922 804 1444
981
708 38
1897
194 1520
1007
829 568 1271
24
1672 1132
213
567 772 1138
677
1064 1035 765
394 1396
613
557 705
556
179
1129 188 1142 1061 363
1673
6 886 1120 358 1843 1732 1465
438
1602 1042 1174
412
1917 747 862
767 583
303
452
283
1574
135 346
1653
695 968
428
40
5 429 1041 908 1217
221
343
243 1231
1
241
549
25
1671
1173
1676
501 318 1650
1166
78 484
791
830
572 324 1096
97
185
1065
272
10 376
879
963
222
81 1434
216
1893
623 271
731
1533 134 1869 709 386
7
319
1808
1189 784
133 1466
341
30
129
180
227
622 534 1058 795 392 1441
231
768
479 439 193
624
93
1088
563
1141 1270
39
1190 1494
1151
835
616 2 1518
1272
730
226 1162
82
612
861
1131
478 1108 1461 598
1148
1371 548 361 650 359 94
674
306
666 301
411 264 584 9
803
836 1220 302
1181 873
1354
500 114
987
1032
488
1699
1947 467
165
1538 562
132
464
1256
509 98 1469 897 485
434
396
1935
46
1125
1489
175 1689
633
1098 1740 675
211
852 853 988 1146
1196 1147
872
1345
901
270 1626
104
902 64
43
610 435
1567
931
907 232
1054
269
654
177 204 1204 1246
415 1550 223
487
1952
31 455 29 63 375 45
615
378
155
638
608 843 1835
1525 1346 1577
920 89
1404 989
655
1195
1580
445
178
786 1793 587 661
948
1611
785 404 107
158 1564
173
1318 714
649
885 414 961
774
898
1297 921 1863 206 92 140 667
263
1928
850 1446 1237 518
1683
1542
1764 1228
34
755
1860
1286 1467 793
1504 962
1389
1861
832
1704 233 1514 1640 1714 1285 679
1472 286
1476
1617
369
267
952
938 90 1684
157
174
1877
1765 379
573 1555
1795 170 127
26
1892
1488
368
756
156 1921
589 27
102
1780
1278
1283 945 517 1394
340 17
35
564 837
468
1051 276
1748 277
828 91 482
698 463
1184
1693
917 892 859
19
561
126 245 582 1423 766
630
22
1274
641 877 883
1018
483 895 1343
1235
668
918
169 1194
838 1178
1074
268
752 600 724 459 964 1053 605
147
352
504
1339 458
995 116
281
973 1695
172 1471 697
1327 617 381 1014 707 678
1004
351
1251
1226
288 733
1048
246 287
41 42
100
1055
462
1398 1591 1696
1735 254
939
503
1702 844 18
1383 208 1152 555 171
1137
III. T HE G RAPTION F RAMEWORK
575
1212 1218
1951 1145 146
996
163 1060
1328 23
1709
258
1080
912
1033
1728 339 1090
1778
670 1312
122
626
344 942
335
827 1955 1325 1139
1473 560
1548
1531
99
1710
1485
913
294 1768 682 1291 1201 535
683 296
1260
53 1034 436 1005
758 550
440
1536
662
293 1631 1399
1259
322 1416 687 88 1868
541 951
142 839
905 461 1242
542 625
21 997
1219 1356
257 530 1537 234
79
1211
732
1221
1725
1244
16
1298
906 502 66 1374
141 1942
350 224 971 496
138
893 1456 1105
1252 182 295
1744 431
903
1943
1031
579
1292 1865
419
238 1401
1066 331 702
1197
875 1726
1191 1379
124 510
292
759 430
150
1093 354 300 1759 75 1701 1656 54 1388
1425 591 1402
1267 421 1106
332
151
1475
985
1047
644 1554
159 631
380
1779
80
922 266 1183
1571
87
1403
634
1847 842 645
183
760 1310
514 1692
456
1807 1430 225
237
663 1782 1572
15 689
1273 703 333
218
802
1412 315
76 1352 265 337
1094 796 511 336 1413 953 1757
1289 307 526
1784 871
980
228
797
688 1669
338 1311
646 1410 761 822
1910
713
975 1380
457
594
184 1411 1756 314 334 925 424 629
1545 1754
1428 1288
217
1317
595 298 525 801
1711
1934 1099 1255
328
1755
776
1294 1009
1015
297
203
1647
1589 1889 1515 712 1159 1163 67
1010
794
1046
202 200
120
1907 348 367
1164 1508 1544 1637
864
95 1871
68
121
1905
1904 11
1774 289
450
1872
788
775
1282
1789
1209 1697
96 681
290
449
321 52 543 1866
1355 12
1729
1397
371 651 863 366 364
255
1134
349 1660
1700
320 554
1478
408
515
373
447
365
256
533
1135
721
603
1479
577
516
553
374
699
407
273
1039
51
448
620
604
787
652
327
1305 1170 372 814
816
825
726
769
781
1486
700
722
621
1019
815
653
848
817
826
727
1483
1492
770
1100
782
1102
1020
1717
1118
1127
849
1155
1738
1505
1484
1493
1534
1101
1874
1718
1119
1128
1746
1739
1553
1751
1506
1535
1890
1875
1540
1103
1873
1720
1541
1926
472
1925
819
1747
1752
1891
1927
1630
1961
3523
3532
3531
3277
3313
202
3337
3343
3350
3354
3364
3518
2805
2817
3014
3030 2823
2844
2633
2637 3309
3522
2647
1765
3312
2535 3317
2545 3336 3013
3342
3029
3349
553
3353
2420
1246 3363
2804
1920
2527
2147 343
1835
2632
3272
1400
1435
830
1442
2140
1566
1834
321
1031
1051 1885 1575
1577
1671
1908
3271
2730
648 1399
477
2799
2700
1023
476
2860 2977
520
1372
523
2859
2523
1828
780
2699
869
2132
308
2783
2217
1558
3264
997
298
1803
1530
307
2782
2216
644
968
1557
233
293 1450
3375
2346
384
2089
1579
404
610
3345
2777
1243
3373
110
1187
2628
3465
2121
1034
2427 1644
403
518
794
255
1244
3257
2101
57
20
2757
2629 2137
3253
2611
962
2095 617
337 2218
1245 1734
183
1283
2226
956
3252
2094 2463 167
2322
955
1537
467
335
3505
1197 181
3166
334
1842
1356
161
2497
1318
311
1898
3247
1655
675
349
320
2496
1801
3008
2490
1781
1820
3246 674
348
3420 2521
98
96
847
704
3007
1780
2489
294
3202
2192
2382
2486
547
1779
1145
331 1973
2816
1001
2485
642
1778
1144
1164 1974
2984
2478
456
607
1127
328 159
1351 1807
498
2983
2477
606
1769
1126
2982
2469
600
1095
40
219
336
2877
2981
2468
599
1752
1094
261
218
3241
2606
2086
106
3059
3036
3240
210
2085
1359
2554
232
1675
3498
2762
216
2406
2210
3497
2761
2209
1260
1085
3282 1639
499
1494
2385
133
2650
669
1740
1084
3199
2605
2123
929 657
887
2649
2493
2286 402
883
882
846
784
769
668
453 452
2648 1285
1275
1269
3198
1738
1725 928
1712
1708 886
2201
1737
1724 2737
1711
3185
3168 2453
3170 2421
2955
1545
3184
3067
99
3479
3477
3467
3169
2935
2736
2720 1157
2713
2715
2230
3488
3480
3478
2414
2320
2338
2323 2278
2769 2914
3440
3134
3131
2902 3426
2331
3135
597
2581
578
3411
2579
3427
2315
746
3132
624
2917
2952
2936
2049
2040
2929
1944
2721
1707
2600
1531
2454
1344
1284 2422 1513
2415
2399
1274
2339
2332
1466
2915
2006
2716
511
1686
1649 2703 1305
2303
2694
3412
2324
1268 1492
2215
1480
2582
2580
1470
2316
1231
3489
1082
2050
2014
906
889
271
881
845
2009
2007
783
1687
768
1218
2003
2304
737
1650
2604
1690
1532
3314 1514
1493
1481
1471
3128
868
1232
94
2998
503
1083
2383
1219
2004
2228
738
1759
363
2999
2671
525
1965
1913
2088
1972
1784 2384
3129
2087
1683
454
132
117
1432
944
2287
1588
1441
1640
1525
500
1386
2672
118
1599
925
1102
2202
3109
1433
1589
3536
2464
918
2292
2956
3398
459
3077
1943
428
2479
460
2285
1988
429
3306
1542
3210
1666
374
2423
267
280
1565
1625
1552
1717
2896
2994
791
897
569
2224
3239
203
3
88
1936
1236
3365
72
2106
1947
3255
493
174
3106
1489
2681
961
2538
2263
2274
2897
25
2180
1877
26
17
2657
545
239
2268
3302
2644
1598
1360
323
3096
213
2682
992
434
1077
1613
2181
2260
2104
1482
1863
375
14
3361
1556
1847
2301
206
1301
39
1019
1047
214
324
627
262
2751
2244 284
634 1078
1614
2261
2018
1753
3032
825
2243
1008
342
114
724
3122
378
487
120
2788
316
2197
960
15
1907
327
832
486
1046
2220
1930
1380
193
2578
1806
226
448
2221
1859
478
1205
436
3437
3123
122
16
991
449
194
121
1544
299
740
282
736
497
2904
227
392
1889
2601
1860
641
160
170
1582
169
330
951
1949
1176
640
3204
983
1070
290
836
300
3054
2063
3245
38
800
1332
50
2008
1175
2573
3094
283
953
1583
3040
97
95
85
2473
1123
633
717
649
245
801
1333
1279
164
514
86
541
2200
2051
2574
3095
2378
49
107
248
2005
1524
112
246
660
1278
3270
319
544
2435
638
1609
152
1902
1900 2852
368
1308
1309 108 835
131
611
2903
1009
2771
613
285
113
748
1879
1206
3043
1148
551
1880
139
482
2853
2567
3592
744
382
189
745
2706
1610
1297
656
2498
1624
3561
1012
447
2692
2946
1596
1053
301
1855
1401
2931
1149
2288 819
687
1462
2176
3582
2568
1533
130
302
2652
190
405
446
1117
636
842
741
1362
1427
469
470
2918
778
3090
1054
1210
2763
688
2411
1463
2177
3583
661
879
195
2505
162
2679
527
538
2717
3275
1000
577
182
2275
3328
561
2665
988
3091
1685
1428
1662
2610
1538
247
468
1890
528
650
3124
989
2832
880
3584
1661
2589
2591
421
2627
2227
2630
2891
2666
168
3092
414
1496
87
2926
1798
3082
2439
3399
1805
587
2813
242
3585
184
618
1727
1255
1314
2752
1995
1688
3589
1528
415
1704
1749
2440
329
3258
1366
2457
804
963
1541
2452
505
2856
2223 432
785
433
2023
3299
517
36
2660
1387
2205
367
399
2311
3458
265
44
2964
1413
2927
2380
858
179
915
2185
3591
430
2584
994
2102
857
3026
391
3211
2878
45
256
153
860
3033
1367
2661
859
585
1143
3042
253
2109
3076
1125
1167
1203
2000
2561
815
519
3577
2013
3108
89
664
1147
111
2626
1361
1453
752
2096
8
912
586
2068
2404
297
871
1627
957
1520
873
309
385
1204
2001
2562
3081
665
2368
3538
279
2127
751
2839
969
2685
1515
1217
872
711
373
2976
2472
1519
3044
818
438
310
1229
3340
1561
243
2372
1516
416
3265
1665
64
372
1534
1535
244
1151
2027
723
3062
817
417
1800
647
63
2524
351
1174
870
589
1572
1050
483
1062
1327
1030
1831
2139
1024
1395
521 2350
1092
3528
1199
828
1159
524 1013
1459
2163
2038
2550
3063
2906
1434
1448
306
722
3075
1608
1189
1063
2146
1160
1200 1517
1460
1173
2164
3334
1449
2678
2294
554
80
2534
1567
2636
1845
1886
720
1576
1578
2655 1249
2646
1909
305
1756
1378
1996
1042
2822
2843
2845
3422
2148
1757
220
3049
1635
3574
1846
188
406
3533
157
2656
187
2846
3050
2812
1621
3575
875
3534
407
1637
922
876
3045
1980
3172
1979
2688
2689
3307
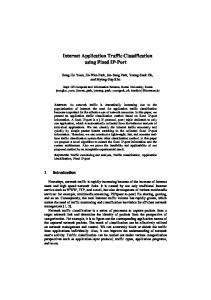
(a) The FastTrack (KaZaa) TDG (P2P application).
The Graption framework consists of the following three steps. Step 1. Flow Isolation. The input is network traffic in the form of flows as defined in §II. The goal of this first optional step is to utilize external information to isolate any flows that can already be classified. This knowledge could be based on payload signatures, port numbers, or IP address (e.g., exclude flows from a particular domain such as google.com). Step 2. Flow Grouping. We use similarity at the flow and packet level to group flows. The definition of similarity is flexible in our proposed methodology. We can use flow statistics (duration, packet sizes, etc.) or payload if this is available. Eventually, the output of this step is a set of groups with each group ideally containing flows from a single application (e.g., Gnutella, NTP, etc.). However, at this step, the exact application of each group is not known. Step 3. Group Classifier. For each group of flows, we construct a TDG. Next, we quantify each TDG using various metrics. The classifier uses these metrics to identify the application for each group of flows. For the classification decision, we use a set of rules which in general depend on the focus of the study. Although this paper focuses on P2P detection, Graption can be used for general application classification by choosing metrics and parameters appropriately. We next describe how we specialized Graption to detect P2P traffic (Graption-P2P).
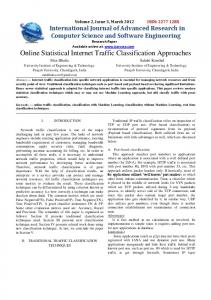
(b) The HTTPS TDG (client-server application). Fig. 1. Two TDG visualization contrasting a P2P with a client-server application. Largest component is with bold edges.
Distinguishing collaborative applications from P2P: Some well-known applications other than P2P exhibit collaborative behavior, such as DNS and SMTP. This is not surprising since in these applications servers communicate with each other and ¯ and servers act both as clients and with other clients (high k), servers (high InO). This is exactly what our metrics are set out to detect. It has been reported recently [2] that port numbers are fairly accurate in identifying such legacy applications, although they fail to identify P2P and other applications with dynamic use of port numbers. Therefore, one could use legacy ports to pinpoint and isolate such collaborative applications
A. Implementation Details of Graption-P2P Step 1. This is an optional step in our methodology. Experiments without this step are discussed later in the section. Recent work [2] suggests that port-based classification works very well for legacy applications, as legacy applications use their default ports and tunneling of P2P at such ports is not very common. Thus, in this study, we isolated flows with port 80 for Web, port 53 for DNS, and port 25 for SMTP. These applications turn out to be about 65% of the total number of flows. In our traces, the proportion of P2P actually using one of these ports is as low as 0.1%. Step 2. To implement flow grouping we use the fact that application-level headers are likely to recur across flows from the same application. Therefore, payload similarity can be used to group flows. In Graption-P2P, we only use the first sixteen bytes from each flow. As we show, sixteen bytes are sufficient
100
94
95
92
90
F-Measure (%)
Clustering Performance (%)
96
90 88 86 84
Precision Recall Precision Recall
82 80 0
40
80
120
200
80 75
65 60 240
Number of Clusters (k)
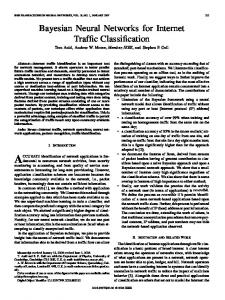
Fig. 2.
85
70
(TR-PAY1) (TR-PAY1) (TR-PAY2) (TR-PAY2)
160
k=120 k=160 k=240
Evaluating K-means.
to give very good classification results. This observation agrees with findings in [16], [14]. Even though we use the payload bytes, our grouping is agnostic to application semantics, as each byte is considered as a single independent categorical feature. We consider each byte as a single categorical feature in the range {0, 1, ..., 255}. The flow grouping step comprises two substeps: cluster formation and cluster merging. a. Forming Clusters. Given the set of discriminating features, the next step is to cluster “similar” flows together. We use the term cluster to describe the outcome of an initial grouping using the selected features. Clusters may be merged in the next function of this step to form groups, which produces the final output. Feature-based clustering is a well-defined statistical data mining problem. For this task we used the popular K-means algorithm [22]. This algorithm has been commonly used for unsupervised clustering of network flows [6], [16], with very good results and low computational cost. K-means operates with a single parameter that selects the number of final clusters (k). As we show later in our evaluation, our classifier gives very good results over a large range of k. The similarity between two flows is measured by the Hamming [22] distance calculated over the 16 categorical features (i.e., the payload bytes). Even though more involved similarity measures such as edit-distance (also known as Levenshtein distance) exist, Hamming distance has been used successfully before [8] and performs very well in our application. b. Cluster merging. During clustering, it is likely that the same application generates multiple clusters. For example, many P2P protocols exhibit a variety of interaction patterns, such as queries (UDP flows) and file transfers (TCP flows), each with significantly different flow and packet characteristics [12]. This motivates mergings clusters that we expect to belong to the same application into groups. This grouping provides a more complete view of the application and aides in understanding the structure of the P2P protocol, as we show in §III-B. Cluster merging cannot be based on the chosen set of flowlevel features that were already used to create the clusters
0
0.1
0.2
0.3
0.4
0.5
0.6
0.7
0.8
0.9
1
Similarity Threshold
Fig. 3. Graption-P2P achieves > 90% F-Measure over a large range of similarity thresholds and number of clusters (k).
originally. Instead, in the case of a P2P protocol, it is natural to assume that the TDGs corresponding to each cluster of the same protocol would share a large number of common nodes (IP addresses). Based on these observations, we use an Agglomerative (Hierarchical) Clustering Algorithm that recursively merges clusters with significant similarity in IP addresses. We used the following metric to calculate similarity between clusters: Sim(C1 , C2 ) = (Number of flows having their source or destination IPs present in both clusters) / (The number of flows of the smaller cluster). The cluster merging process starts by hierarchically merging clusters with high similarity and stops when the similarity between all new cluster pairs is below a similarity threshold (ST). As we show later in our evaluation, our classifier gives very good results over a large range of similarity thresholds. Step 3. The outcome of the previous step is a set of groups of flows, with each group consisting of flows that we hope stem from a single application. In order to classify each group, we generate a TDG on the group in the same way as described in §II. Each group yields a TDG that can be summarized using graph metrics. To identify P2P TDGs, we used the rules extracted from §II-A. When a group is labeled as P2P then all the flows of that group are classified as P2P flows. B. Evaluating Graption-P2P To evaluate Graption-P2P, we use traces TR-PAY1 and TRPAY2, where we have the ground truth using the payload classifier (§II). We compute the True Positives, False Positives, and False Negatives. The True Positives (TP) measures how many instances of a given class are correctly classified; the False Positives (FP) measures how many instances of other classes are confused with a given class; and the False Negatives (FN) measures the number of misclassified instances of a class. In our comparisons, we used the following standard metrics: Precision (P), defined as P = T P/(T P + F P ); Recall (R), defined as R = T P/(T P + F N ); and the F-Measure [22], defined as F = 2P · R/(P + R), combining Precision and Recall. We first test the ability of K-means to generate clusters with flows from a single application. After forming the clusters
C. Discussion
100 95
F-Measure (%)
90 85 Ground Truth Graption-P2P: Merging Graption-P2P: No Merging
80 75 70 65 60 80
100
120
140
160
180
200
220
240
Clusters (k) in K-means
Fig. 4. Graption-P2P with and without cluster merging. Results are also compared with cluster labeling based on ground truth.
with K-means, we use the ground truth and label each cluster as belonging to the application with the majority of flows. All the flows of a cluster are then classified to belong to this dominant application. The P and R of K-means as we increase k for both traces are shown in Figure 2. We observe that with sufficiently large k (> 120) we achieve very good results with P and R above 90%. Using Graption-P2P, we achieve high F-Measure over a range of values of k (K-means) and similarity thresholds (ST). We show this in Figure 3, where we vary the ST from 0.01 to 1 and use a sufficiently large k (see Figure 2). All experiments are averaged over each disjoint 5 minute interval of both traces. Intuitively, by using a very large ST, the clusters of an application are not grouped together, which results to TDGs that are harder to classify as P2P. On the other hand, with a very small ST, clusters belonging to different applications are merged together leading to poorer classification performance. The results in Figure 3 show that we achieve good classification performance (> 90% F-Measure), over a large range of similarity thresholds and number of clusters (k). In Figure 4, we compare our approach with labeling each cluster using the ground truth (i.e. without merging any clusters and labeling each cluster based on the dominant application). Intuitively, for a given clustering of flows, the ground truth shows the best that any cluster labeling mechanism can achieve. For merging, we use an ST of 0.5. From Figure 4, we see that Graption-P2P deviates only slightly from labeling clusters using the ground truth. In the same plot, we also compare Graption-P2P without the cluster merging step, highlighting the benefit of merging clusters of the same application together. Using a ST of 0.5 and k = 160, Graption-P2P achieves above 90% Recall and above 95% Precision over all disjoint 5 minute intervals for both traces. To apply Graption-P2P to other backbone link, the same selection processed can be repeated to adjust the values of ST and k. Our experiments show that the classification performance can degrade with a very bad choice of parameters. However, as shown in Figures 2, 3, and 4, for reasonable choices for k and ST, our method provides very good results.
Comparison with BLINC [13]. We used BLINC to classify traffic over both TR-PAY1 and TR-PAY2 traces. BLINC was optimized after several trial and error efforts to achieve its best accuracy over these traces, as described in [2]. The Recall and Precision for BLINC are 84% and 89% respectively. In particular, BLINC has significantly lower performance for some P2P applications. For example, Graption-P2P detects 95% of BitTorrent traffic, while BLINC detects only 25%! Our experiments suggest that BLINC and possible other hostbased approaches work well when applied at the edge, where a large fraction of host flows are observed and hence enough evidence is collected to profile each node. However, this is not always true for backbone monitoring points which can explain BLINC’s lower performance. These observations are also supported by findings in [2]. Other Configurations. We have tested Graption-P2P without using payload under the assumption that payload is encrypted. For grouping flows we used packet size information (i.e. min, max, and the size of the first five packets) and protocol (UDP or TCP). Our method performed comparably well with R and P above 88% in both traces. We also experimented without using Flow Isolation. To achieve good results (P, R > 85%) we had to increase k (> 300) in K-means, which made cluster merging more challenging. More details are omitted due to space limitations. Evaluating Graption with other configurations and different data mining clustering algorithms is included in our future work. Enhancing Isolation. To improve isolation we can enforce payload inspection in addition to port-based filtering. For example, we can test all DNS flows at port 53 to see if they also have a DNS payload signature or if another protocol is tunneling its traffic under the DNS port. If payload is encrypted, then we can choose to use flow-level feature such as packet sizes [2] or white-listed IP addresses [21]. IV. R ELATED W ORK Traffic Classification. As an alternative to port-based methods, some works used payload [16], [14]. Other approaches use Machine Learning (ML) methods to classify traffic using flow features (e.g, packet sizes). For an exhaustive list and comparison of ML methods we refer the reader to [18] and [2]. Our work has more in common with unsupervised data mining methods which group similar flows together. All previous methods [15], [6] require manual labeling of clusters. Our work bridges this gap by providing a method to automatically label clusters of flows based on their network-wide behavior. In BLINC [13], the authors characterize the connection patterns (e.g., if it behaves like using P2P) of a single host at the Transport Layer and use these patterns to label the flows of each host. BLINC uses graph models called graphlets to model a host’s connection patterns using port and IP cardinalities. Unlike TDGs, graphlets do not represent network-wide host interaction. In some sense, TDGs represent a further level of aggregation, by aggregating across hosts as well. Thus it is perhaps fair to say that while BLINC hints at the benefit
of analyzing the node’s interaction at the “social” level, it ultimately follows a different path that focuses on the behavior of individual nodes. As we show, our approach performs better than BLINC in our backbone traces. Similar to BLINC, other host-based method [1], [23] target the identification of P2P users inside a university campus (i.e., network edge). Unlike Graption, in [1], [23], [13] they do not use network-wide host interaction. In [4], the authors use a port-based method to identify P2P users, using their temporal appearance and connection patterns in a trace. The most recent host profiling method is by Trestian et al. [21]. They used readily available information from the Web to classify traffic using the Google search engine. They show very good results for classifying flows for legacy application, but their results are not promising for P2P detection because of the dynamic nature of P2P IP hosts. Our method can be used to complement the work in [21]. Worm Detection. Graphs have been used for detecting worm activities within enterprise networks [5]. Their main goal was to detect the tree-like communication structure of worm propagation. This characteristic of worms was also used for post-mortem trace analysis (for the identification of the source of a worm outbreak, the so-called patient zero) using backbone traces [25]. More recent studies use graph techniques to detect hit-list worms within an enterprise network, based on the observation that an attacker will alter the connected components in the network [3]. Measurements. Statistical methods are used in [24] for automating the profiling of network hosts and ports numbers. The connectivity behavior and habits of users within enterprise networks is the focus of many papers, including [20]. In [19], the authors study P2P overlays using passive measurements, but target mainly the profiling of P2P hosts. None of the above papers targets P2P detection. V. S UMMARY
AND
C ONCLUSIONS
The underlying theme of our work is to go beyond just monitoring individual packets, flows, or hosts, to also monitoring the interactions of a group of hosts. Towards this end, we introduce TDGs and show their potential to generate novel tools for traffic classification. Based on TDGs, we developed Graption, a graph-based framework, which we then specialize (Graption-P2P) for the detection of P2P applications. We show that Graption-P2P classifies more than 90% of P2P traffic with above 95% precision when tested on real-world backbone traces. ACKNOWLEDGMENTS This work was supported by NSF grant NETS-0721889, a Cisco Systems, Inc. URP grant, the IT R&D program [2007-F-038-02, Fundamental Technologies for the Future Internet], and the ITRC support program [IITA-2009-C10900902-0006] of MKE/IITA. The SDSC’s TeraGrid and compute resources are supported by the NSF grant CONMI CRI0551542. Michael Mitzenmacher was supported in part by NSF grant CNS-0721491 and research grant from Cisco
Systems, Inc. Support for CAIDA’s Internet traces is provided by the National Science Foundation, the US Department of Homeland Security, CAIDA Members, and the DatCat system. R EFERENCES [1] BARLETT, G., H EIDEMANN , J., AND PAPADOPOULOS , C. Inherent Behaviors of On-line Detection of Peer-to-Peer File Sharing. In IEEE Global Internet (2007). [2] H YUN - CHUL K IM , H., C LAFFY, K., F OMENKOV, M., BARMAN , D., FALOUTSOS , M., AND L EE , K. Internet Traffic Classificatoin Demystified: Myths, Caveats, and the Best Practices. In ACM CoNEXT (2008). [3] C OLLINS , M. P., AND R EITER , M. K. Hit-List Worm Detection and Bot Identification in Large Networks Using Protocol Graphs. In RAID (2007). [4] C ONSTANTINOU , F., AND M AVROMMATIS , P. Identifying known and unknown peer-to-peer traffic. In IEEE NCA (2006). [5] E LLIS , D., A IKEN , J., ATTWOOD , K., AND T ENARGLIA , S. A Behavioral Approach to Worm Detection. In ACM CCS WORM (2004). [6] E RMAN , J., A RLITT, M., AND M AHANTI , A. Traffic classification using clustering algorithms. In ACM MineNet (2006). [7] G ERBER , A., H OULE , J., N GUYEN , H., ROUGHAN , M., AND S EN , S. P2P, the Gorilla in the Cable. In NCTA (2003). [8] H AFFNER , P., S EN , S., S PATSCHECK , O., AND WANG , D. ACAS: automated construction of application signatures. In ACM MineNet (2005). [9] I LIOFOTOU , M., PAPPU , P., FALOUTSOS , M., M ITZENMACHER , M., K IM , H., AND VARGHESE , G. Graption: Automated Detection of P2P Applications in the Internet Backbone. Tech. rep., UC Riverside, 2008. [10] I LIOFOTOU , M., PAPPU , P., FALOUTSOS , M., M ITZENMACHER , M., S INGH , S., AND VARGHESE , G. Network Monitoring Using Traffic Dispersion Graphs (TDGs). In ACM IMC (2007). [11] IPOQUE. Internet study 2007 file hosters like rapidshare and streaming services like youtube. 2007. [12] K ARAGIANNIS , T., B ROIDO , A., B ROWNLEE , N., KC CLAFFY, AND FALOUTSOS , M. Is p2p dying or just hiding? In IEEE GLOBECOM (2004). [13] K ARAGIANNIS , T., PAPAGIANNAKI , K., AND FALOUTSOS , M. BLINC: Multi-level Traffic Classification in the Dark. In ACM SIGCOMM (2005). [14] M A , J., L EVCHENKO , K., K REIBICH , C., S AVAGE , S., AND V OELKER , G. M. Unexpected means of protocol inference. In ACM IMC (2006). [15] M C G REGOR , A., H ALL , M., L ORIER , P., AND B RUNSKILL , J. Flow Clustering Using Machine Learning Techniques. In PAM (2004). [16] M OORE , A., AND PAPAGIANNAKI , K. Toward the accurate identification of network applications. In PAM (2005). [17] N EWMAN , M. E. J. The structure and function of complex networks. SIAM Review 45 (2003), 167. [18] N GUYEN , T. T., AND A RMITAGE , G. A survey of techniques for Internet traffic classification using machine learning. IEEE Communications Surveys and Tutorials 4th edition (March 2008). [19] S EN , S., AND WANG , J. Analyzing peer-to-peer traffic across large networks. IEEE/ACM Transaction on Networking 12, 2 (2004), 219– 232. [20] TAN , G., P OLETTO , M., G UTTAG , J., AND K AASHOEK , F. Role classification of hosts within enterprise networks based on connection patterns. In USENIX ATC (2003). [21] T RESTIAN , I., R ANJAN , S., K UZMANOVIC , A., AND N UCCI , A. Unconstrained endpoint profiling (Googling the Internet). In ACM SIGCOMM (2008). [22] W ITTEN , I. H., AND F RANK , E. Data Mining: Practical machine learning tools and techniques, Morgan Kaufmann, 2005. [23] W. John and S. Tafvelin. Heuristics to classify Internet Backbone Traffic based on Connection Patterns. In ICOIN, 2008. [24] X U , K., Z HANG , Z., AND B HATTACHARYYA , S. Profiling Internet backbone traffic: Behavior models and applications. In ACM SIGCOMM (2005). [25] Y. Xie et al. Forensic analysis of epidemic attacks in federated networks. In IEEE ICNP, 2006. [26] DatCat, Internet Measurement Data Catalog. http://www.datcat.org.