Graph-based Word Clustering using a Web Search Engine Yutaka Matsuo National Institute of Advanced Industrial Science and Technology 1-18-13 Sotokanda, Tokyo 101-0021
[email protected]
Takeshi Sakaki University of Tokyo 7-3-1 Hongo Tokyo 113-8656
Kˆoki Uchiyama Hottolink Inc. 2-11-17 Nishi-gotanda Tokyo 141-0031
[email protected]
Mitsuru Ishizuka University of Tokyo 7-3-1 Hongo Tokyo 113-8656
[email protected]
Abstract
grams, various tasks are attainable using webbased models: spelling correction, adjective ordering, compound noun bracketing, countability detection, and so on (Lapata and Keller, 2004). For some tasks, simple unsupervised models perform better when n-gram frequencies are obtained from the web rather than from a standard large corpus; the web yields better counts than the BNC. The web is an excellent source of information on new words. Therefore, automatic thesaurus construction (Curran, 2002) offers great potential for various useful NLP applications. Several studies have addressed the extraction of hypernyms and hyponyms from the web (Miura et al., 2004; Cimiano et al., 2004). P. Turney (2001) presents a method to recognize synonyms by obtaining word counts and calculating pointwise mutual information (PMI). For further development of automatic thesaurus construction, word clustering is beneficial, e.g. for obtaining synsets. It also contributes to word sense disambiguation (Li and Abe, 1998) and text classification (Dhillon et al., 2002) because the dimensionality is reduced efficiently. This paper presents an unsupervised algorithm for word clustering based on a word similarity measure by web counts. Given a set of words, the algorithm clusters the words into groups so that the similar words are in the same cluster. Each pair of words is queried to a search engine, which results in a co-occurrence matrix. By calculating the similarity of words, a word co-occurrence graph is created. Then, a new kind of graph clustering algorithm, called Newman clustering, is applied. Newman clustering emphasizes betweenness of an edge and identifies densely connected subgraphs. To the best of our knowledge, this is the first attempt to obtain word groups using web counts. Our contributions are summarized as follows:
Word clustering is important for automatic thesaurus construction, text classification, and word sense disambiguation. Recently, several studies have reported using the web as a corpus. This paper proposes an unsupervised algorithm for word clustering based on a word similarity measure by web counts. Each pair of words is queried to a search engine, which produces a co-occurrence matrix. By calculating the similarity of words, a word cooccurrence graph is obtained. A new kind of graph clustering algorithm called Newman clustering is applied for efficiently identifying word clusters. Evaluations are made on two sets of word groups derived from a web directory and WordNet.
1
Introduction
The web is a good source of linguistic information for several natural language techniques such as question answering, language modeling, and multilingual lexicon acquisition. Numerous studies have examined the use of the web as a corpus (Kilgarriff, 2003). Web-based models perform especially well against the sparse data problem: Statistical techniques perform poorly when the words are rarely used. For example, F. Keller et al. (2002) use the web to obtain frequencies for unseen bigrams in a given corpus. They count for adjective-noun, noun-noun, and verb-object bigrams by querying a search engine, and demonstrate that web frequencies (web counts) correlate with frequencies from a carefully edited corpus such as the British National Corpus (BNC). Aside from counting bi542
Proceedings of the 2006 Conference on Empirical Methods in Natural Language Processing (EMNLP 2006), pages 542–550, c Sydney, July 2006. 2006 Association for Computational Linguistics
• A new algorithm for word clustering is described. It has few parameters and thus is easy to implement as a baseline method.
(Terra and Clarke, 2003) provide a comparative investigation of co-occurrence frequency estimation on the performance of synonym tests. They report that PMI (with a certain window size) performs best on average. Also, PMI-IR is useful for calculating semantic orientation and rating reviews (Turney, 2002).
• We evaluate the algorithm on two sets of word groups derived from a web directory and WordNet. The chi-square measure and Newman clustering are both used in our algorithm, they are revealed to outperform PMI and hierarchical clustering.
As described, PMI is one of many measures to calculate the strength of word similarity or word association (Manning and Sch¨utze, 2002). An important assumption is that similarity between words is a consequence of word co-occurrence, or that the proximity of words in text is indicative of relationship between them, such as synonymy or antonymy. A commonly used technique to obtain word groups is distributional clustering (Baker and McCallum, 1998). Distributional clustering of words was first proposed by Pereira Tishby & Lee in (Pereira et al., 1993): They cluster nouns according to their conditional verb distributions.
We target Japanese words in this paper. The remainder of this paper is organized as follows: We overview the related studies in the next section. Our proposed algorithm is described in Section 3. Sections 4 and 5 explain evaluations and advance discussion. Finally, we conclude the paper.
2
Related Works
A number of studies have explained the use of the web for NLP tasks e.g., creating multilingual translation lexicons (Cheng et al., 2004), text classification (Huang et al., 2004), and word sense disambiguation (Turney, 2004). M. Baroni and M. Ueyama summarize three approaches to use the web as a corpus (Baroni and Ueyama, 2005): using web counts as frequency estimates, building corpora through search engine queries, and crawling the web for linguistic purposes. Commercial search engines are optimized for ordinary users. Therefore, it is desirable to crawl the web and to develop specific search engines for NLP applications (Cafarella and Etzioni, 2005). However, considering that great efforts are taken in commercial search engines to maintain quality of crawling and indexing, especially against spammers, it is still important to pursue the possibility of using the current search engines for NLP applications. P. Turney (Turney, 2001) presents an unsupervised learning algorithm for recognizing synonyms by querying a web search engine. The task of recognizing synonyms is, given a target word and a set of alternative words, to choose the word that is most similar in meaning to the target word. The algorithm uses pointwise mutual information (PMI-IR) to measure the similarity of pairs of words. It is evaluated using 80 synonym test questions from the Test of English as a Foreign Language (TOEFL) and 50 from the English as a Second Language test (ESL). The algorithm obtains a score of 74%, contrasted to that of 64% by Latent Semantic Analysis (LSA). Terra and Clarke
Graphic representations for word similarity have also been advanced by several researchers. Kageura et al. (2000) propose automatic thesaurus generation based on a graphic representation. By applying a minimum edge cut, the corresponding English terms and Japanese terms are identified as a cluster. Widdows and Dorow (2002) use a graph model for unsupervised lexical acquisition. A graph is produced by linking pairs of words which participate in particular syntactic relationships. An incremental cluster-building algorithm achieves 82% accuracy at a lexical acquisition task, evaluated against WordNet classes. Another study builds a co-occurrence graph of terms and decomposes it to identify relevant terms by duplicating nodes and edges (Tanaka-Ishii and Iwasaki, 1996). It focuses on transitivity: if transitivity does not hold between three nodes (e.g., if edge a-b and b-c exist but edge a-c does not), the nodes should be in separate clusters. A network of words (or named entities) on the web is investigated also in the context of the Semantic Web (Cimiano et al., 2004; Bekkerman and McCallum, 2005). Especially, a social network of persons is mined from the web using a search engine (Kautz et al., 1997; Mika, 2005; Matsuo et al., 2006). In these studies, the Jaccard coefficient is often used to measure the co-occurrence of entities. We compare Jaccard coefficients in our evaluations. In the research field on complex networks, 543
printer 17000000
Table 1: Web counts for each word.
print 103000000
InterLaser 215
ink 18900000
TV 69100000
Aquos 1760000000
Sharp 2410000
186000000
Table 2: Co-occurrence matrix by web counts. printer print InterLaser ink TV Aquos Sharp
printer — 4780000 179 4720000 4530000 201000 990000
print 4780000 — 183 4800000 8390000 86400 1390000
InterLaser 179 183 — 116 65 0 0
ink 4720000 4800000 116 — 10600000 144000 656000
Aquos 201000 86400 0 144000 1660000 — 1790000
Sharp 990000 1390000 0 656000 42300000 1790000 —
tion between word w1 and w2 as
structures of various networks are investigated in detail. For example, Motter (2002) targeted a conceptual network from a thesaurus and demonstrated its small-world structure. Recently, numerous works have identified communities (or densely-connected subgraphs) from large networks (Newman, 2004; Girvan and Newman, 2002; Palla et al., 2005) as explained in the next section.
3
TV 4530000 8390000 65 10600000 — 1660000 42300000
P M I(w1 , w2 ) = log2
p(w1 , w2 ) . p(w1 )p(w2 )
Probability p(w1 ) is estimated by fw1 /N , where fw1 represents the web count of w1 and N represents the number of documents on the web. Probability of co-occurrence p(w1 , w2 ) is estimated by fw1 ,w2 /N where fw1 ,w2 represents the web count of w1 AND w2 . The PMI values are shown in Table 3. We set N = 1010 according to the number of indexed pages on Google. Some values are inconsistent with our intuition: Aquos is inferred to have high PMI to TV and Sharp, but also to printer. None of the words has high PMI with TV. These are because the range of the word count is broad. Generally, mutual information tends to provide a large value if either word is much rarer than the other. Various statistical measures based on cooccurrence analysis have been proposed for estimating term association: the DICE coefficient, Jaccard coefficient, chi-square test, and the loglikelihood ratio (Manning and Sch¨utze, 2002). In our algorithm, we use the chi-square (χ2 ) value instead of PMI. The chi-square value is calculated as follows: We denote the number of pages containing both w1 and w2 as a. We also denote b, c, d as follows4 .
Word Clustering using Web Counts
3.1 Co-occurrence by a Search Engine A typical word clustering task is described as follows: given a set of words (nouns), cluster words into groups so that the similar words are in the same cluster 1 . Let us take an example. Assume a set of words is given: プリンタ (printer), 印刷 (print), インターレーザー (InterLaser), イ ンク (ink), TV (TV), Aquos (Aquos), and Sharp (Sharp). Apparently, the first four words are related to a printer, and the last three words are related to a TV 2 . In this case, we would like to have two word groups: the first four and the last three. We query a search engine3 to obtain word counts. Table 1 shows web counts for each word. Table 2 shows the web counts for pairs of words. For example, we submit a query printer AND InterLaser to a search engine, and are directed to 179 documents. Thereby, n C2 queries are necessary to obtain the matrix if we have n words. We call Table 2 a co-occurrence matrix. We can calculate the pointwise mutual informa-
w1 ¬w1
w2 a c
¬w2 b d
Thereby, the expected frequency of (w1 , w2 ) is (a + c)(a + b)/N . Eventually, chi-square is calculated as follows (Manning and Sch¨utze, 2002).
1
In this paper, we limit our scope to clustering nouns. We discuss the extension in Section 4. 2 InterLaser is a laser printer made by Epson Corp. Aquos is a liquid crystal TV made by Sharp Corp. 3 Google (www.google.co.jp) is used in our study.
4
544
Note that N = a + b + c + d.
Table 3: A matrix of pointwise mutual information. printer — 4.771 8.936 7.199 0.598 5.616 1.647
printer print InterLaser ink TV Aquos Sharp
print 4.771 — 6.369 4.624 -1.111 1.799 -0.463
InterLaser 8.936 6.369 — 8.157 0.781 −∞*. −∞*
ink 7.199 4.624 8.157 — 1.672 4.983 0.900
TV 0.598 -1.111 0.781 1.672 — 1.969 0.370
Aquos 5.616 1.799 −∞* 4.983 1.969 — 5.319
Sharp 1.647 -0.463 −∞* 0.900 0.370 5.319 —
* represents that the PMI is not available because the co-occurrence web count is zero, in which case we set −∞.
Table 4: A matrix of chi-square values. printer print InterLaser ink TV Aquos Sharp
printer — 6880482.6 399.2 5689710.7 0.0* 0.0* 0.0*
print 6880482.6 — 277.8 3321184.6 176855.5 0.0* 0.0*
InterLaser 399.2 277.8 — 44.8 0.0* 0.0 0.0
ink 5689710.7 3321184.6 44.8 — 1419485.5 0.0* 0.0*
TV 0.0* 176855.5 0.0* 1419485.5 — 26803.2 70790877.6
Aquos 0.0* 0.0* 0.0 0.0* 26803.2 — 729357.7
Sharp 0.0* 0.0* 0.0 0.0* 70790877.6 729357.7 —
* represents that the observed co-occurrence frequency is below the expected value, in which case we set 0.0.
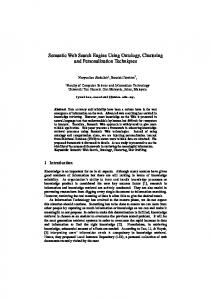
We should note that χ2W depends on a word set W . It calculates the relative strength of cooccurrences. Table 4 shows the χ2W values. Aquos has high values only with TV and Sharp as expected. 3.2 Clustering on Co-occurrence Graph Figure 1: Examples of Newman clustering.
χ2 (w1 , w2 ) =
N × (a × d − b × c)2 (a + b) × (a + c) × (b + d) × (c + d)
However, N is a huge number on the web and sometimes it is difficult to know exactly. Therefore we regard the co-occurrence matrix as a contingency table: ∑
b0 =
fw1 ,w ,
w∈W ;w6=w2
d0 =
∑
∑
c0 =
fw2 ,w ;
w∈W ;w6=w1
fw,w0 ,
w,w0 ∈W ;w and w0 6=w1 nor w2
N0 =
∑
fw,w0 ,
w,w0 ∈W
where W represents a given set of words. Then chi-square (within the word list W ) is defined as χ2W (w1 , w2 ) =
N 0 × (a × d0 − b0 × c0 )2 . (a + b0 ) × (a + c0 ) × (b0 + d0 ) × (c0 + d0 )
545
Recently, a series of effective graph clustering methods has been advanced. Pioneering work that specifically emphasizes edge betweenness was done by Girvan and Newman (2002): we call the method as GN algorithm. Betweenness of an edge is the number of shortest paths between pairs of nodes that run along it. Figure 1 (i) shows that two “communities” (in Girvan’s term), i.e. {a,b,c} and {d,e,f,g}, which are connected by edge c-d. Edge c-d has high betweenness because numerous shortest paths (e.g., from a to d, from b to e, . . .) traverse the edge. The graph is likely to be separated into densely connected subgraphs if we cut the high betweenness edge. The GN algorithm is different from the minimum edge cut. For (i), the results are identical: By cutting edge c-d, which is a minimum edge cut, we can obtain two clusters. However in case of (ii), there are two candidates for the minimum edge cut, whereas the highest betweenness edge is still only edge c-d. Girvan et al. (2002) shows that this clustering works well to various networks from biological to social networks. Numerous studies have been inspired by that work. One prominent effort is a faster variant of GN algorithm (Newman, 2004), which we call Newman clustering in
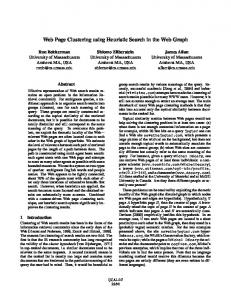
Figure 3: A word graph for 88 Japanese words. ticular division gives no more within-community edges than would be expected by random chance, then we would obtain Q = 0. In practice, values greater than about 0.3 appear to indicate significant group structure (Newman, 2004). Newman clustering is agglomerative (although we can intuitively understand that a graph without high betweenness edges is ultimately obtained). We repeatedly join clusters together in pairs, choosing at each step the joint that provides the greatest increase in Q. Currently, Newman clustering is one of the most efficient methods for graph-based clustering. The illustration of our algorithm is shown in Fig. 2. First, we obtain web counts among a given set of words using a search engine. Then PMI or the chi-square values are calculated. If the value is above a certain threshold6 , we invent an edge between the two nodes. Then, we apply graph clustering and finally identify groups of words. This illustration shows that the chi-square measure yields the correct clusters. The algorithm is described in Fig. 4. The parameters are few: a threshold dthre for a graph and, optionally, the number of clusters nc . This enables easy implementation of the algorithm. Figure 3 is a small network of 88 Japanese words obtained through 3828 search queries. We can see that some parts in the graph are densely connected.
Figure 2: An illustration of graph-based word clustering. this paper. In Newman clustering, instead of explicitly calculating high-betweenness edges (which is computationally demanding), an objective function is defined as follows: Q=
∑ i
( eii −
( ∑
)2 ) eij
(1)
j
We assume that we have separate clusters, and that eij is the fraction5 of edges in the network that connect nodes in cluster i to those in cluster j. The term eii denotes the fraction of edges within ∑ the clusters. The term j eij represents the expected fraction of edges within the cluster. If a par-
4
Experimental Results
This section addresses evaluation. Two sets of word groups are used for the evaluation: one is derived from documents on a web directory; another is from WordNet. We first evaluate the co-
5 We can calculate eij using the number of edges between cluster i and j divided by the number of all edges.
6
546
In this example, 4.0 for PMI and 200 for χ2 .
¶ ³
1. Input A set of words is given. The number of words is denoted as n.
³ 1. For each category, crawl 1000 documents randomlya 2. Apply the Japanese morphological analysis system ChaSen (Matsumoto et al., 2000) to the documents. Calculate the score of each word w in category c similarly to TF-IDF:
2. Obtain frequencies Put a query for each pair of words to a search engine, and obtain a cooccurrence matrix. Then calculate the chi-square matrix (alternatively a PMI matrix, or a Jaccard matrix.)
score(w, c) = fc (w) × log(Nall /fall (w))
3. Make a graph Set a node for each word, and an edge to a pair of nodes whose χ2 value is above a threshold. The threshold is determined so that the network density (the number of edges divided by n C2 ) is dthre .
where fc denotes the document frequency of word w in category c, Nall denotes the number of all documents, and fall (w) denotes the frequency of word w in all documents. 3. For each category, the top 10 words are selected as the word group.
4. Apply Newman clustering Initially set each node as a cluster. Then merge two clusters repeatedly so that Q is maximized. Terminate if Q does not increase anymore, or when a given number of clusters nc is obtained. (Alternatively, apply average-link hierarchical clustering.) 5. Output Output groups of words.
µ
a
We first get all urls, sort them, and select a sample randomly.
µ
´
Figure 5: Procedure for obtaining word groups for ´a category.
Figure 4: Our algorithm for word clustering. Table 7: Precision for DMOZ-J set. PMI Jaccard χ2 Mean 0.415 0.402 0.537 Min 0.396 0.376 0.493 Max 0.447 0.424 0.569 SD 0.020 0.020 0.032
occurrence measures, then we evaluate the clustering methods. 4.1 Word Groups from an Open Directory We collected documents from the Japanese Open Directory (dmoz.org/World/Japanese). The dmoz japanese category contains about 130,000 documents and more than 10,000 classes. We chose 9 categories out of the top 12 categories: art, sports, computer, game, society, family, science, and health. We crawled 1000 documents for each category, i.e., 9000 documents in all. For each category, a word group is obtained through the procedure in Fig. 5. We consider that the specific words to a category are relevant to some extent, and that they can therefore be regarded as a word group. Examples are shown in Table 5. In all, 90 word sets are obtained and merged. We call the word set DMOZ-J data. Our task is, given 90 words, to cluster the words into the correct nine groups. Here we investigate whether the correct nine words are selected for each word using the co-occurrence measure. We compare pointwise mutual information (PMI), the Jaccard coefficient (Jaccard), and chi-square (χ2 ). We chose these methods for comparison because PMI performs best in (Terra and Clarke, 2003). The Jaccard coefficient is often used in social network mining from the web. Table 7 shows the precision of each method. Experiments are repeated five times. We keep each method that outputs the
highest nine words for each word, groups of ten words. Therefore, recall is the same as the precision. From the table, the chi-square performs best. PMI is slightly better than the Jaccard coefficient. 4.2 Word Groups from WordNet Next, we make a comparison using WordNet 7 . By extracting 10 words that have the same hypernym (i.e. coordinates), we produce a word group. Examples are shown in Table 6. Nine word groups are merged into one, as with DMOZ-J. The experiments are repeated 10 times. Table 8 shows the result. Again, the chi-square performs best among the methods that were compared. Detailed analyses of the results revealed that word groups such as bacteria and diseases are clustered correctly. However, word groups such as computers (in which homepage, server and client are included) are not well clustered: these words tend to be polysemic, which causes difficulty. 4.3 Evaluation of Clustering We compare two clustering methods: Newman clustering and average-link agglomerative cluster7
547
We use a partly-translated version of WordNet.
Table 5: Examples of word groups from DMOZ-J. category アート (art) レクリエーション (recreation) 健康 (health)
specific words to a category as a word group 画廊 (gallery), 作品 (artwork), 劇場 (theater), サックス (saxophone), 短歌 (verse), ライブ (live concert), ギター (guitar), 披露 (performance), バレエ (ballet), 個展 (personal exhibition) 飼育 (raising), ヒナ (poult), ハムスター (hamster), 旅日記 (travel diary), 国立公園 (national park), 酒造 (brewing), 競艇 (boat race), 競争 (competition), 釣り堀 (fishing pond) 疾患 (illness), 患者 (patient), 筋炎 (myositis), 外科 (surgery), 透析 (dialysis), ステロイド (steroid), 検 査 (test), 病棟 (medical ward), 膠原病 (collagen disease), 外来 (clinic)
Table 6: Examples of word groups from WordNet. hypernym 宝石 (gem) 学問 (academic field) 飲み物 (drink)
hyponyms as a word group アメジスト (amethyst), アクアマリン (aquamarine), ダイアモンド (diamond), エメラルド (emerald), ムーンストーン (moonstone), ペリドット (peridot), ルビー (ruby), サファイア (sapphire), トパーズ (topaz), トルマリン (tourmaline) 自然科学 (natural science), 数学 (mathematics), 農学 (agronomics), 建築学 (architectonics), 地質 学 (geology), 心理学 (psychology), 情報工学 (computer science), 認知科学 (cognitive science), 社 会学 (sociology), 言語学 (linguistics) 牛乳 (milk), アルコール (alcohol), 清涼飲料 (cooling beverage), 炭酸飲料 (carbonated beverage), サイダー (soda), ココア (cocoa), フルーツジュース (fruit juice), コーヒー (coffee), お茶 (tea), ミ ネラルウォーター (mineral water)
and Clarke, 2003) document-wide co-occurrences perform comparable to other Windows-based cooccurrences.
Table 8: Precision of WordNet set. PMI Jaccard χ2 Mean 0.549 0.484 0.584 Min 0.473 0.415 0.498 Max 0.593 0.503 0.656 SD 0.037 0.027 0.048
Many types of co-occurrence exist other than noun-noun. We limit our scope to noun-noun co-occurrences in this paper. Other types of cooccurrence such as verb-noun can be investigated in future studies. Also, co-occurrence for the second-order similarity can be sought. Because web documents are sometimes difficult to analyze, we keep our algorithm as simple as possible. Analyzing semantic relations and applying distributional clustering is another goal for future work.
Table 9: Precision, recall and the F-measure for each clustering. Average -link Newman
precision recall F-measure precision recall F-measure
PMI 0.633 0.102 0.179 0.751 0.103 0.182
Jaccard 0.603 0.101 0.173 0.739 0.103 0.181
χ2 0.486 0.100 0.164 0.546 0.431 0.480
A salient weak point of our algorithm is the number of necessary queries allowed to a search engine. For obtaining a graph of n words, O(n2 ) queries are required, which discourages us from undertaking large experiments. However some devices are possible: if we analyze the texts of the top retrieved pages by query w, we can guess what words are likely to co-occur with w. This preprocessing seems promising at least in social network extraction: we can eliminate 85% of queries in the 500 nodes case while retaining more than 90% precision (Asada et al., 2005).
ing, which is often used in word clustering. A word co-occurrence graph is created using PMI, Jaccard, and chi-square measures. The threshold is determined so that the network density dthre is 0.3. Then, we apply clustering to obtain nine clusters; nc = 9. Finally, we compare the resultant clusters with the correct categories. Clustering results for DMOZ-J sets are shown in Table 9. Newman clustering produces higher precision and recall. Especially, the combination of chi-square and Newman is the best in our experiments.
5
In our evaluation, the chi-square measure performed well. One reason is that the PMI performs worse when a word group contains rare or frequent words, as is generally known for mutual information measure (Manning and Sch¨utze, 2002). Another reason is that if we put one word and two words to a search engine, the result might be inconsistent. In an extreme case, the web count of w1 is below the web count of w1 AN Dw2 . This
Discussion
In this paper, the scope of co-occurrence is document-wide. One reason is that major commercial search engines do not support a type of query w1 NEAR w2 . Another reason is in (Terra 548
phenomenon depends on how a search engine processes AND operator, and results in unstable values for the PMI. On the other hand, our method by the chi-square uses a co-occurrence matrix as a contingency table. For that reason, it suffers less from the problem. Other statistical measures such as the likelihood ratio are also applicable.
6
I. Dhillon, S. Mallela, and R. Kumar. 2002. Enhanced word clustering for hierarchical text classification. In Proc. KDD-2002, pages 191–200. Michelle Girvan and M. E. J. Newman. 2002. Community structure in social and biological networks. Proceedings of National Academy of Sciences USA, 99:8271–8276. C. Huang, S. Chuang, and L. Chien. 2004. Categorizing unknown text segments for information extraction using a search result mining approach. In Proc. IJCNLP 2004, pages 576–586.
Conclusion
This paper describes a new approach for word clustering using a search engine. The chi-square measure is used to overcome the broad range of word counts for a given set of words. We also apply recently-developed Newman clustering, which yields promising results through our evaluations. Our algorithm has few parameters. Therefore, it can be used easily as a baseline, as suggested by (Lapata and Keller, 2004). New words are generated day by day on the web. We believe that to automatically identify new words and obtain word groups potentially enhances many NLP applications.
K. Kageura, K. Tsuji, and A. Aizawa. 2000. Automatic thesaurus generation through multiple filtering. In Proc. COLING 2000. H. Kautz, B. Selman, and M. Shah. 1997. The hidden Web. AI magazine, 18(2):27–35. F. Keller, M. Lapata, and O. Ourioupina. 2002. Using the web to overcome data sparseness. In EMNLP02, pages 230–237. A. Kilgarriff. 2003. Introduction to the special issue on the web as corpus. Computer Linguistics, 29(3).
References
M. Lapata and F. Keller. 2004. The web as a baseline: Evaluating the performance of unsupervised web-based models for a range of nlp tasks. In Proc. HLT-NAACL 2004, pages 121–128.
Yohei Asada, Yutaka Matsuo, and Mitsuru Ishizuka. 2005. Increasing scalability of researcher network extraction from the web. Journal of Japanese Society for Artificial Intelligence, 20(6).
H. Li and N. Abe. 1998. Word clustering and disambiguation based on co-occurrence data. In Proc. COLING-ACL98. C. D. Manning and H. Sch¨utze. 2002. Foundations of statistical natural language processing. The MIT Press, London.
D. Baker and A. McCallum. 1998. Distributional clustering of words for text classification. In Proc. SIGIR-98.
Y. Matsumoto, A. Kitauchi, T. Yamashita, Y. Hirano, H. Matsuda, K. Takaoka, and M. Asahara. 2000. Morphological analysis system ChaSen version 2.2.1 manual. Technical report, NIST.
M. Baroni and M. Ueyama. 2005. Building generaland special-purpose corpora by web crawling. In Proc. NIJL International Workshop on Language Corpora.
Y. Matsuo, J. Mori, M. Hamasaki, H. Takeda, T. Nishimura, K. Hasida, and M. Ishizuka. 2006. POLYPHONET: An advanced social network extraction system. In Proc. WWW 2006.
R. Bekkerman and A. McCallum. 2005. Disambiguating web appearances of people in a social network. In Proc. WWW 2005. M. Cafarella and O. Etzioni. 2005. A search engine for natural language applications. In Proc. WWW2005.
P. Mika. 2005. Flink: Semantic web technology for the extraction and analysis of social networks. Journal of Web Semantics, 3(2).
P. Cheng, W. Lu, J. Teng, and L. Chien. 2004. Creating multilingual translation lexicons with regional variations using web corpora. In Proc. ACL 2004, pages 534–541.
K. Miura, Y. Tsuruoka, and J. Tsujii. 2004. Automatic acquisition of concept relations from web documents with sense clustering. In Proc. IJCNLP04.
P. Cimiano, S. Handschuh, and S. Staab. 2004. Towards the self-annotating web. In Proc. WWW2004, pages 462–471.
A. Motter, A. de Moura, Y. Lai, and P. Dasgupta. 2002. Topology of the conceptual network of language. Physical Review E, 65.
J. Curran. 2002. Ensemble methods for automatic thesaurus extraction. In Proc. EMNLP 2002.
M. Newman. 2004. Fast algorithm for detecting community structure in networks. Phys. Rev. E, 69.
549
G. Palla, I. Derenyi, I. Farkas, and T. Vicsek. 2005. Uncovering the overlapping community structure of complex networks in nature and society. Nature, 435:814. F. Pereira, N. Tishby, and L. Lee. 1993. Distributional clustering of English words. In Proc. ACL93, pages 183–190. K. Tanaka-Ishii and H. Iwasaki. 1996. Clustering cooccurrence graph using transitivity. In Proc. 16th International Conference on Computational Linguistics, pages 680–585. E. Terra and C. Clarke. 2003. Frequency estimates for statistical word similarity measures. In Proc. HLT/NAACL 2003. P. Turney. 2001. Mining the web for synonyms: PMIIR versus LSA on TOEFL. In Proc. ECML-2001, pages 491–502. P. Turney. 2002. Thumbs up or thumbs down? semantic orientation applied to unsupervised classification of reviews. In Proc. ACL’02, pages 417–424. P. Turney. 2004. Word sense disambiguation by web mining for word co-occurrence probabilities. In Proc. SENSEVAL-3. D. Widdows and B. Dorow. 2002. A graph model for unsupervised lexical acquisition. In Proc. COLING 2002.
550