Noname manuscript No. (will be inserted by the editor)
Graph Transformation Tool Contest 2008 Arend Rensink · Pieter Van Gorp
the date of receipt and acceptance should be inserted later
Abstract This special section is the outcome of the graph transformation tool contest organised during the GraphBased Tools (GraBaTs) 2008 workshop, which took place as a satellite event of the International Conference on Graph Transformation (ICGT) 2008. The contest involved two parts: three “off-line case studies” which were published before the contest, and to which solutions were submitted and reviewed; and a “live contest” for which the case description was only handed out during the event, and to which solutions had to be constructed during a single afternoon session. Here we briefly sketch the off-line cases, and the setup and topic of the live contest in somewhat more detail. We also evaluate the results of the workshop, and give some recommendations for future editions. Finally, we introduce the research papers appearing in this special section.
1 Background Graph transformation started out in the beginning of the 1970s as graph grammars, a theoretical investigation into the extension of formal language theory from string languages to graph languages. Software tool development to support the formalism started twenty years later, in the course of the 1990s, with PROGRES [17] and AGG [4]. It was only with the help of tools that the graphs came to life, which greatly helped to spread the popularity of graph transformation as a modelling paradigm. At the moment there are A. Rensink University of Twente, Department of Computer Science, P.O. Box 217, 7500 AE Enschede, The Netherlands; E-mail:
[email protected] P. Van Gorp Eindhoven University of Technology, School of Industrial Engineering, P.O. Box 513, 5600 MB Eindhoven, The Netherlands; E-mail:
[email protected]
around a dozen ongoing tool development efforts that fall under the broad header “graph transformation tools”.
Tool contest. To stimulate the development of graph transformation tools, in 2007 we organised a first graph transformation tool contest [16]. This involved the comparison of tools on the basis of three different, predefined case studies to which solutions could be submitted. The case studies were selected to cover different aspects of graph transformation: Prototyping. One of the advantages of graph transformation is the general and easy-to-grasp nature of the underlying graph formalism, and the straightforward way in which graph changes can be encoded using transformation rules. This means that concepts from many different domains can be easily captured, and a prototype model describing a given system is rapidly developed. Performance. The price to pay for the generality that makes graph transformation widely applicable is the cost of manipulating graphs, including storage, editing and rule application. In particular, the latter involves graph matching, which is an NP-hard problem. In applications where graphs are large or the number of transformation steps is large, it is therefore of supreme importance to optimise tool performance. Model transformation. An area in which graph transformation has especially taken off is as an underlying engine for model transformation, which in turn is one of the important concepts in modern software engineering paradigms based on model-driven development. To be well suited for model transformation, a tool has (among other things) to be flexible and user-friendly, and to be able to interface with other tools providing the actual models.
2
This division was deemed successful, as was the concept of a tool contest itself. Among the improvements suggested in [16] were: – Explicitly identify challenges and introduce criteria for ranking; – Organise the contest as a stand-alone workshop; – Maintain less tight deadlines; – Consider different categories of cases; e.g., verification. Most of these recommendations were followed up in the 2008 transformation tool contest, organised as a separate satellite event of ICGT 2008 (see [15]). Furthermore, as a major innovation we also included a live contest. This involved a case description that was handed out at the event, and for which participants were asked to create a solution, using the tool of their choice, during a single afternoon session. Concretely, the cases were: Program refactoring: a challenge to model existing refactoring transformations. This case study is extensively described in the separate paper [14]. AntWorld simulation: a prototyping case with strong performance aspects, briefly described in Section 2 below. BPMN-to-BPEL transformation: a larger, realistic model transformation case, based on [13]. Unfortunately, this case received no submissions; it was eventually used for the next instance of the tool contest (see Section 4). Conference scheduling: the live contest case, described in Section 3 below. Special section. All workshop participants were asked to improve their solution to the offline cases and/or the live challenge, and submit the result to this STTT special section. Each of the contributions to this section therefore takes the perspective of a particular tool, describing how it was used to solve one or more of the cases and what lessons have been learned from this effort. This has resulted in the following papers: – Model Refactoring using MoTMoT [12], describing a solution of the program refactoring case. The paper shows that the required features of the case were all implemented successfully, and some optional features were implemented partially. It also discusses strengths and weaknesses of MoTMoT in the context of the case study. – Experimental Assessment of Combining Pattern Matching Strategies with VIATRA2 [7], analyzing the pattern matching strategies available in the tool VIATRA2 on the basis of the AntWorld simulation case. The paper contains an in-depth analysis of the complexity issues of the AntWorld case and shows how the various pattern matching optimizations available in the tool improve its performance. – Manual and Automated Performance Optimization of Model Transformation Systems [10], analyzing several
–
–
–
–
optimization techniques for the tool VMTS on the basis of the AntWorld simulation case. The paper compares manual optimizations (exploiting knowledge about the algorithms implemented in VMTS) with automatic optimizations (exploiting similarities between rules) for the matching phase of graph transformation, and shows that the latter comes close to the speedup achieved by the former. Introduction to AGG and EMF Tiger by Modeling a Conference Scheduling System [1], describing solutions of the conference scheduling case in AGG (a general purpose graph transformation tool directly based on algebraic concepts) and EMF Tiger (a modeling and code generation framework for Eclipse applications). This results in a good insight in the relative strengths and weaknesses of both tools. GrGen.NET: The Expressive, Convenient and Fast Graph Rewrite System [9], describing solutions to the program refactoring, AntWorld and conference scheduling cases. All cases were solved, and the performance of the transformations is very good. The paper also discusses the design choices of the GrGen.NET tool in some depth. Evaluation of Kermeta for Solving Graph-based Problems [11], describing solutions to the program refactoring, AntWorld and conference scheduling cases. For each of these cases, the paper provides a comparison to the solutions submitted for other tools, on the basis of criteria such as genericity, extensibility and performance. This is especially interesteing because the approach taken in Kermeta is to translate the graph-based concepts to Alloy and use SAT-solving to evaluate the transformations. Fujaba Case Studies for GraBaTs 2008: Lessons learned [5], also describing solutions to the program refactoring, AntWorld and conference scheduling cases. Besides giving a good impression of the capabilities of Fujaba, the paper also discusses tool improvements based on the experience gained in carrying out the case studies.
In the remainder of this introductory article, we give a sketch of the AntWorld case (Section 2) and a more comprehensive description of the live challenge (Section 3). We end with an evaluation of the workshop itself (including the outcome of the contest) and some further recommendations (Section 4). 2 The AntWorld case The following description is copied (with some minor changes) from http://www.se.eecs.uni-kassel.de/∼fujabawiki/ index.php/AntWorld; thanks to Albert Z¨undorf for generously allowing to include the text here.
3
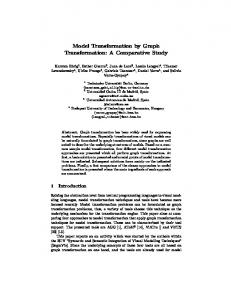
The AntWorld simulation consists of an ant hill sitting in the middle of a large area. The ants are moving around searching for food. If an Ant finds food, it brings the food home to its ant hill in order to grow new ants. On its way home, the ant drops pheromones marking the path to the food reservoir. If an Ant without food leaves the hill or if a searching ant hits a pheromone mark, the ant follows the pheromone path to the food. This behavior already results in the well known ant trails. The area grid. Since this is a case study for graph transformation tools, the area in which the ants move shall be modelled by a grid of nodes. In order to enable the ants to go home on a straight path, if they have found some food, the area grid shall look like a spider’s web, cf. Figure 1. In the center of the grid there is the ant hill. The first circle around the ant hill consists of 4 ‘exit’ fields. In the second circle, each exit field has three child fields. In the next circle, the 4 fields on the main axis have three child fields while the normal fields have just one child field. This scheme creates a quite regular grid where each field has a quite straight path to the hill in the center of the grid. In Figure 1, the ants have not yet found any food; consequently none of the fields have associated pheromes. Ant moves. The AntWorld simulation works in rounds. Within each round, each ant does one move. The ant behavior depends on the following modes: – If the ant has no food and is on a field with food, it takes one piece of food and enters the food carrying mode. It may still move within the current round. – If the ant carries some food, it follows the links towards the ‘inner’ circle. Thus, the ant moves towards the ant hill by one circle. During its way home, on each visited grid node (including the ‘food’ node), the ant drops 1024 parts of pheromones. This guides other ants to the food place. Note that, if an ant drops new pheromones on an already marked grid node, this new pheromone parts are added to the already existing parts. – If an ant with food is on the hill node, it drops the food and enters the search mode. It may leave the hill within the same round. – An ant without food is in search mode. In search mode, the ant checks the neighbour node(s) of the next outer circle for pheromones. If there are neighbour nodes on the next outer circle with more than 9 parts of pheromones, the ant chooses one of these fields, randomly. The random choice shall be fair based on usual mechanisms for random choices, e.g. Java class Random may be used. – If the ant is in search mode and no outer neighbour has sufficient pheromones, the ant moves to any of its neigh-
bour fields based on a fair random choice. (However, an ant without food shall not enter the ant hill.) General area management. – Initially, the area grid shall consist only of the hill and the first two circles. In addition, the hill shall contain 8 ants. No food is initially provide on the grid. – Whenever during one round an ant enters the currently outmost circle (i.e. the border of the yet known area), a new circle of nodes shall be created. During the creation of this next circle, every 10th node shall carry 100 parts of food. If a circle has e.g. 28 nodes, node 10 and node 20 of that circle shall have food. Thus, this circle would need just 2 more nodes to create a third food place. Therefore, these 8 nodes are kept in mind and during the creation of the next circle (in our example with 36 nodes) we add another food place when 2 more nodes have been added. Thus, accross circles, every 10th node becomes a food place. Note that, according to this schema, we create 10 parts of food per one grid node. Since each food part may result in one ant, one might expect quite a lot of ants in this simulation. However, in our test runs, we observed an average of 1 ant per 5 fields (on the long run). It seems, that due to the random search strategy, even this large number of ants have difficulties to find food far away from the hill. – After each round, the pheromones shall evaporate. This is needed in order to erase an old ant trail once the food has drained. Thus, after each round, on each grid node, the number of pheromones shall be multiplied by 0.95. In case of a fraction, the number shall be rounded to the next smaller natural number. Using the factor 0.95 and 1024 start pheromones per drop, the number of pheromones on a grid node drops below 10 within roughly 100 rounds. Thus, a single ant may be able to travel about 50 steps home to its hill, drop the food and travel about 50 steps out following its own pheromone path back to the food place. Food places with a distance of more than 50 circles need the collaboration of multiple ants that pick up the ant trail and refresh it, continuously. – After each round, the hill shall consume the food brought to it and it shall create one new ant per delivered food part. These new ant spread out in the next round. Implementation remarks. – Grid nodes, ants and the hill shall be modeled as explicit graph nodes. Ant positions on grid nodes shall be modelled using a link. Multiple ants are allowed on the same grid node.
4 Field pheromones = 0 next
next Field pheromones = 0
next Field pheromones = 0 next Field pheromones = 0 next
out out
Field pheromones = 0
Field pheromones = 0 out
Exit Field pheromones = 0 out
Field pheromones = 0 out
next
Field pheromones = 0 at Food pieces = 10
Ant
out
out
next
out
next
at
out
out
out
Field pheromones = 0
out
next
out
next
out at
out
at
Field pheromones = 0 next
out out
Field pheromones = 0
Ant
Field pheromones = 0
at
next Ant
Field pheromones = 0 next
out
Ant out
next
out
Field pheromones = 0
Field pheromones = 0
Field pheromones = 0 next
at
Exit Field pheromones = 0
next
next
out
Field pheromones = 0
Exit Ant Field pheromones = 0 out out
Field pheromones = 0
next
next
Field Hill food = 0 pheromones = 0
at
Field pheromones = 0
at
Ant
next Ant
out
next
out
out
next
Field pheromones = 0 next
out Exit Field pheromones = 0
Food pieces = 10
next
Field pheromones = 0
out
Field pheromones = 0 out next
next
out
next
next
out
out
Field pheromones = 0
Field pheromones = 0
Field pheromones = 0 next
next
out
out
next
Field pheromones = 0
Field pheromones = 0
out
Ant
out
at
next
Field pheromones = 0 next
Field pheromones = 0 next
Field pheromones = 0
at
next
Field pheromones = 0 next
Field pheromones = 0
Fig. 1 Example of an ant heap
– The number of food parts and pheromones on a grid node or in the hill may be modeled as an integer attribute. Note that there are ten times as many food parts as grid nodes, and quite a lot of pheromone parts. Modeling these parts as explicit objects would result in a benchmark measuring mainly the creation and deletion of food (and pheromone) objects which is not our intention. This benchmark is designed to measure the execution of rules with local search. Goals – Each tool shall model and run the AntWorld according to above rules. – We would like to see some nice animations showing the ants and how they search for food and form ant trails. – For performance measurement, the simulation may run without a GUI. The results shall be illustrated by a table and or diagram showing for reasonable numbers of rounds the number of circles of the grid, the number of nodes of the grid (4 × #circles 2 ), the number of food parts created, the number of ants created, and the total execution time. 3 Live case This part is structured as follows: section 3.1 describes design considerations for the live contest case, section 3.2 describes the structure of the live contest, section 3.3 describes the domain of the case study and 3.4 discusses the concrete challenges for which participants have competed.
3.1 Design Considerations We designed the live contest to minimise a well-known threat to the validity of the contest results. More specifically, we designed the case study description to minimise the impact of individual participant characteristics. This resulted in the following decisions: Provide Reference Metamodels By providing metamodels from a reference solution, the case description levels out differences in the analytical skills of the participants. Allow Variations on that Reference Since any reference approach can in fact be against a particular transformation approach, we decided to allow small variations to the reference metamodel. This decreases the likeliness that the success or failure of a transformation language and/or tool is due to detailed restrictions of the reference metamodels.
3.2 Structure Organisationally, the following goals were taken into account: Enable Diversification The case description was designed as a set of loosely coupled tasks. Participants should be able to tackle those tasks for which their tool was most suitable while ignoring other tasks. A small drawback is that a detailed face-to-face comparison is not possible between all solutions. However, the results of the contest can be interpreted more easily by outsiders: a team that
5
chooses to solve a task and manages to beat other teams with that, clearly shows in what case the underlying tool is better than the competition. Mandatory Base Challenge The case description was divided in two parts: the core was shown at the start of the contest. Only after a participant had finished this part (or when giving up that part), the organisers explained the set of optional challenges to that participant. This ensured that the tools could at least be compared directly in terms of some common criteria. Start from Optimal Setup Participants were informed in advance that they should use their own laptops to enable them to work with an optimally configured operating system and tool configuration. This design choice makes it impossible to compare the participating teams on the tool installation process but makes it easier to compare the teams on other aspects. Similarly, the delivery of end-results was organised via a simple transfer of an archive file. Making the result reproducible on a new machine was outside the scope of the contest. Participants were asked to give a small demo as soon as they had completed a particular task. When satisfying all requirements, the organisers took note of the time that was spent so far. Participants could choose between a horizontal approach (trying to complete all tasks in a minimalistic manner as soon as possible) and a vertical approach (trying to complete one task in an excellent manner). Mind that while teams were conducting the live contest, another group of workshop participants was still discussing on a systematic way of assessing the results. In the meanwhile, we have learned that it is better to simply impose one ranking mechanism and explain that mechanism clearly before the start of the contest. 3.3 Domain of Case Study The case study for the live contest was entitled “Conference Scheduling”. Since all participants to the workshop attended academic conferences frequently, they should be naturally familiar to the problem domain. Therefore, no workshop participant should have lost time on getting familiar with domain terminology. In a plenary session, the contest organisers sketched the domain as follows: A conference consists of presentations presented by persons (the presenters). A presentation relates to exactly one paper and therefore the terms Presentation and Paper can be used almost interchangeably. Presentations are grouped in sessions. Sessions may run in parallel. Each session is chaired by a person (the session chair). One person may present one or more presentations and chair one or more sessions.
A session chair may present one or more presentations in the session he or she chairs. Based on the obvious constraint that no one can be at more than one place at a time, the following domain-specific constraints apply: 1. there are no simultaneous presentations given by the same presenter, 2. no presenter is chairing another session running simultaneously, 3. nobody chairs two sessions simultaneously. As a concrete example, the configuration shown on Figure 2 was used as a running example for the live contest. In this example, there are three sessions. Mind that “Gogolla” illustrates that a chair can present one or more presentations in the session he is chairing: Gogolla chairs session S1, in which he presents paper P1. “Van Gorp” chairs session S2 and presents paper P3 in session S1. “Schippers” presents a paper in each session of the hypothetical conference but does not chair any session. Conversely, “Hirschfeld” chairs a session but does not present a paper. Although not illustrated by this running example, a person can chair multiple sessions on one conference. Additionally, it may occur that the number of presentations varies between sessions of the same conference. After this explanation, a team of participants asked whether the names of the papers (P1 to P3) implied a particular order. The organisers clarified that there is no such order intended in the input graph. A conference organiser is only concerned about grouping related papers (i.e. the session concept) and has to figure out an ordering that physically enables people to show up for all their chairing and presentation duties.
3.4 Award Challenges 3.4.1 Core Challenge A conference schedule is defined as a mapping from presentations to timeslots. The core challenge has been formulated as follows [6]: Given the three example sessions, enumerate all valid schedules (= without conflicts) – with only 6 timeslots available, – with papers from the same session on consecutive timeslots, – with unused timeslots only at begin (or end) of a schedule. In practice, a solution was marked “working” when two valid schedules could be generated automatically using graph transformation rules. In the context of the core challenge, teams were allowed to hardcode a solution for the
6
Fig. 2 Example instance graph from the “Conference Scheduling” domain.
Generate all possible instances of Paper, Session, Person, Slot, with adaptable restrictions, like:
Fig. 3 Reference metamodel for the “Conference Scheduling” domain.
configuration shown on Figure 2. When checking a solution, the organisers did not ask to demonstrate the solution for a different number of papers, sessions, or chairs. The underlying idea was that the extensibility of a design and/or flexibility of a language or tool would be measured after the completion of the core assigment. Participants were encouraged to start from the metamodel shown on Figure 3. For the core assignment, the reference instance graph contains a sequence of six linked Timeslot instances. The transformation should create nine edges with the when label, without violating constraints. The following sections list the five additional challenges from the live contest. Mind that these challenges were optional and could be tackled in any order. For each additional challenge, the team with the best solution was awarded with a certificate.
3.4.2 Additional Challenge 1: adaptable instance generation For this challenge, contestants were asked to make their transformation system flexible enough to be able to create on the fly schedules for conference configurations other than the one shown on Figure 2. Additionally, the solution should be able to automatically complete incomplete input graphs based on constraints that were defined on the fly as well. As a baseline, challenge 2 was formulated as follows:
– – – – –
there should be exactly 5 persons, there should be exactly 3 session, there should be exactly 6 slots, there should be three papers per session, at least one person is chair and presents two papers, – at least one person is presenting in 2 different sessions.
In practice, the organisers looked at the input configuration and the constraints that were used by a particular team and asked to make some modifications. A team then needed to show valid schedules and possibly automatically completed parts of the input graph. Teams could leverage this opportunity to demonstrate how their tool facilitated an efficient visualisation of generated graphs (automatic layout, automatic color assignment, extraction of views, ...) To give participants a concrete reference solution for this challenge, the organisers showed some instances that were generated automatically by the Alloy tool [8]. The organisers pointed to strong points (e.g., specialisation features for the automatic layouting mechanism) and weak points (e.g., the lack of a means to store views on the output instance graphs). Figure 4 shows an instance generated by Alloy. In fact, we have not been able to use Alloy for creating instances that were much larger than the one shown on that Figure. The complexity of the underlying constraint solving technique leads to execution times easily lead to virtually infinit execution times. Interestingly, the graph transformation solutions described in this special issue scale better.
7
Fig. 4 Generated conference instance with 7 presenters and one person chairing more than one session.
8
3.4.3 Additional Challenge 2: verification of properties (model checking)
3.4.5 Additional Challenge 4: user interface construction
This challenge was aimed at evaluating whether a tool supported the definition and automatic verification of properties of the graph transformation system. In practice, the organisers verified whether a particular transformation tool was able to realise checks equivalent to the two Alloy examples shown on Figure 5. The Alloy predicates shown on the left of Figure 5 correspond to parts of the graph transformation system that participants had to construct for solving the core challenge: the conflicting predicate formally expresses when two presentations are in conflict whereas the scheduleWithoutConflicts predicate formally states that conflicting presentations should be scheduled on different timeslots. For the model checking challenge, contestants had to verify whether or not their graph transformation system satisfied the properties shown on the right of Figure 5. The conflictingStrongSymmetric constraint checks whether a conflict between two presentations x and y always corresponds to a conflict between y and x. The scheduleWithoutConflictsVERIFY constraint checks whether the system never generates schedules for which a person needs to be present on two different places at the same time. Additionally, the scalability of the verification support was evaluated: can a tool verify the properties from Figure 5 (i) in general, or (ii) for inputs corresponding to a realistic multi-conference, or (iii) only for very small inputs? Teams were also invited to illustrate other verification features to make their solution stand out of the competition.
This challenge was aimed to evaluate the meta-case (concrete syntax definition) functionality of the tools. To be precise: this challenge was designed specifically to enable tools such as AToM3 , GMF and TIGER [3] to show features that are not supported by pure transformation tools such as AGG, GrGen and MOMENT2GT.
3.4.4 Additional Challenge 3: flexibility (extensibility) This challenge was aimed at evaluating wether a solution to the core challenge could easily be extended to satisfy a new requirement. For this purpose, the core challenge was extended with the notion of room availablity. For each timeslot of a conference configuration, the input graph then has a number of associated artifacts (representing a room at one point in time) that can be reserved for a particular presentation. Instead of mapping presentations to timeslots directly, they now need to be mapped to such so-called Reservable instances. In practice, the organisers checked wether a solution could deal with configurations such as: – two rooms are available during six consecutive timeslots, – a conference spans four days, for which there are three timeslots before noon and three timeslots in the afternoon. Before noon, there are three rooms available whereas in the afternoon there is only one room available.
In the context of the conference scheduling case, a user interface for entering sessions (presentations, presenters, chairs) had to be implemented with minimal effort. For example, a tool such as AToM3 enables one to annotate metaclasses with some shape definitions (such as a bitmap of a paper, a person, . . . ) and layout properties (e.g., a containment constraints between a Session symbol and a Paper symbol). The tool can then generate an editor from the annotated metamodel automatically. Ideally, a user interface automatically suggests candidate elements (auto-completion) and integrates with the automatic transformation system. On the other hand, it may be desirable to override schedules that are generated automatically. Thus, a user interface should also facilitate the manual/interactive assignment of presentations to timeslots. Another user-interface related feature is the support for views. A view is a diagram that only shows a limited set of elements (and/or a limited set of attributes from such elements) from the underlying graph. Again, the Alloy-based reference solution can make this concept concrete: Alloy enables one to visualise only nodes of a particular type by clicking some checkboxes in the tool’s user interface. For producing Figure 4, we indicated that only nodes of type Session, Presentation and Person should be shown. Similarly, we restricted the amount of visible edges. Other mechanisms to construct views on the underlying graph are missing: it is for example impossible to manually select elements that need to be hidden or shown in a view. Moreover, the Alloy tool has only very limited support for overriding the position of automatically layouted elements. For producing Figure 4, we already optimized the position of the graph nodes manually. Unfortunately, elements cannot be moved to different rows from the underlying layout grid. This illustrates that in many cases, authors would therefore redraw Alloy output using another drawing tool instead of using Alloy diagrams directly as figures for an article. Clearly, such overhead is undesirable because inconsistencies may arise when the Alloy solution changes and the diagrams need to be updated manually in the external tool. Graph-based tools can learn from this negative example and should illustrate how automatic layouts can be adjusted without the risk for inconsistencies.
9
pred conflicting[p1,p2:Presentation] { p1!=p2 and ( p1.presenter=p2.presenter or ( p1.session!=p2.session and ( p2.presenter = p1.session.chair or p1.session.chair=p2.session.chair ) ) ) }
/* check that conflicting is OK */ assert conflictingStrongSymmetric { all p1, p2: Presentation | conflicting[p1,p2] conflicting[p2,p1] }
fact scheduleWithoutConflicts { no disj r1, r2: Reservable | r1.time=r2.time and conflicting[r1.~when, r2.~when] }
/* check that allocation is OK */ assert scheduleWithoutConflictsVERIFY { no disj pres1, pres2: Presentation | pres1.presenter=pres2.presenter and pres1.when.time=pres2.when.time }
Fig. 5 Example properties that can be checked using Alloy. Challenge: check using transformation tool.
3.4.6 Additional Challenge 5: interoperability In general, the interoperability was aimed at verifying how easily the graphs from a particular transformation tool could be exported (and imported) into (and from) a structure that could be processed by a third-party tool. As a concrete challenge, graphs conforming to the conference metamodel should be mapped to graphs conforming to a pure graph metamodels (consisting of only a node and an edge metaclass and an association between those). In this mapping, a node should be generated for each presentation and an edge should be generated for each conflicting pair of presentations. The resulting graph structure should be processed by an off-the-shelf program for computing a minimal coloring. In this case, a graph should be k-colorable if the conference could be scheduled in k sequential timeslots. Obviously, after applying the third-party coloring algorithm, the results should be mapped back to the conference graph. This task provides a basis for comparing the traceability support of a particular transformation approach: some approaches are known to support traceability implicitly whereas in other approaches, the transformation writer needs to manage traceability links explicitly. Figure 6 shows as an example a visualisation of a graph that corresponds to the conference model shown on Figure 2. A first type of dashed edges connects nodes P1, P2, and P3 as well as nodes P4, P5 and P6 as well as nodes P7, P8 and P9. This type of edges expresses that presentations in the same session cannot occur at the same time. A second type of dashed edges connects P2, P4 and P7. This type of edges expresses that papers from the same author cannot be presented at the same time. In our running example, the author of P2, P4 and P7 is “Schippers”. Finally, solid edges express that a paper cannot be presented while the author is chairing another session.
Graph with colorable nodes P1
P2
P3
Same session Same presenter Busy as chair
P4
P5
P6
P7
P8
P9
Fig. 6 Instance from the Graph domain, based on the conference domain instance shown on Figure 2.
During the contest, the organisers also showed this example output graph to the participants but did not show a valid minimal coloring. The interested reader is referred to the article of Biermann et al. for an elaborated solution [1]. Mind that that solution relies on explicit traceability link management. 4 Evaluation Offline cases. The workshop had 12 submissions to the offline cases: 7 for the AntWorld case, and 5 for the Program Refactoring case. The BPMN-to-BPEL case, on the other hand, did not receive any submissions. This number was lower than for the 2007 tool contest, where the three cases received, on the average, 11 solutions. For this several explanations can be offered: – The timeframe for submitting solutions to the 2008 contest was in May/June, compared to September in 2007. It is likely that for many potential submitters, the early summer period was an obstacle to prepare and submit a solution, especially since the submission deadlines were once again tight.
10
– The 2007 event took place as part of a conference on industrial applications of graph transformation, whereas the 2008 event was colocated with a theoretically oriented conference. Thus, potential submitters may have found it more difficult to justify travelling to the event. The fact that there were no submissions to the model transformation case (BPMN-to-BPEL) may be explained by its (relative) complexity. Indeed, though explicit attempts were made to solicit submissions, it was clear from the reactions that there was insufficient time to prepare solutions. Moreover, as observed above, the hosting event (ICGT) has a strong theoretical flavour in core graph transformation theory, with which those tools that were most likely to deal with this type of case may have had less affinity. Finally, we observed that authors spent rather limited effort on performing detailed comparisons of their solution with that of other participants. An obvious explanation is that it takes a lot of time to install all software prerequisites and all data for reproducing the involved research prototypes. Live contest. 11 teams took part in the live case. 4 teams have submitted a solution in time, in the following order: the GrGen.NET team, the Fujaba team, the Progres team and the EMT team. Teams that decided not to submit a solution could continue working and were not forced to present an incomplete result on the second day of the workshop. The atmosphere of the workshop was competitive yet remarkably constructive: even a team that was unable to show any result, did not complain about details in the assignment. Instead, the team analyzed why their tool did not perform well and participated again in the 2009 edition of the contest! Contest outcome. The outcome of the contest was determined on the basis of a procedure in which after a plenary presentation of the solutions all participants could rank them in several predefined categories; the final grade was calculated as a weighted average. Although as organisers we are well aware of the weak points of this procedure, we feel that the value of actually selecting a “best solution” outweighs the objections, as long as it is recognized that this only acknowledges the quality of the awarded solution and does not devaluate the others. The outcome (also documented at http://fots.ua.ac.be/events/grabats2008/) was: – Best refactoring Solution: Fujaba [5] – Best AntWorld Solution: VMTS [10] – Best live contest solution, separated into core and additional challenges: – Core: Shared beteen GrGen.NET [9] and Fujaba [5] – Instance generation: EMF [1] – Flexibility: GrGen.NET [9] – User interface: MoTif/AToM3 (not submitted to this special section)
– Interoperability: AGG [1]
Recommendation. Here we list some recommendations based on the evaluation above. Since the next edition (GraBaTs 2009) has in fact already taken place, as a satellite of TOOLS and ICMT 2009, we also review what we have done to implement our own recommendations. – Look for a less theoretically oriented hosting event. In fact, the 2009 colocation with ICMT (International Conference on Model Transformation) has proved to be beneficial: attendance was way up from the 2008 event. – Reuse the model transformation case. We did reuse this case in the 2009 edition; there were 10 submissions. – Strengthen the evaluation criteria in the offline cases. In the call for cases, we requested explicit evaluation criteria. Indeed, all case descriptions included such criteria. Still, it turned out to be hard to actually compare solutions based on these criteria, as most of them were qualitative and subjective. – Provide a reference solution for the live challenge. For the GraBaTs 2008 live contest, we had constructed the Alloy reference solution described in Section 3. For future editions of the tool contest, the organisers plan to spend even more time on reviewing the quality of the reference solution. A good reference solution helps to resolve ambiguities in the case description without loosing costly time during the workshop. – Use a live contest challenge with variation points. According to our evaluations, the live contest has a high degree of participant satisfaction because more than one award can be won (see Section 3.2). Therefore, we plan to follow this format for future editions of the contest. – Support and stimulate peer review. During GraBaTs 2008, we experienced severe problems when trying to upload all solutions to a reference server in order to run some benchmark tests. To overcome these problems, we have constructed during 20082009 a novel system, called SHARE, for remotely installing and running all applications on the same hardware. Please refer to http://is.ieis.tue.nl/staff/pvgorp/share/ ?page=ListImages&bundle=GraBaTs08 for the result: that page and the underlying system enable the reader of this special section to reproduce all alleged results without having to install any graph transformation tool. A detailed discussion of the SHARE system and a comparison with other approaches to reproducible research can be found in a dedicated article [18]. We are convinced that SHARE solves most of the technical obstacles that participants previously faced when trying to compare each other’s solutions. Nevertheless, we observe that active community building (e.g., via http:// planet-research20.org/ttc2010/ remains necessary to stim-
11
ulate the peer reviewing of each other’s software and data.
References 1. E. Biermann, C. Ermel, L. Lambers, U. Prange, O. Runge, and G. Taentzer. Introduction to AGG and EMF Tiger by modeling a conference scheduling system. Special Section on the Graph Transformation Tools Contest 2008, STTT, in this issue, 2010. 2. H. Ehrig, G. Engels, H.-J. Kreowski, and G. Rozenberg, eds. Handbook of graph grammars and computing by graph transformation: applications, languages, and tools, vol. 2. World Scientific Publishing Co., Inc., 1999. 3. K. Ehrig, C. Ermel, S. H¨ansgen, and G. Taentzer. Generation of visual editors as eclipse plug-ins. In ASE’05: Proceedings of the 20th IEEE/ACM international Conference on Automated software engineering, pp. 134–143, New York, NY, USA, 2005. ACM. 4. C. Ermel, M. Rudolf, and G. Taentzer. The AGG approach: Language and environment. In H. Ehrig et al. [2], pp. 551–603. 5. L. Geiger and A. Z¨undorf. Fujaba case studies for GraBaTs 2008: Lessons learned. Special Section on the Graph Transformation Tools Contest 2008, STTT, in this issue, 2010. 6. P. V. Gorp. GraBaTs 2009 Live Tool Contest (slideset). http://is.ieis.tue.nl/staff/pvgorp/events/grabats2008/ GraBaTs-part1.pdf and http://is.ieis.tue.nl/staff/pvgorp/ events/grabats2008/GraBaTs-extra.pdf, Sept. 2008. 7. A. Horv´ath, G. Bergmann, I. R´ath, and D. Varr´o. Experimental assessment of combining pattern matching strategies with VIATRA2. Special Section on the Graph Transformation Tools Contest 2008, STTT, in this issue, 2010. 8. D. Jackson. Alloy. http://alloy.mit.edu/, Oct. 2009. 9. E. Jakumeit, S. Buchwald, and M. Kroll. GrGen.NET: The expressive, convenient and fast graph rewrite system. Special Section on the Graph Transformation Tools Contest 2008, STTT, in this issue, 2010. 10. T. M´esz´aros, G. Mezei, T. Levendovszky, and M. Asztalos. Manual and automated performance optimization of model transformation systems. Special Section on the Graph Transformation Tools Contest 2008, STTT, in this issue, 2010. 11. N. Moha, S. Sen, C. Faucher, O. Barais, and J.-M. J´ez´equel. Evaluation of Kermeta for solving graph-based problems. Special Section on the Graph Transformation Tools Contest 2008, STTT, in this issue, 2010. 12. O. Muliawan and D. Janssens. Model refactoring using MoTMoT. Special Section on the Graph Transformation Tools Contest 2008, STTT, in this issue, 2010. 13. C. Ouyang, M. Dumas, A. H. M. ter Hofstede, and W. M. P. van der Aalst. Pattern-based translation of BPMN process models to BPEL web services. International Journal of Web Services Research, 5(1), Jan. 2008. 14. J. P´erez, Y. Crespo, B. Hoffmann, and T. Mens. A case study to evaluate the suitability of graph transformation tools for program refactoring. Special Section on the Graph Transformation Tools Contest 2008, STTT, in this issue, 2010. 15. A. Rensink and P. V. Gorp. Graph-based tools: The contest. In H. Ehrig, R. Heckel, G. Rozenberg, and G. Taentzer, eds., ICGT, vol. 5214 of Lecture Notes in Computer Science, pp. 463–466. Springer, 2008. 16. A. Rensink and G. Taentzer. AGTIVE 2007 graph transformation tool contest. In A. Sch¨urr, M. Nagl, and A. Z¨undorf, eds., AGTIVE, vol. 5088 of Lecture Notes in Computer Science, pp. 487–492. Springer, 2007. 17. A. Sch¨urr, A. J. Winter, and A. Z¨undorf. The PROGRES approach: language and environment. In H. Ehrig et al. [2], pp. 487–550.
18. P. Van Gorp and P. Grefen. Supporting the evaluation of research software with cloud infrastructure. Software and Systems Modeling, special issue on Model Based Interoperability, ?(?), 2010.