This is an open access article published under an ACS AuthorChoice License, which permits copying and redistribution of the article or any adaptations for non-commercial purposes.
Article Cite This: ACS Omega 2018, 3, 11084−11087
http://pubs.acs.org/journal/acsodf
Graphene-Enhanced Raman Spectroscopy Reveals the Controlled Photoreduction of Nitroaromatic Compound on Oxidized Graphene Surface Dongha Shin,† Yong Seok Choi, and Byung Hee Hong*
Downloaded via 181.214.183.253 on September 14, 2018 at 00:42:40 (UTC). See https://pubs.acs.org/sharingguidelines for options on how to legitimately share published articles.
Department of Chemistry, Seoul National University, Seoul 151-742, Korea ABSTRACT: Although graphene-enhanced Raman spectroscopy has been investigated for several years, there have been no studies that have applied it to real-time observations of chemical catalytic reactions. Here, we report that UV/ozonetreated oxidized graphene was used to both control and monitor the photoreduction of an adsorbed nitroaromatic dye compound. Graphene-enhanced Raman spectroscopy studies show that more oxidized graphene surface leads to faster photoreduction. This is due to the lowering of the Fermi level in the oxidized graphene, which is in agreement with the highest occupied molecular orbital level of the adsorbed dye molecule, leading to a rapid electron transfer from graphene to the dye. Our findings will be useful in understanding and exploiting the photocatalytic properties of oxidized graphene on adsorbed molecular species.
■
INTRODUCTION Graphene is one of the famous two-dimensional (2D) materials and has a tremendous impact on a variety of fields, including electronics, physics, materials science, and chemistry.1,2 Its superior optical and electronic properties offer the potential for use as a next-generation photocatalyst.3−8 Highly conjugated π electrons of graphene are also useful for the adsorption of foreign molecules (reactants in catalyst process) via π−π interaction. Vibrational spectroscopic fingerprint of molecules gives abundant information about molecular geometric structure, degree of charged state, and interaction with the substrates.9,10 Among the various methods, surface-enhanced Raman spectroscopy (SERS) is one of the powerful tools to detect the analytes even down to the single-molecule limit when situated near the nanostructure of novel metals. Thus, much efforts have been made to explore this phenomenon.11,12 Compared to conventional SERS, using a metal as a Raman signal enhancer, graphene-enhanced Raman spectroscopy (GERS) has recently attracted interest since just a single layer of graphene was allowed to exhibit the apparent Raman signal of the adsorbed dye, although its enhancement mechanism is still debated.13−28 Most studies regarding GERS fall into two categories. One is revealing the origin of enhancement mechanism, and the other is the real application to detect the analytes of interest. However, application of GERS to monitor the chemical reaction has not been explored to date. Nitroaromatic compounds are important because they are widely used in various industrial fields such as organic dyes and explosive materials, but they are known to cause serious environmental pollution.29 Very recently, we have reported that single-layer graphene can be used to catalyze the © 2018 American Chemical Society
photoinduced reduction of a nitroaromatic dye compound without a photosensitizer like TiO2, which was revealed by GERS.30 The proposed mechanism involves the fast electron transfer from graphene to empty highest occupied molecular orbital (HOMO) states of photoexcited dye molecules. Also, we compared the Raman spectral changes in various graphene dye structures and revealed that the ambient hydrogen source, which is needed for photoreduction, can be effectively blocked by sandwiching graphene layers. Here, we demonstrate that GERS is useful for revealing the rate control of photoreduction occurring on oxidized graphene. Our results demonstrate the realization of controlled catalytic performance of oxidized graphene on an adsorbed nitroaromatic dye compounds.
■
EXPERIMENTAL SECTION The chemical vapor deposition (CVD)-based synthetic method of graphene was fully described in a previous paper.30 Briefly, graphene was CVD-synthesized on a highpurity copper foil (Alfa Aesar, 99.999%) with flowing 5 sccm H2 and 45 sccm CH4 gas. After spin-coating one side of graphene with poly(methyl methacrylate) (PMMA), back-side graphene was etched using oxygen plasma. Then, the PMMA layer on graphene was removed by acetone. The remaining copper was etched in 1.8 wt % ammonium persulfate solution. Finally, the monolayer graphene was rinsed with distilled water several times. After washed graphene was laid on a Si/SiO2 (300 nm) wafer, the samples were treated using a conventional Received: June 8, 2018 Accepted: September 4, 2018 Published: September 13, 2018 11084
DOI: 10.1021/acsomega.8b01285 ACS Omega 2018, 3, 11084−11087
ACS Omega
Article
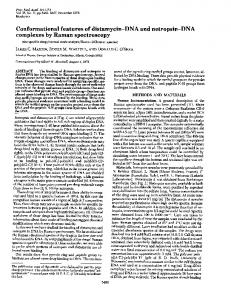
Figure 1. (a) Schematic diagram showing electron transfer from lowered Fermi level in oxidized graphene to HOMO in photoexcited dye (DR1: disperse red 1). (b) Photoinduced reduction of nitro-disperse red 1 to amino-disperse red 1 on graphene surface.
UV/ozone cleaner (Bioforce) for 5 and 10 min, respectively, before sample loading and Raman measurements. Disperse red 1 (DR1, Aldrich, 95%) was used as received. Each graphene sample on a silicon piece is dipped into the ethanolic solution of DR1 (200 μM) for more than 30 min and then washed with copious ethanol and deionized water to remove the unbounded molecules. A 514.5 nm laser light of 0.5 mW (or 532 nm of 2 mW) was irradiated onto the sample surface to measure Raman signals and to drive photoreduction simultaneously.30 Back-scattered Raman signals were measured using the commercialized Raman model (Renishaw inVia RM 1000 (514.5 nm, 2400 grooves/mm) or Witec Alpha 300 (532 nm, 600 grooves/mm)).
■
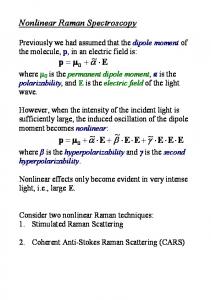
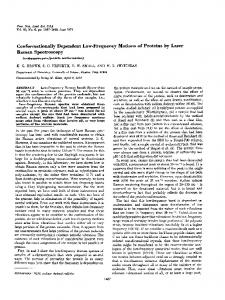
Figure 2. Raman characterization of graphene with UV/ozone treatment time.
RESULTS Figure 1 shows a schematic diagram of the change of the Fermi level in graphene induced by UV/ozone treatment. For the pristine single-layer graphene, the position of the Fermi level is close to the Dirac point. It is well known that CVD-synthesized and transferred graphene exhibits a slightly p-doped state caused by captured water underneath the graphene during the wet transfer process or by the left residue of PMMA used as a supporting polymer. UV/ozone exposure induces further lowering of the Fermi level in graphene. The generated oxygen-containing functionality is believed to draw the electrons from the graphene. This is already confirmed by the change of the Dirac point value in graphene-field effect transistor in a previous work in our lab.31 When the adsorbed DR1 was excited with incident resonant light, empty HOMO states were temporarily generated in photoexcited DR1. Then, since the electrons are rich and ultrafast in graphene, the empty hole in the HOMO level of photoexcited DR1 was filled with electrons from the adjacent graphene. Considering the intrinsic energy level of the HOMO and LUMO (lowest unoccupied molecular orbital) in DR1,32,33 the Fermi level of the oxidized graphene came close to the state of HOMO in DR1 due to the p-doping on graphene, as shown in Figure 1a. This means that more oxidized graphene leads to more easy transfer of electrons to DR1, resulting in a fast photoreduction of DR1 on graphene. Raman spectrum of graphene is commonly used to represent its electronic state noninvasively. Figure 2 shows the change of Raman spectrum of graphene according to the UV/ozone exposure time. Before any treatment, Raman spectrum (bottom) shows a typical spectral feature of the pristine graphene. The 2D peak has an ideal Lorentzian shape, and the
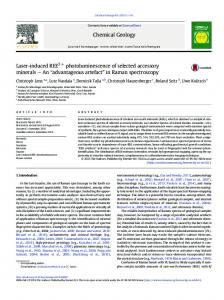
signal ratio between G and 2D peaks is 3 ∼ 4, both of which verify the existence of pristine single-layered graphene. After 5 min of treatment, the D peak starts to appear and becomes more prominent after 10 min. As the oxidation occurs on graphene by UV/ozone treatment, the sp2 network in graphene starts to be destroyed. Thus, the D/G peak ratio along with the bandwidth of the 2D peak also increases with increasing UV/ ozone treatment time.31 This has been already confirmed experimentally in a previous work. Disperse red 1 (DR1) dye molecules were subject to be adsorbed onto each substrate (0, 5, and 10 min of UV/ozone treatment), and Raman measurements were conducted. Figure 3 shows the apparent Raman spectrum of DR1 adsorbed on graphene. Irradiation was carried out using a 514.5 nm laser, and the background spectrum, which is believed to be originated from the fluorescence of the dye, was significantly quenched due to the ultrafast charge carrier in graphene. The peaks at 1103, 1134, 1194, 1334, 1387, 1422, 1444, and 1588 cm−1 can be assigned to δ(C−H), ν(C−N), δ(C−H), ν(N− O), ν(NN), ν(C−C), ν(C−C), and ν(C−C) in the DR1 dye, respectively. One notable point is the increase of GERS of the dye signal with UV/ozone exposure time. All Raman bands from the dye exhibit increase in intensity with UV/ozone treatment. This is already mentioned in a previous paper that the induced dipole from the generated oxygen functionality might attribute to the enhanced GERS signal.31 The more interesting point is the time-resolved Raman signal during laser irradiation at each single substrate. We note that the relative intensity of the peaks at 1334 cm−1 (nitro group) compared to the one of the first-order phonon peaks in silicon shows 11085
DOI: 10.1021/acsomega.8b01285 ACS Omega 2018, 3, 11084−11087
ACS Omega
■
Article
AUTHOR INFORMATION
Corresponding Author
*E-mail:
[email protected]. ORCID
Dongha Shin: 0000-0003-3939-6797 Byung Hee Hong: 0000-0001-8355-8875 Present Address †
Department of Physics and Astronomy, Seoul National University, Seoul 151-742, Korea (D.S.).
Notes
The authors declare no competing financial interest.
■
ACKNOWLEDGMENTS This research was supported by the Basic Science Research Program through the National Research Foundation of Korea (NRF) funded by the Ministry of Education, Science and Technology (2017R1A6A3A11031278).
Figure 3. Graphene-enhanced Raman spectrum (GERS) of disperse red 1 adsorbed on UV/ozone-treated graphene with different exposure times.
■
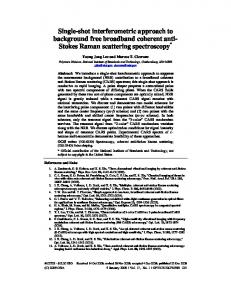
different decrease phenomena with irradiation time, and it is observed that more fast enhancement is observed in more UV/ ozone-treated graphene. This is clearly shown in Figure 4. As already mentioned, during the photoreduction reaction, the peak of the nitro group at 1334 cm−1 from nitro-DR1 decreases while the peak of the amine group at 1121 cm−1 from amino-DR1 increases simultaneously.30 Therefore, the peak decrease at 1334 cm−1 indicates the occurrence of a degree of photoreduction reaction.
REFERENCES
(1) Zhang, Y.; Tan, Y.-W.; Stormer, H. L.; Kim, P. Experimental Observation of the Quantum Hall Effect and Berry’s Phase in Graphene. Nature 2005, 438, 201−204. (2) Novoselov, K. S.; Geim, A. K.; Morozov, S. V.; Jiang, D.; Katsnelson, M. I.; Grigorieva, I. V.; Dubonos, S. V.; Firsov, A. A. TwoDimensional Gas of Massless Dirac Fermions in Graphene. Nature 2005, 438, 197−200. (3) Xiang, Q.; Yu, J.; Jaroniec, M. Graphene-Based Semiconductor Photocatalysts. Chem. Soc. Rev. 2012, 41, 782−796. (4) Xiang, Q.; Yu, J.; Jaroniec, M. Synergetic Effect of MoS2 and Graphene as Cocatalysts for Enhanced Photocatalytic H2 Production Activity of TiO2 Nanoparticles. J. Am. Chem. Soc. 2012, 134, 6575− 6578. (5) Xiang, Q.; Yu, J.; Jaroniec, M. Preparation and Enhanced VisibleLight Photocatalytic H 2 -Production Activity of Graphene / C 3 N 4 Composites. J. Phys. Chem. C 2011, 115, 7355−7363. (6) Williams, G.; Seger, B.; Kamat, P. V. UV-Assisted Photocatalytic Reduction of Graphene Oxide. ACS Nano 2008, 2, 1487−1491. (7) Zhang, H.; Lv, X.; Li, Y.; Wang, Y.; Li, J. P25 Graphene Composite as a High Performance Photocatalyst. ACS Nano 2010, 4, 380−386. (8) Li, Q.; Guo, B. D.; Yu, J. G.; Ran, J. R.; Zhang, B. H.; Yan, H. J.; Gong, J. R. Highly Efficient Visible-Light-Driven Photocatalytic Hydrogen Production of CdS-Cluster-Decorated Graphene Nanosheets. J. Am. Chem. Soc. 2011, 133, 10878−10884.
■
CONCLUSIONS In summary, we spectroscopically investigated the controlled photoreduction reaction occurring on oxidized graphene using the nitroaromatic dye compound. More oxidized graphene has been found to induce fast photoreduction of the dye, which is attributed to the lowering of the Fermi level of oxidized graphene, leading to fast electron transfer from graphene to the dye. Our findings provide a better understanding of graphene in terms of photocatalyst and also an easy way to control the catalytic performance on the adsorbed molecular species without any photosensitizers. In addition, other types of plasma treatments, such as nitrogen and argon, can produce different types of two-dimensional materials with desired catalytic performance.
Figure 4. (a) Reduction of Raman intensity of the nitro group at 1334 cm−1 showing that the photoreduction rate of DR1 on oxidized graphene surfaces changes with different UV/ozone treatment times. (b) Real-time spectra of GERS of DR1 with laser irradiation. 11086
DOI: 10.1021/acsomega.8b01285 ACS Omega 2018, 3, 11084−11087
ACS Omega
Article
(9) Krimm, S.; Bandekdar, J. Vibrational Analysis of Peptides, Polypeptides and Proteins. Biopolymers 1980, 19, 1−29. (10) Stipe, B. C.; Rezaei, M. A.; Ho, W. Single-Molecule Vibrational Spectroscopy and Microscopy. Science 1998, 280, 1732−1735. (11) Moskovits, M. Surface-Enhanced Raman Spectroscopy: A Brief Retrospective. J. Raman Spectrosc. 2005, 36, 485−496. (12) Nie, S.; Emory, S. R. Probing Single Molecules and Single Nanoparticles by Surface Enhanced Raman Scattering. Science 1997, 275, 1102−1106. (13) Xie, L.; Ling, X.; Fang, Y.; Zhang, J.; Liu, Z. Graphene as a Substrate to Suppress Fluorescence in Resonance Raman Spectroscopy. J. Am. Chem. Soc. 2009, 131, 9890−9891. (14) Ling, X.; Zhang, J. First-Layer Effect in Graphene-Enhanced Raman Scattering. Small 2010, 6, 2020−2025. (15) Ling, X.; Xie, L.; Fang, Y.; Xu, H.; Zhang, H.; Kong, J.; Dresselhaus, M. S.; Zhang, J.; Liu, Z. Can Graphene Be Used as a Substrate for Raman Enhancement? Nano Lett. 2010, 10, 553−561. (16) Jung, N.; Crowther, A. C.; Kim, N.; Kim, P.; Brus, L. Raman Enhancement on Graphene: Adsorbed and Intercalated Molecular Species. ACS Nano 2010, 4, 7005−7013. (17) Ling, X.; Zhang, J. Interference Phenomenon in GrapheneEnhanced Raman Scattering. J. Phys. Chem. C 2011, 115, 2835−2840. (18) Xu, H.; Chen, Y.; Xu, W.; Zhang, H.; Kong, J.; Dresselhaus, M. S.; Zhang, J. Modulating the Charge-Transfer Enhancement in GERS Using an Electrical Field under Vacuum and an N/p-Doping Atmosphere. Small 2011, 7, 2945−2952. (19) Ling, X.; Moura, L. G.; Pimenta, M. A.; Zhang, J. ChargeTransfer Mechanism in Graphene-Enhanced Raman Scattering. J. Phys. Chem. C 2012, 116, 25112−25118. (20) Yaghobian, F.; Korn, T.; Schüller, C. Frequency Shift in Graphene-Enhanced Raman Signal of Molecules. ChemPhysChem 2012, 13, 4271−4275. (21) Ling, X.; Wu, J.; Xu, W.; Zhang, J. Probing the Effect of Molecular Orientation on the Intensity of Chemical Enhancement Using Graphene-Enhanced Raman Spectroscopy. Small 2012, 8, 1365−1372. (22) Xu, W.; Ling, X.; Xiao, J.; Dresselhaus, M. S.; Kong, J.; Xu, H.; Liu, Z.; Zhang, J. Surface Enhanced Raman Spectroscopy on a Flat Graphene Surface. Proc. Natl. Acad. Sci. U.S.A. 2012, 109, 9281−9286. (23) Thrall, E. S.; Crowther, A. C.; Yu, Z.; Brus, L. E. R6G on Graphene: High Raman Detection Sensitivity, yet Decreased Raman Cross-Section. Nano Lett. 2012, 12, 1571−1577. (24) Ling, X.; Wu, J.; Xie, L.; Zhang, J. Graphene-ThicknessDependent Graphene-Enhanced Raman Scattering. J. Phys. Chem. C 2013, 117, 2369−2376. (25) Xu, W.; Mao, N.; Zhang, J. Graphene: A Platform for SurfaceEnhanced Raman Spectroscopy. Small 2013, 9, 1206−1224. (26) Xu, W.; Xiao, J.; Chen, Y.; Chen, Y.; Ling, X.; Zhang, J. Graphene-Veiled Gold Substrate for Surface-Enhanced Raman Spectroscopy. Adv. Mater. 2013, 25, 928−933. (27) Barros, E. B.; Dresselhaus, M. S. Theory of Raman Enhancement by Two-Dimensional Materials: Applications for Graphene-Enhanced Raman Spectroscopy. Phys. Rev. B 2014, 90, 35443. (28) Deng, S.; Xu, W.; Wang, J.; Ling, X.; Wu, J.; Xie, L.; Kong, J.; Dresselhaus, M. S.; Zhang, J. Direct Measurement of the Raman Enhancement Factor of Rhodamine 6G on Graphene under Resonant Excitation. Nano Res. 2014, 7, 1271−1279. (29) Spain, J. C. Biodegradation of Nitroaromatic Compounds. Annu. Rev. Microbiol. 1995, 49, 523−555. (30) Lee, B.; Kang, J. H.; Jo, I.; Shin, D.; Hong, B. H. GrapheneCatalyzed Photoreduction of Dye Molecules Revealed by Graphene Enhanced Raman Spectroscopy. Phys. Chem. Chem. Phys. 2016, 18, 3413−3415. (31) Huh, S.; Park, J.; Kim, Y. S.; Kim, K. S.; Hong, B. H.; Nam, J.M. UV/Ozone-Oxidized Large-Scale Graphene Platform with Large Chemical Enhancement in Surface-Enhanced Raman Scattering. ACS Nano 2011, 5, 9799−9806.
(32) Wang, M.; Chesnut, E.; Sun, Y.; Tong, M.; Guide, M.; Zhang, Y.; Treat, N. D.; Varotto, A.; Mayer, A.; Chabinyc, M. L.; Nguyen, T.Q.; Wudl, F. PCBM Disperse-Red Ester with Strong Visible-Light Absorption: Implication of Molecular Design and Morphological Control for Organic Solar Cells. J. Phys. Chem. C 2012, 116, 1313− 1321. (33) Das, A.; Pisana, S.; Chakraborty, B.; Piscanec, S.; Saha, S. K.; Waghmare, U. V.; Novoselov, K. S.; Krishnamurthy, H. R.; Geim, A. K.; Ferrari, A. C.; Sood, A. K. Monitoring dopants by Raman scattering in an electrochemically top-gated graphene transistor. Nat. Nanotechnol. 2008, 3, 210−215.
11087
DOI: 10.1021/acsomega.8b01285 ACS Omega 2018, 3, 11084−11087