Graphical
Table of Contents Xia Lin
School of Library and Information University of Kentucky Lexington, KY 40506
[email protected] .edu
ABSTRACT This paper proposes a graphical table of contents (GTOC) that is functionally analogous to the table of contents. The proposed GTOC can be generated automatically from the text of documents. It visualizes document contents and relationships to allow easy access of underlying documents. It also provides various interactive tools to let the user explore the documents. Issues of how to generate such GTOC include how documents are indexed and organized, how the organized documents are visualized, and what interactive means are needed to provide necessary functionality of GTOC. These issues are discussed in this paper with a GTOC prototype based on Kohonen’s selforganizing featore map algorithm.
1.
INTRODUCTION
What kinds of formats that the table of contents needs to be in the digital environment? This paper proposes a graphical table of contents (GTOC) that is functionally analogous to the table of contents in the printed environment, Like the table of contents, GTOC will provide (1) an overview to the contents covered in a book or a collection of articles, (2) a set of semantic clusters (or sections) that group related documents together, and (3) a quick access to documents by their contents. Furthermore, because of its associative indexing and its visual features, GTOC will encourage users to browse or scan information by their visual perception, which is the most effective method for receiving and assimilating information for humans (Arnheim, 1971). The proposed graphical table of contents will be generated automatically from the text of documents, either from a book, one or several issues of a journal, or a set of documents in a database. Issues of how to generate such GTOC include how documents are indexed and organized, how the organized documents are visualized, and what interactive means are needed to provide necessary functionality of GTOC. In this paper, these issues are elaborated using examples of GTOC generated by a selforganizing mapping algorithm. These examples demonstrate that semantic structures of documents can be abstracted and visualized to assist information access in the digital environment, and graphical displays of documents will likely support those functions of the table of contents. In the next section, literature of contents will be reviewed
related to research on the table fkst.
Permission to make dlgitellhard copies of all or part of Wla material for peraoml or claaamam use ia gmnted without fee provided that the copies are not made or dktributed for profit or cornnwvial advantage, the. copyright notice, the title of the publication and ita date appear, and notice is given that copyright is by perrniasion of the ACM, Inc. To copy otherwise, to repubtish, to peat on servers or to mdiatribute to fiats, requires apeeific pm-mission andlor fee. DL’96, Bethesda MD USA
@1996 ACM ()-89791-83&4/9(j/03. .$3.50
2. FEATURES
OF THE
TABLE
OF CONTENTS
Almost every book or every issue of a journal has a table of eontents (TOC). Surprising y, there has been much less research on TOC than on other components of documents such as titles or title pages, abstracts, and back-of-thebook indexing. While it is difficult to contradict the importance of TOC, it seems to be a common sense that use of TOC is rather simple, and construction of TOC is straight forward. This is perhaps true in the printed environment, but this will certainly not be the case in the upcoming digital information environment. In this section, features of TOC will be reviewed, and how these features should be implemented in the digital environment will be discussed. The organization of TOC in the printed environment may seem to be trivial: for every book, or every assembled collection of documents, titles and authors of individual documents or chapters are listed along with their pagination, which, all together, become the table of contents. Nevertheless, practices of TOC are varied from books to books, and journals to journals. Juhasz, et al. (1973) analyzed more than 120 primary journals to investigate features of TOC. Major variations were found in terms of title listing and pagination system, the sequential arrangement of author, title, and pagination, and leaders between pagination and other elements. These differences indicate that the visual appearance is a major feature of TOC. In fact, if such a comparison is done between books or scholarly journals and magazines, the visual difference is even more obvious. For example, one can easily tell a difference between TOC of scholarly journals and TOC of trade magazines: while the formal uses exclusively text in a rather formal way, the latter has a variety of text, pictures and other display elements. Another feature of TOC ia to provide an overview to contents of books or journals. TOC groups articles or chapters into sections with section headings. The grouping also separates different types of articles such as “research papera” and “book reviews. ” People can get to know contents of a book by scanning through its TOC. They can quickly judge whether or not any chapters or articles of the book are of interest to them. Prabha et al. (1988) surveyed 331 library users on the use of non-fiction books. They found that TOC was the feature most commonly used to determine which books to borrow. Because of this overview feature, TOC is also a good tool for current awareness services. Researchers often browse through TOCS of some selected periodicals to keep track of recent development in their
access
is
also
universities to
Services”
network
there
Many
fields.
Contents
45
Science
means
an
faculty
(Machovec,
information
now
offer
through 1994).
service.
E-mail
“Tables or
of other
On the Internet, TABLE-OF-
CONTENTS, Inc. (Gopher://mag-browse.com) that provides access to weekly updated TOCS of 165 top magazines, which, as they claim, “keeps you at the absolute cutting edge of what’s happening.” Clearly, the most important feature of TOC is to provide a direct access to individual documents or book chapters. In the printed environment, this function has been used effectively by users. They can quickly identify individual titles from TOC and follow the page numbers to documents. In the digital environment, however, TOC has not been well incorporated into the searching environment. Research on online catalog (Markey, 1983) indicated that TOC was the most important information missing in current online catalogs and to be able to search TOC was the most desirable function needed to add to online catalogs. Thus, most research on TOC is centered on using TOC for contentenriched access (Cochrane, 1985, Van Orden, 1990). The experiment conducted by Dillon and Wenzel (1990) clearly shows that adding TOC will improve overall retrieval effectiveness of online catalogs. Current library online catalogs have successfully modeled the card catalog for information access at the book level. However, the digital library wearebuilding now will need access not only at the book level but also at the article and In the digital section levels, even at the idea level. environment, there will be no longer a clearly defined storage format called “page.” There is even less certain what constitutes a “book.” A(paper) book is a collection of related items, a result of a query search from a digital library is also a collection of related items. While items in the book are brought together by the author, items in the result of a query are brought together according to the reader’s needs (the query statement). If, in the digital library, the user can group a set of needed items to create a “dynamic book,” and can access these items using many features currently available in books, the user will likely find it easier to access the needed information in such a “dynamic book. ” To explore an analog version of the printed table of contents, we need to consider differences between the printed and digital environments, and the features of the table of contents reviewed early. It is proposed that, in the digital environment, “ the table of contents needs to be generated automatically to reflect the dynamic feature of “digital books” and online collections. ● the table of contents needs to provide an overview to contents of the documents it covers; the overview should reflect how documents or key concepts in the documents are semantically related to each other. ● the table of contents needs to “self-organize” the documents into clusters, groups, or sections, with ●
●
appropriate headings automatically assigned table of contents needs to be visually attractive to support browsing and visual sense-making. the table of contents needs to be simple and easy to use, it needs to provide a direct access to underlying documents. the
The GTOC prototype described later is based on these ideas, and the idea of visualization for information access. The next section reviews related literature on information visualization.
3. VISUALIZATION ACCESS
FOR
INFORMATION
In the printed environment, people are used to seeing information on tangible media (such as papers and books) and stored in visible locations (such as libraries). They can do a recognition better than do a recall when searching objects. In the digital environment, it becomes difficult to “see” information and to “recognize” information by visual perception. People can only rely on textual queries they generate to retrieve information from databases. However, as the result of rapid development of graphical and visualization techniques, this situation is likely to change. The computer will soon create or reintroduce visual cues that are lost when information is converted from printed resources to electronic resources. It will rearrange and reassociate information items to reveal new associations that might not be seen otherwise (Veith, 1988). It will create visual interfaces that allow visual and perceptual information seeking in the digital environment. To reach this level of information seeking, a critical issue is how information should be represented and visually displayed. Researchers have addressed this issue for years. Doyle (1962) suggested “semantic road maps” based on word associations that could provide “a view of the entire library at a distance” and help the searcher to “narrow his focus by recognition.” Miller (1968) emphasized that what waa needed was “a spatial organization for the stored information that is more compatible with the structure of the information itself.” Sammon (1969) mapped a set of documents by a nonlinear mapping algorithm to reveal document associations. Fairchild et al. (1988) proposed and tested a three-dimensional network knowledge base, SemNet, where the user can view both local and global structures of the associative network. Fowler et al. (1991) applied a mathematical model, “the Pathfinder Networks, ” to unify a visual space for queries, documents and terms. Arents and Bogaerts (1993) explored a structure called “Cube of contents” to visualize structures of hyperindexing. The most comprehensive information visualization project is the Information Visualizer developed in Xerox PARC (Robertaon, et al. 1993). The Information Visualizer incorporates various visualization formats, such as DataMap, InfoGrid, ConeTree, and Perspective wall, to visualize information from different perspectives and at different levels of abstraction. In a series of research, Lin (Lin, et al., 1991; Lin, 1992) proposed a map display that would show both contents and structures of a document space. The map display represents a “survey” of all the documents in the document space. It defines a spatial analog for the documents, and reveals contents and semantic relationships of documents by various visual cues such as distances, links, clusters, areas, and neighborhoods. The underlying engine for the map display is a neural networks’ learning algorithm, Kohonen’s feature map (Kohonen, 1989). Because of the algorithm’s learning and self-organizing feature, the map display can maintain document semantic relationships as measured by word occurrence and co-occurrence, and it can show major content areas that “win” over other areaa through recursive competitions. The map display was evaluated by comparing its structures and functions to some human-generated map displays (Lin, The map display was akw tested in an et al., 1993).
46
experiment that involved sixty-eight conducted some simple retrieval tasks with
subjects who the map display
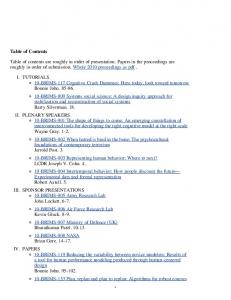
(Lin, 1995). These studies contributed to an understanding of how information should be organized and displayed graphically. It was during these research activities that the idea of GTOC sparkled: if a map display was generated based on one or several tables of contents, the display might function as a table of contents in the digital environment. Thus, an experimental GTOC prototype was implemented to study functions and features of the table of contents in the digital environment. The next section describes the prototype. 4. THE GTOC PROTOTYPE Three procedures are designed to generate the GTOC prototype an indexing procedure, amapping procedure, and a display procedure. The indexing procedure converts documents to numerical vectors. The procedure is currently based on the Vector Space Model (Salton, 1989). The process includes: (1) extract a list of words from the documents, (2) delete stopwords frnm the list, (3) use a word-stem procedure to reduce the list to stem form, and (4) create indexing vectors based on the stemmed list. The indexing vectors can be either in a binary form based on word occurrence, or in a weight form based on word frequencies and/or inverse document frequencies. Once the indexing vectors are generated, the mapping procedure will start to organize the indexing vectors and associate them to a visual space in the end. The procedure currently is based on Kohonen’s self-organizing feature map. It creates neighborhoods on a two-dimensional space where similar documents are mapped to nearby locations. Finally, a display procedure will plot the mapping results on an interface and link various interactive functions to the mapping results. Figure 1 shows a GTOC for SIGIR proceedings 1986-1993, for a total of 292 documents. Statically, the display shows a general overview of the contents. All the areas, their locations, and their labels, are automatically drawn by the display procedure based on the mapping results. The larger the areas, the more often the (labeling) terms are discussed The closer the two areas, the more in the proceedings. likely the terms in the two areas are co-occurred in documents of the proceedings. Interactively, the display can reveal even more information. The slider on the bottom of the map controls the number of terms shown on the display. When the slider is moved to the left, only those terms with high “activation levels” are displayed, when the slider is moved toward the right, keywords with lower “activation levels” are added to the display. Because the activation level of a term indicates frequencies of term occurrence and co-occurrence, those with high “activation levels” can be regarded as “major” terms in the collection, which are shown on the interface first. Figure 1 shows the SIGIR GTOC in two levels: first, major areas are identified by terms such as “systems,” “full text (indexing),” “documents,” “model,” “applications,” “queries,” “interface design,” etc. As the slider is moved to the right, more terms are added to the display. These terms are shown on the display at the locations determined by their associations. They improve descriptions of the areas and clarify some terms shown early. For example, for the “model” area, the related terms are “vector space,” “extended boo lean,” and which represent a good sample of IR “probabilistic,” For the “queries” area, models discussed in the literature.
47
words added to it are “expansion,” “relevance feedback,” “evaluation,” and “process.” These terms again show strong semantic relationships. When the slider moves to further right, more terms will be added to the display, and relationships of areas or terms will become increasingly clear. GTOC users can decide at what level of details the display should show. They will typically start to browse the display with a few terms on it. If a term or an area is perceived to be related to their information needs, they will naturally focus on that area of the display when adding more terms to the display. If the display becomes confusing, they can always move back the slider to reduce the number of terms on the display. When one or several terms are identified to be associated with the needed information, they can click on that location, a pop-up window will show the top 10 titles associated to this location (Figure 2). These titles are arranged by their associative weights, and they are likely semantically related to the terms clicked. When users find a title they are looking for, they can click on the title to see the full display of the article, just like they would turn to that page when a title is found in the table of contents. If they do not find the title, they can adjust the clicking location to open another (title) window. After they move around the surface for a while, the structures of the display will become visually familiar to them, and it will become much easier to click on the right location for documents they are looking for. A major difference of the term display and the title display is that while each term is mapped to a unique location on the display, titles may be mapped to multiple locations dynamically based on their associations to the terms. Therefore, users do not need to click on an exact location for a title, clicking anywhere within a neighborhood of a key concept in a title will “fire up” the title. If the title has multiple key concepts or key terms, it will likely appear in This feature tolerates “fuzziness” of multiple locations. visual perception so that users only need to decide an approximate location for a title they look for and the title will be shown up there very often.
5. ISSUES OF GTOC CONSTRUCTION The GTOC prototype was constructed as an experimental tool to study new forms of the table of contents in the digital environment. During the prototype design process, many theoretical and practical issues occurred. These issues are essential to the concept of GTOC, and much more research is needed to study various problems related to these issues. In this section, our recent research effects on these issues are described, and some primary results are presented and discussed.
5.1 Document indexing
representation
and
document
It is important to realize that any visual display can only be as good as the input used to generate the display. Thus, how the underlying documents are represented and indexed will have a significant impact on the final organization and views of GTOC. The Vector Space Model used in the above example is widely acceptable in the information retrieval However, there are still many different community. approaches to apply the model to practical problems. There are also different considerations when applying the model
Table et hod
linguistic
Contents
This is an associative map display for SIGIR proceedings 1986-1994.
queries
Words on the map (and their relationships) represent contents of the proceedings.
I
applications
databases
documen natural language
lctions hypertext
seurus
f Ull
or the location.
+)
iniwface
To add more words on the map, move the slider to the right. To reduce the number of words, move the slider to the left. Click on my word or location to see titles associated with the word
Iructien
ti?xt
Click on any title to view full record of the
systems design
ccess
of
structue
indexing
~
document,
1
expansGi— networks
krm I
I logic
st
ud~
decum(
,c+i...lwTT”Trl-rl r=$G’.1
c1wte
*hg.eriJxt Texico;i&t
automatiw
conwpt
ual
knowledoe reprwentetions
Ill I
4“ interface intelligent problems u3e r
dev;~lv;mt
text .wmprswiwn
expert s !.I$l$,:ns
design II
i ndexi ware
h
FIGURE 1. Dynamic views of GTOC. GTOC presents contents in different levels of details. As the slider moves to the right, more terms are added to the display based on their associative relationships.
48
Gr8phical
Table kethod .4 ——..
i rnproved
linau!s~ic
structue
t-queries
Ii media
d
I
I
--l < I
-placations
q“=
Scatter{Gather:ACluster- BasedAooroachto BrowsinoLa Onthe Allocationof Documentsin Multiprocessor Info;rna “ ConstantInterection-Time Scatter/GatherBrowsingof W Hierarchic DocumentClustering UeingWard’s Method User-OrientedDocumentClustering: A Frameworkfor Let Integrating Query,Thesaurus,ati Documents through a C #j
!
..
trm+ion ““..
seurw
i
Experience with Large Oocument Collections i~lj; Structured Answers for a Large Structured Documant CoilB
Extmrimentswith CIueruAcquisition andUsein Docume nt Q user
systems design
“mlt=l
of Content
f
i ndexi
II
access 8 activities 3 adaptive 3 advanced 2 algorithms 6 rinrilysis 12 answering 3 applications 8 approaches 13 architecture 5 artificial 2 associations 2 automatic 15 automating 3 bibliographic 3
bit 2 bitmaps 2 boolean 4 browsing 6 case 2 classification cluster 13 cognitive 3
2
Figure 2. Pop up windows of GTOC. While the map display shows a general overview contents, ‘the ‘POPUDwindow shows titles related to the cl~cked location iin this examole. word “ciuster” ‘is ~l[cked).
for retrieving and matching purposes and for visualizing and browsing purposes. For example, using title words only for indexing is usually considered as a limited document representation for information retrieval. Using words from titles, abstracts, and fulltext to index documents will improve the power of representation significantly (Salton, 1989). On the other hand, dimensions used to index the collection are also significantly increased when the indexing changes from title words only to words from abstracts or fulltext. For visualization purpose, words used for indexing are also candidate words for labels on the visual display. As the size of display space is limited, the number of labels that can be put on the display is very limited. This leads to the question of how much visual improvement it would make when the indexing changes from a much highdimensional document representation based on fulltext indexing to a low-dimensional representation based on titles. We may expect that, while using every word in the fulltext improves the representation, words appear in the titles may still be the most useful words to be used as labels in a visual display of documents. Thus, it is necessary to compare visual displays generated by different indexing procedures in order to determine what indexing procedures to apply for GTOC construction. Currently, we are comparing three different types of indexes:
49
of the
(1) TT-indexing: words that appear in at least two titles are collecte~ as the based ~et for indexing, after the stopword-remov ing and stemming procedures, a vector is created for each document using the binary representation, that is, a “ 1” is used if the word corresponding to the particular dimension is appeared in the title, and a “O” is used otherwise. The based set of words used for (2) TF-indexing: indexing is collected the same way in the TTindexing, but the indexing procedure is based on words in titles, keywords, and abstracts of documents. A vector is created using the weight representation of within document frequencies(dfj. This indexing procedure uses the same low dimensions as the title indexing, but the indexing vectors reflect how the indexing words are distributed in titles, keywords and abstracts. (3) FF-indexing: Every word from titles, keywords and abstracts is collected. Those that occur in at least three documents are used as the based indexing set. A vector is created for each document using the weight representation with both within and inverse document frequencies (idf). This is a standard fulltext indexing procedure.
Number of documents
Number of Terms
Training
8) Among the top 20% (as measured by the activation level) of terms in the third display, about 80% of them appear in the titles. In other words, if the display can only show 20% of fulltext indexing terms due to the limited display space, title words can account for most of them.
Time
TT-indexing
143
126
TF-indexing
143
126
351 seconds 352 seconds
FF-indexing
143
568
1908 seconds
Tablel. Descriptive data onapplying thethree ~pesofindexing for Kohonen’a mapping. The training time refers to 2500 iterations of Kohonen’s mappmg on 14 by 14 output nodes, doneon a convex
machine.
Figure 3 gives the three visual displays of SIGIR proceedings 1990-1993, based on the three different types of indexing, and Table 1 gives the descriptive data of applying the three types of indexing procedures to generate the GTOC display. An immediate question is how to compare these displays? Even though they are visual representations for the same document set, they are certainly different “views.” On one hand, because different measurements are applied, we shouldn't expect the displays would look the same. On the other hand, because the three indexing methods all generate representations of the same document set, we should expect to see similar patterns of term relationships or document relationships. Two approaches are currently taken to compare these displays, one is a visual inspection to examine patterns of terms and documents, the other is an experimental study to test how the displays help users find documents. The visual inspection was done through interaction with all the displays. It is difficult to describe similarities and differences of these displays in snapshots such as those shown in Figure 1 and 2. However, once we interact with the displays, using the sliders and the popup windows, the following trends seem to be cleac 1) Words always used together in this collection, such as “relevance feedback” and “minimum perfect hash (functions),” are always mapped together (note that all the indexing procedures are based on individual words). 2) Words often used together, such as “interface design” and “full text,” are always mapped closely nearby (not together sometimes, because words such as are also used in some other “design” and “text” contents). 3) Semantically related words, such as “explorations” and “visualization,” or “terms” and “phases,” are often mapped nearby or within the same neighborhood, even though they may not be used together. 4) Local neighborhood relationships seem to reflect semantic relationships reasonably well (judged by the document contents) in all the three displays, but the overall layouts of the displays are all different. 5) When same words are clicked on the three displays, titles shown in the popup windows sre similar, but not the same (typically, the first few titles are the same and thev contain the clicked words). 0) “’ The inverse d~cument frequencies “punish” the highfrequency words, making the visual displays less “visually intuitive” (in terms of large areas for and small areas for lesshigh-frequency words, frequency words). the number of indexing terms increases 7) When significantly (as in the third display), all the areas become small and similar in size, which makes it difficult to spot terms visually.
These observations are useful guidelines for the design of GTOC prototype. Observations number 1, 2, 3 and 5 establish some validity of the displays, or create certain “trusts” that users can rely upon what they see for what they are looking for. Number 4 cautions that general overviews of a document collection may be represented in many different ways graphically, each perhaps with certain “distortions. ” Number 6 to 8 questions if the inverse document frequency or fulltext indexing is useful for visualization of document collections, in the particular situation we defined. Based on these observations, we hypothesized that TFindexing would be the best format for the GTOC prototype. The one shown in Figure 1 is based on this format. To test this hypothesis, an experiment was designed to compare three versions of GTOC (lT-based, TF-based, and FF-based) and the original table of contents copied from the proceedings. Currently we are collecting and analyzing data for this experiment. 5.2 Document visualization The other major
mapping
and
document
factor that affects the views and functions of GTOC is how documents are mapped to the visual display. Document mapping is to connect “views” of the display to its underlying documents. Typical tools used for document mapping are those used for exploratory data analysis, both traditional statistical approaches (Siedlecki, 1988), and artificial neural networks approaches (Mao & Jain, 1995). While there are many similarities between mapping numerical data and mapping documents, their differences deserve a special attention because of unique features of the First, the document space is often highdocument space. dimensional, but vectors used to represent the documents are generally sparse. Second, the document space is also “feature-less” in the senses that the dimension itself is defined artificially during the indexing process. Finally, clustering or organizing the numerical representation of documents itself may not be the final goal of document Rather, the goal will be to extract semantic mapping. relationships of documents and to provide enough data and to ailow people to visualize document semantic “views” relationships. Thus, a good mapping procedure will need to (1) preserve the inherent structure of documents as well as pos~ible while projecting the high-dimensional document space to a two-dimensional display, (2) abstract features and determine how to ,qroup documents on the visual display, (3) group similar do&ments into clusters or neighborhood structures, (4) visually identify clusters, neighborhoods and individual documents and their relationships, and (5) provide data for implementation of interactive tools for dynamic views of the document space. During the design of GTOC prototype, many different These algorithms include algorithms have been tested. hierarchical clusters, Sammon’s nonlinear mapping (Sammon, 1969), Principal Component Analysis (PCA) (Friedman & Tukey, 1974), and Kohonen’s self-organizing
50
‘
association trm
Ii braru electronic I
exi ng com pressian ex
Pl0ratl“Ons hypertext
(a)
co replete
Indexed by title words only, using binary representation
ext
model probabili
stic
document ‘sqstems i ntcrface
rel evan Ce feedbac k
structuring
al gc.rithms rrrocess
inference
queries
I
i nteracttondocument Bva n“ce ?6MCk
1
I
1
I
I
I essons
r--l%l
met hod new9
(b) Indexed by title words, using their occurrences in titles, keywords and abstracts to compute within document frequencies.
-1’3! +----1
‘yStems
I
probabilt’$tic
m-- u Jrl’tr”ct”ringD I i “ierei.e
r 1 a
H
model oriented
linguistic
full
--/ :cess ml ..Ill.....
file sgnature
text automatic
I Semantic
investigation mariai
I moppl nq examples
logic
free network$ i ofere nce
projects
(c) Indexed by every word from titles, keywords, and abstracts, using both within and inverse document frequencies.
associati0n3 measure
codl ng
l-i -vector
feedback relevance
automatic
space
11
t hcseur us cl assi fi cation 0 ri e ntati 0 n
architect
are
I Ii nguistic t heory extend
visualization lessons
interface
FIGURE 3. Comparison of three visual displays for the same document set based on different types of indexing.
japanese
hete roge neous
browsing file paralle;
b}tmaps full
signature
compression dUnaMTC
cluster
probabilistic
51
Comparing to other feature map (Kohonen, 1989). algorithms, Kohonen’s mapping shows some advantages mainly due to its output form. The result of Kohonen’s mapping is a trained, or organized, network. This network can be used to map documents (its original input) to the display. It can also used to map words to the display so these words can serve as labels on the display. Furthermore, the trained network can be used to map other documents not in the original input. For example, The map display in figure 1 is trained by documents in SIGIR proceedings 19861993. However, documents in SIGIR’94 can still be mapped to the display by the trained network. This advantage becomes even more clear during interface design since, in the trained network, there are very rich information on which interactive tools can be built. Recently, many research projects have been focused on implementing traditional mapping algorithms, such as PCA and Sammon’s nonlinear mapping, using network architectures (Mao & Jain, 1995). A major motivation of these research projects is to have organized network outputs for those mapping algorithms. We can expect that these new techniques can be used to implement GTOCS like Kohonen’a mapping is used in this research.
5.3 Functionality of GTOC GTOC should provide functions of the table of contents. Moreover, in the digital environment, GTOC may also provide functions that are difficult or impossible in the printed environment. The graphical view of contents of several books or proceedings, the dynamic links of keywords, titles and articles, and the interactive tools of GTOC, are such examples. They not only help to provide basic functions of the table of contents, but also extend the functions to allow easy access in the digital environment.
6.
CONCLUSIONS
Many concepts of digital libraries will likely correspond to related concepts in traditional libraries. In the meantime, new concepts often extend the traditional concepts to a complete new level. What the online catalog offers now has exceeded well beyond what is available in the card catalog (although one may argue that something is lost, too). Similarly, the table of contents for “digital books” must include functionality of the (traditional) table of contents as well as new functions that are only available in the digital environment. Research described in this article is to search for such a table of contents and to explore how to construct and extend the table of contents to the digital environment. The proposed GTOC seeks to visualize document contents and relationships to allow easy access of underlying documents. It is based on three procedures -- indexing, mapping, and interactive design. Each of these procedures needs to be studied extensively since each will have a significant impact on the functionality of GTOC. The GTOC prototype described in this paper will serve both as a framework to study all the three procedures and as an experimental tool to conduct user testing on whether the proposed GTOC would function as a table of contents in the digital environment.
ACKNOWLEDGMENTS This research is funded by OCLC LISRGP
Grant, 1995. The indexing procedure used in the GTOC prototype is modified from PRISE source codes, kindly provided by Donna Harman.
REFERENCES Arents,
There are many more functions of GTOC need to be explored. For example, with the trained network, assistance to searching or browsing of individual words can be easily implemented. In figure 1(b), 220 words used to index the collection are also listed alphabetically in a window. When the user clicks on a word in the window, the word will be flashing on the display at the location determined by the trained network. This function particularly helps the user to locate those “less emphasis” words which normally would not be shown on the display without showing too many words. There is also a “year” filter in this GTOC. When a year is selected, the distribution of that year’s documents will be shown on the display. Finally, there is always a “query” option. The user can type in a query in natural language. As long as the query ~-ntains at ‘least one of the words in the list, a unique location for that query will be identified (and flashed) on the display. The user thus can click on that location to explore documents related to that query. Functions described above are particularly associated with Which and how useful these the digital environment. functions are for the purposes of the table of contents needs to be studied empirically. For a fair comparison, we limited many of these functions in the experiment to compare the GTOC with the printed table of contents. In our next experiment, more functions of GTOC will be included and the retrieval tasks will also be more open, rather than just looking up titles as in the first experiment.
H. C.; & Bogaerts, W. (1993). Concept-based retrieval of hypermedia information: From term indexing to semantic hyperindexing. Information Processing
Arnheim,
& Management.
R. (1971).
Visual
29(3),
Thinking.
373-386.
Berkeley,
University of California Press. . Cochrane, P. A. (1985). Redesim of Catalogs for Imrxoved of Pauline Dillon,
Online
CA
and Indexes
Subiect Access: Selected Paoers
A. Cochrane.
Phoenix,
Arizona:
Oryx
Press. M.; & Wenzel, P. (1990). Retrieval effectiveness enhanced bibliographic records. Librarv Hi Tech,
of
f3(3), 43-46. Doyle,
L. B. (1961). Semantic road maps for literature searcher. Journal of the Association for Comuuting Machiner v, Q(4), 553-578.
Fairchild, K M., Poltrock, S. E., & Furnas, G. W. (1988). SemNet: Three-dimensional graphic representations of large knowledge bases. In R. Guindon (Ed.), Comitive Science and its Aoriications for HumanComrmter Interaction (pp. 201-233). Hillsdale, NJ: Fowler,
Eribaum. R. H., Fowler, W. A., & Wilson, B. A. (1991). Integrating query, thesaurus, and documents through common visual representation. Proceeding of the SIGIR’91.
(pp. 142-151).
New York
ACM
Press.
Friedman, J. H. & Tukey, J. W. (1974). A projection algorithm for exploratory data analysis. ~ Transactions
52
on Comouters.
C-23, 881-890.
a
pursuit
Juhasz, S. et al. (1973).
TOC
p rimar v iournals multilinmral
Table of contents
-- recommendations
and international
ED075042). Kohonen, T. (1989).
iournals.
Self-organization
mactices
of
Markey,
for monolimzual (ERIC
and associate
book use bv academic
Proceedirws
of SIGIR’91.
ACM Press. Machovec, G. S. (1994). document delivery and Microcommrters
Salton,
(pp. 262-269).
bv commrter.
H3(5),
A selfretrieval.
libraries.
D. (1988).
Nonfiction
users. Dublin,
OH:
text urocessinc:
analvsis. Reading,
and retrieval MA
The of information
Addison-Wesley.
A nonIinear mapping for data IEEE Transactions on Comrmters,
401-409.
Siedlecki, W.; Siedlecka, K,; & Sklansky, J. (1988). An overview of mapping techniques for exploratory pattern analysis. Pattern Recomition. 21(5), 411-
New York
429. Van Orden, R. (1990). Cmtent-enriched access to electronic information: Summaries of selected research. Librarv Hi Tech. 8(3), 27-32.
1-5.
Maoj J.; & Jain, A K. (1995). Artificial Neural Networka for feature extraction and multivarariate data projection. IEEE Transactions on Neural Networks. 6(2),
Iibrarv
Automatic
Sammon, J. W. (1969). structure analysis.
Key elements in an advanced and ILL system. Online Libraries Q(l),
71. G. (1989). transformation.
(Columbus,
Ohio, October, 1993), pp. 147-164. Lin, X., Soergel, D., &Marchionini, G. (1991). organizing semantic map for information
Results of survevs
in several
OCLC Office of Research. Robertson, G. G., Card, S. K, & Mackinlay, J. D. (1993). Information visualization using 3D interactive animation. Communications of the ACM, 36(4), 57-
21-23, 1992), pp. 274-281. Lin, X.; Marchionini, G.; &Soergel, D. (1993). Categorybased and association-based mapdisplays by human subject. In: Proceedin~s of the4th ASIS Workshop
catalog use:
Prabha, C.; Rice, D.; & Cameron,
1995. Lin, X. (1992). Visualization for the document space. Proceeding of Visualization’92, (Boston, October
Research
Online
Dublin, OH: OCLC Office of Research. Miller, G. A. (1968). Psychology and information. American Documentation, 19, 286-269.
~.(3rded.). New Yor~ Springer-Verlag. Lin, X.(1995). Searching and browsing on map displays. Proceedings of ASIS annual Meetirws, Oct. 9-12,
Classification
K (1983).
and focus mou~ interviews
Veith,
R. H. (1988).
Visual
information
power of izrauhics and video.
296-317.
& CQ.
53
svstems:
Boston, MA
The G. K Hall