[12], sweeps and steels that have traditionally been con- structed using conic curve ..... tom: Horse (3K faces), 20 ellipsoids, 120 iterations. region as mentioned ...
Extraction and remeshing of ellipsoidal representations from mesh data Patricio D. Simari
Karan Singh
Dynamic Graphics Project Department of Computer Science University of Toronto
Abstract Dense 3D polygon meshes are now a pervasive product of various modelling and scanning processes that need to be subsequently processed and structured appropriately for various applications. In this paper we address the restructuring of dense polygon meshes using their segmentation based on a number of ellipsoidal regions. We present a simple segmentation algorithm where connected components of a mesh are fit to ellipsoidal surface regions. The segmentation of a mesh into a small number of ellipsoidal elements makes for a compact geometric representation and facilitates efficient geometric queries and transformations. We also contrast and compare two polygon remeshing techniques based on the ellipsoidal surfaces and the segmentation boundaries. Key words: Geometry representations, geometry processing, compression, ellipsoid, surface segmentation, kmeans clustering, polygon remeshing. 1
Introduction
Polygon meshes are currently the most widely used representation for 3D objects in Computer Graphics. Their popularity stems from their simplicity and flexibility to approximate any geometric shape as well as the ability of current graphics hardware to process and render a large number of polygons efficiently. Approximating a realistic 3D model can require up to several million faces, which state of the art hardware can render in real-time. Such dense polygon meshes are typically the result of scanning 3D physical data [9] or tessellations of geometric data with a different mathematical representation. These meshes often have elements of noise, holes, and other irregularities. Furthermore, the choice of vertex samples and their topological connectivity are largely an artifact of the construction process and the shape may benefit from geometric restructuring. The geometric processing and storage of dense meshes is also expensive and approaches to mesh decimation, compression and progressive restructuring [4, 8] is also a much studied subject. One important observation we make here is that while some of these problems can be isolated and solved, all
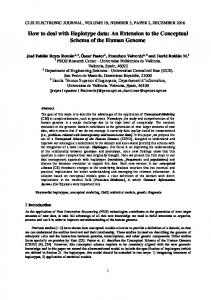
Figure 1: Ellipsoidal surface regions are ideal for modelling curved surfaces often found in organic objects. Left: The original triangulated mesh representing a hand using 5k faces. Centre: A decimated version using 180 faces. Right: An ellipsoidal approximation using 18 primitives and their boundaries.
data processing potentially modifies the shape suggested by the original mesh data. It is thus preferable for mesh processing algorithms to acknowledge the irregularities of dense meshes and handle data in its original form. The main goal of this paper is to explore the potential of approximating the surface of a dense mesh using a relatively small number of ellipsoidal regions. Such an approximation allows us to address a number of issues related to mesh processing including geometric queries, transformations, efficient rendering and compact representation.
1.1
Motivation and background
This paper is motivated by the fact that most organic objects and many manufactured objects have large curved areas. Industrial designers working in physical media often use characteristically shaped tools like French curves [12], sweeps and steels that have traditionally been constructed using conic curve and quadric surface sections. In this paper we consider the ellipsoid as a representative quadric with which to approximate 3D objects. Ellipsoids have certain advantages over planes as an approximation primitive. The processing of various common geometric queries such as normal, curvature, proximity and intersection with a ray for an ellipsoid is analytic and equally efficient for ellipsoids as for planes. For curved regions not only are far fewer ellipsoids required for approximation but they have the potential of capturing local shape curvature precisely. In areas where the surface of interest is flat, a region from an ellipsoid with sufficiently large radii can be used. Figure 1 compares the visual results of modelling a hand decimated 1 using planar faces and an approximation of superior visual quality using an order of magnitude fewer ellipsoids. Ellipsoids, unlike planes, being closed surfaces, are also capable of providing information about the volume of closed objects. Our algorithm also allows for ellipsoidal fitting that spans from being surface oriented, where a number of ellipsoidal surface regions approximate the surface as best possible, to volume oriented, where the same number of ellipsoids are used to capture the overall volume enclosed by an object. In this case, we use the entire ellipsoid and not just regions of its surface. The argument for not using primitives constructed with cubic or higher degree polynomials is one of marginal gains in terms of their ability to approximate curved geometry better than quadrics and that evaluation of various geometric queries on higher order primitives is not as efficient. One disadvantage of ellipsoids that we recognize is that they do not capture saddles or regions where the principal curvatures are convex and concave. We note, however, that human perception typically segments shape along such concave boundaries. The inability of the ellipsoid to capture the local curvature of such a shape fragment automatically favours segmentation along such boundaries. Once a shape has been segmented into an ellipsoidal approximation, it is only necessary to store the ellipsoids and the segmentation boundaries at which they meet in order to represent the object. We will present and contrast two schemes for remeshing from such a representation. 1 We
apply GSI’s decimation which uses a variant of the MAPS algorithm [8].
Related work Although there have been many greedy techniques for dense mesh simplification, Hoppe et al. [5] present an optimization-oriented approach. They introduce an energy function that models the desire for small meshes as well as fidelity of representation. By adjusting the weight of these two opposing goals, it is possible to choose how much simplification versus fidelity to the original mesh is desired. In [7], Katz et al. propose a mesh segmentation scheme based on fuzzy clustering of mesh faces. Their goal was to obtain a segmentation of connected mesh regions that represented meaningful components. In their approach however, once the segmentation is obtained, there is no simplification of the representation of segments. Recently, Cohen-Steiner et al. [3] have introduced the application of k-means style clustering of mesh faces into connected planar regions. Using this segmentation, they propose a remeshing scheme in which each region is simplified into a plane. This results in a compact representation that places the planar elements optimally with respect to the original mesh. Curved regions, however, still require many such planes in order to be well approximated. In [1], Bischoff et al. propose a representation for 3D models based on ellipsoids. However, a relatively large number of primitives is used and they retain the entire ellipsoidal surface. Their motivation for their variant of the ellipsoid decomposition is the robust transmission of geometric objects. It represents a coarse approximation which is then increasingly refined by the transmission of the mesh’s original vertices. Pentland, in [11], used superquadrics as geometric primitives for representing 3D objects. The fitting of superquadrics to range data has been well studied [13, 6]. In these cases however, the motivation was not simply that of a compact representation, but the visual recognition of different objects based on this segmentation. 2 Error metric for ellipsoidal surface regions Let us assume we have a triangular mesh surface region R which is a set of mesh faces, that we are approximating with an ellipsoidal primitive P . We wish to know how well P approximates said region. In other words, we would like to define an error function E(R, P ). We begin by considering the distance between a given vertex vi and an ellipsoid P . There are several distance metrics that one may consider when defining the error function. One such function is Euclidean distance. In the case of ellipsoids, it is simpler to compute the radial distance from a point to its surface. Euclidean distance: We defined Euclidean distance
from a vertex vi to ellipsoid P , as the Euclidean distance from vertex vi to its radial projection on ellipsoid P , denoted ΠP (vi ). Eeuc (vi , P ) = kvi − ΠP (vi )k2 The vertex vi will often have associated a vector ni indicating the surface normal at said vertex. It may be desirable for our ellipsoidal primitive to approximate these surface normals as well. Thus, we introduce an angular distance. Angular distance: The angular distance between vertex vi and ellipsoid P is a measure of the angle between the vertex normal at vi , denoted ni , and the ellipsoidal surface normal at the radial projection of vi on ellipsoid P , denoted nP (vi ). We define said angular distance as Eang (vi , P ) = kni − nP (vi )k2 Finally, given a surface mesh, it is possible to approximate curvature values given for the data. In our case we use a mean curvature estimate for meshes presented in [10]. As in the case of the vertex normals, it may be desirable for the ellipsoidal surfaces to approximate these values as well. For this purpose, we introduce the curvature distance metric. Curvature distance: The curvature distance between vertex vi and ellipsoid P measures how well the P follows mesh curvature at said vertex. We define the curvature distance between vi and ellipsoid P as the magnitude of the difference between the estimated mean curvature at vi , denoted Hi , and the mean curvature on the ellipsoid at the radial projection of vi , denoted HP (vi ). Ecur (vi , P ) = (Hi − HP (vi ))2 An argument against using Gaussian curvature is that it would always be positive, even when considering the inner surface (see negative ellipsoids below.) At a saddle point in the data, the Gaussian curvature is negative, while the mean curvature is zero. Our metric models the fact that a “flat” ellipsoid (with mean curvature close to zero at the point of interest by virtue of very large radii) could approximate this small region. Composite distance: Now, we can compose these error metrics into a single value for vi and P by taking a weighted sum E(vi , P ) = αEeuc (vi , P )+βEang (vi , P )+γEcur (vi , P ) The values of α, β, and γ indicate the relative importance that we place on each of the individual error metrics. Given a triangular mesh face fj = (v1 , v2 , v3 ), we define its distance to the ellipsoid P as follows X E(fj , P ) = E(vi , P ) i
Figure 2: Without negative ellipsoids positive curvature is captured by one ellipsoid, but the negative curvature region is approximated by the seven remaining. With negative ellipsoids one ellipsoid is sufficient for each region. Now, given a mesh surface region R = {f1 , . . . , fn }, we define the fitting error of P with respect to region R as the sum of errors for each face fi to P . X E(R, P ) = E(fi , P ) i
If the mesh is partitioned into n regions R1 , . . . , Rn , each approximated by an ellipsoid P1 , . . . , Pn , the error of the approximation is defined as the sum of errors at each region. X E({R1 , . . . , Rn }, {P1 , . . . , Pn }) = E(Ri , Pi ) i
We should note that there can be additions and variations to these definitions. For example, when calculating the error for a region, each face’s error can be weighted by the face’s area, thus indicating that larger faces are more important. A typical value for α in our case is α = 1/a2 where a is the mesh’s average edge length. This helps normalize the weight of the Euclidean metric for mesh’s sampled at different resolutions. In the case of β and γ, they are not dependent on mesh scale 2 . We tried different weights and found settings of 1.2 and 5 × 10⁻⁴ , respectively, to work well. Negative ellipsoids When modelling surfaces using ellipsoidal surface sections we are not able to capture bowl-shaped concavities, i.e. regions of negative curvature, if we consider only the ellipsoid’s outer surface. In order to be able to capture these types of regions while still using the same type of primitive we introduce the notion of a negative ellipsoid. In essence, a negative ellipsoid has the same shape as a regular ellipsoid, except that we consider its inner surface when measuring angular distance between normals 2 The
eas
curvature estimate we use [10] normalizes for varying face ar-
and curvature. Thus, we extend the relevant previous definitions as follows: � kni − nP (vi )k2 if P is pos. Eang (vi , P ) = kni + nP (vi )k2 if P is neg. � (Hi − HP (vi ))2 , if P is pos. Ecur (vi , P ) = (Hi + HP (vi ))2 , if P is neg. In essence, we are simply considering the negative ellipsoid to have its surface normals pointing inward and its mean curvature to be the compliment of the mean curvature defined on the outer surface. Figure 2 illustrates the effect of negative ellipsoids to surface segmentation. 3 Error metric for ellipsoid volume We mentioned earlier that ellipsoids could also be used to represent a region by approximating not only its shape, but also its volume. Here we introduce an error metric to be used when this is intended. 4 ˆ Evol (R, P ) = αEeuc (R, P ) + δ(V(R) − πabc)2 3 ˆ where a,b, and c are the radii of of P , V(R) is the approximate volume englobed by mesh region R, and δ is a weight determining the relative importance of approximating volume versus fitting the data points to the ellipsoid’s surface. A typical weight for δ in our case is δ = 105 /Vˆ 2 , where Vˆ is the approximate volume of the entire mesh. The denominator ensures that the volume penalty term is normalized for meshes of different volumes, while the numerator’s large magnitude shows a preference for approximating each region’s volume over fitting the points individually. Figure 3 illustrates the relevance of the volume penalty weight δ. The mesh is that of a semi-cylindrical section. Initially, the fitting of the ellipsoid using the volume metric with a high δ value approximates the volume enclosed by the convex hull of the section. As we decrease the relative magnitude of δ in the error metric, the ellipsoid fitting transitions from approximating volume, to approximating surface. 4 Ellipsoidal segmentation Our segmentation approach is an extension of Lloyd’s algorithm. Starting with an initial classification, the algorithm alternates between a fitting step, and a classification step. In the fitting step, we update each Pi with the ellipsoid that minimizes E(Ri , Pi ). In the classification step, the regions Ri are re-computed, assigning each face fj of the mesh to the region that minimizes E(fj , Pi ) while also under the constraint that the regions must remain connected. To this purpose we implement the priority queue region flooding scheme found in [3], inserting
Figure 3: As we decrease the relative magnitude of δ in the volume fitting error metric, the ellipsoid fitting transitions from approximating volume, to approximating surface. a. δ = 1010 /Vˆ 2 , b. δ = 105 /Vˆ 2 , c. δ = 102 /Vˆ 2 , d. δ = 0. faces to the queue based on their error to their associated ellipsoid. We also implement the region teleportation scheme to avoid local minima. The reader is referred to the publication for greater details. Ellipsoid fitting We parameterize ellipsoid primitives as tuple of nine scalars, three to represent the ellipsoids centre, three to indicate the length of each radius, and three to indicate its alignment. When considering negative ellipsoids in the case of surface segmentation, we also store if the ellipsoid is positive or negative. For each mesh region Ri of the current segmentation, we find the Pi that minimizes E(Ri , Pi ). Given that the sign value is discrete, we first minimize fixing the sign to be positive, then fixing it to be negative, and keep the result with lowest error. The minimization requires an initial estimate of the parameters. We estimate the ellipsoid’s centre as the geometric centroid of the vertices of the current region. In order to estimate the alignment and radii, we perform a singular value decomposition of the regions vertices, centring their mean at the origin. The resulting eigenvectors estimate the regions orientation and the eigenvalues allow us to estimate the radii. Termination: The algorithm terminates when the desired number of iterations have been performed, reporting the segmentation with least error found. Should the algorithm converge to a local minimum, it may continue its search for a better segmentation simply by teleporting a
Figure 5: Venus (5K faces). Top left: original mesh, front and back views. Right: obtained ellipsoidal representation with smoothed boundaries, 12 ellipsoids, 394 unique boundary vertices, 100 iterations. Bottom left: error over iterations. Our reclassification flooding scheme and region teleportation can sometimes increase the error. After several iterations however, the algorithm stabilizes on a minimum.
Figure 4: Examples of volume segmentation. Top: Bunny (3K faces), 8 ellipsoids, 50 iterations. Centre: Dinopet (6K faces), 22 ellipsoids, 100 iterations. Bottom: Horse (3K faces), 20 ellipsoids, 120 iterations. region as mentioned above. Figure 4 shows examples of volume segmentation. In these cases, we set a high volume error weight δ. This ensures that volume is approximated as closely as possible and only then is the placement of the ellipsoid modified to fit the surface. For our volume approximation Vˆ of each mesh segment we use the volume of the convex hull. The top of figure 8 shows the results of surface segmentation. Here the actual ellipsoid’s volume is not considered and only the fit to the surface is taken into account. Figures 1 and 5 show extracted ellipsoidal representations. 4.1 Smoothing segmentation boundaries Once we have obtained an ellipsoidal segmentation, the segmentation boundaries are given by edges whose two adjacent faces have been assigned to different regions.
Smoothing of these segmentation boundaries may be desired. To achieve this, we perform a constrained relaxation of the boundary vertices. For each boundary point p, we consider its boundary neighbours as well as its radial projection to all associated ellipsoids. Then we take the centroid of these associated points q and update p ← (1 − �)p + �q, for some small �. After a number of iterations, the result is points which lie along the appropriate ellipsoidal intersections and tend to be evenly spaced along the boundary. Figures 1 and 5 show smoothed segmentation boundaries in the rendered ellipsoidal representations. 4.2 Impact of different metrics Each of the components of the surface fitting metric incrementally allows for a better fit of the ellipsoidal surface to the mesh region. This is illustrated in figure 6. Initially, we start out by using only the Euclidean distance, setting β and γ to 0. Then we run the segmentation for ten iterations and arrive at the segmentation at the top of figure 6. To the right, we see the original mesh coloured according to segments, and to the left we show the resulting ellipsoids. Notice that since we are fitting surfaces, we are only interested in the ellipsoidal surface region near the mesh data. The ellipsoid is free to grow as large as needed to fit the mesh segment since only a
Figure 6: Mesh surface segmentations resulting from different settings of weight values for the composite distance metric Top: only Euclidian distance is used, setting other weights to zero. Centre: Euclidean and angular distances are used in error metric. Bottom: mean curvature is incorporated to the error metric along with Euclidean and angular distance. region of its surface will be kept for the final representation. Using only Euclidean distance does not suffice for a good surface fit. This is particularly noticeable in the region of the bill. Next, we incorporate angular distance into the metric. Now, once again, we run the segmentation for ten iterations and arrive at the segmentation at the centre of figure 6. The resulting segmentation follows the surface much more closely. However, we can still see that the fitting is not as good as it could be. The tail is much flatter, and the ellipsoid at the bill is not following closely as it approaches the head. Finally, we incorporate mean curvature and use all three metrics. This provides more information to disambiguate the ellipsoid fitting and can be appreciated at the bottom of figure 6, in which the ellipsoidal surfaces follow the mesh almost perfectly. 5
Remeshing of ellipsoidal representations
Given our ellipsoidal representation of a surface, it may be desired to reconstruct a mesh for use in applications that will not handle this representation directly. To his effect we introduce two remeshing schemes. First, we explain how to use the boundary regions of an ellipsoidal surface. 5.1 Using ellipsoidal region boundaries Different applications will require that it be determined if a given point on an ellipsoid lies within its region bound-
aries. For example, if we are casting a ray at an object represented as a union of ellipsoidal regions, it is easy to determine if said ray intersects an ellipsoid. However, it intersects the object only if the intersection point lies with the region’s boundaries on the ellipsoid. This problem will also arise when we address remeshing below. If we have a planar polygon, it is easy to determine if a given point lies inside or outside said polygon. In our case, however, the polygon lies on the surface of an ellipsoid. We reduce the problem of determining if a point on an ellipsoid is within the boundaries to that of a planar polygon through the use of stereographic projection. In our representation, for each ellipsoid we have a set of boundary regions described as a series of cycles of boundary vertices. For every ellipsoid, there is a transformation which maps it to the unit sphere. If we have a point on the ellipsoid’s surface, we simply transform the point with said transformation along with all boundaries so the point and boundaries lie on the unit sphere. Now, we take a stereographic projection of the point and boundaries. The original point is within the region of interest if and only if the projected point lies within the polygon determined by the outer boundary’s projection and outside that of all hole boundaries. In our case we use the following stereographic projection, which maps point (x, y, z) on the unit sphere to (xp , yp ) on the XY plane: xp = 2x/(1 − z); yp = 2y/(1 − z) Note that the sphere’s north pole is mapped to infinity. However, since clearly no region will use the entire sphere, we can simply find a rotation that places the region of interest as close to the south pole of the sphere as possible, while not including the north pole. This rotation is then used after transforming to the unit sphere and prior to projecting. An illustration of the stereographic projection of a region is shown at the top of figure 7. For illustrative purposes, the unit sphere is centred at (0, 0, 1) so that the projection can be better viewed. 5.2
Remeshing with parametric tessellation of surfaces One way in which we may obtain a mesh from our ellipsoid representation is by generating for each region a parametric tessellation. In our implementation we go about this as follows. For each region, we generate points on the unit sphere. This is easily done by generating points in regular intervals of azimuth and elevation. Next, we consider the stereographic projection of these points along with the relevant boundaries, having mapped these to the unit
Figure 7: Tessellation of an ellipsoidal surface region. Top: Generated points on the unit sphere are stereographically projected along with segmentation boundaries. Bottom: Points outside of boundaries are discarded and the remaining points are triangulated.
sphere as described above. This is illustrated at the top of figure 7. We keep the points that respect the boundaries, and then perform a constrained Delaunay triangulation on projected points respective to the boundaries. Note that in stereographic projections, circles on the sphere’s surface are mapped to circles on the plane, so a Delaunay triangulation on the projected points corresponds to a Delaunay triangulation on the sphere’s surface. Then through the transformation to ellipsoid space, the anisotropic nature of the surface is captured in the triangulation. To achieve the triangulation, we begin with a triangulation of the boundaries, and then iteratively add each point to the triangulation. For each one, we find the face in which it lies, insert it, resulting in the face being split into three triangles, and then perform edge flipping in order to re-establish the Delaunay triangulation. Once this is done, the faces obtained directly translate to faces on the sphere’s surface, which can now be transformed into the ellipsoid region. The bottom of figure 7 illustrates the resulting triangulation of the surface region of interest. The centre of figure 8 shows meshes resulting from this approach. This scheme has some drawbacks. The uniform parametric sampling of the sphere to obtain the points results in the poles being much more densely sampled. This is clearly visible at the centre of figure 8. Also, it is hard to determine a priori how many points to use for each region. In our approach we used the same amount of points for each ellipsoid. As a result, vertices are not placed optimally.
Figure 8: Top: Ellipsoidal surface segmentation. Teddy (5K faces), 8 ellipsoids, 50 iterations, 130 unique boundary vertices. Hand (5K faces), 18 ellipsoids, 50 iterations, 463 unique boundary vertices. Centre: remeshing by parametric tessellation. Bottom: remeshing by iterative vertex addition using same total number of vertices. 5.3 Remeshing by iterative vertex addition In order to address the drawbacks of the previous approach we propose a different remeshing scheme which attempts to place vertices where they are most needed. Initially, we start out with a triangulation of only the region boundaries as described for the previous scheme. Now we iteratively add vertices as follows. Our candidates are the face centres of the current mesh. For each candidate we measure its radial distance to the relevant ellipsoid and choose the one that is farthest but is also far enough from the points already added according to some threshold value. This single point is projected onto the ellipsoid and then added using the same technique described for the previous scheme. Note that edge flipping will be constrained to the relevant ellipsoidal region, thus, boundary edges, which we consider feature edges [2], are not flipped. The bottom of figure 8 shows the results for this algorithm. We use the same total number of vertices as resulted from our other approach. In the results, it can be seen that regions of higher curvature are naturally as-
signed more vertices while regions of lower curvature imply less vertices, and thus larger faces. 6
Conclusions and future work
We have presented the idea of modelling a 3D object using a relatively small number of ellipsoidal surface regions, each represented by an ellipsoid and boundaries indicating where adjacent regions meet. This results in a compact representation which supports efficient geometric queries and transformations. In order to obtain the segmentation, we introduced metrics based on Euclidean radial distance, surface normals and surface curvature; all properties which are easily and efficiently computable for an ellipsoidal surface. Based on these metrics we use a simple segmentation algorithm based on a variant of k means clustering. Given that a triangulated mesh is sometimes desirable, we also presented two remeshing schemes which we compared. We showed that in the second scheme, vertices are placed intelligently, resulting in regions of higher curvature being densely sampled, while flatter regions are represented by larger faces in the resulting mesh. It should be noted that for highly dense meshes, the resulting segmentation boundaries may include many vertices. These boundaries are simply a sequence of points and can easily be simplified for a more compact representation. Also we could add another parameter to the ellipsoid representation in order to introduce bending (allowing for banana-shaped surfaces.) This could be useful both in volume and surface segmentations, in the latter case allowing the possibility of modelling saddle regions, with the trade off of decreasing the efficiency of geometric queries. References [1] S. Bischoff and L. Kobbelt. Ellipsoid decomposition of 3d-models. 3DPVT Proceedings, pages 480– 488, 2002. [2] S. Bischoff and L. Kobbelt. Towards robust transmission of geometric data. Computers & Graphics, 26(5):665–675, 2002. [3] David Cohen-Steiner, Pierre Alliez, and Mathieu Desbrun. Variational shape approximation. ACM Trans. Graph., 23(3):905–914, 2004. [4] Hugues Hoppe. Progressive meshes. Computer Graphics, 30(Annual Conference Series):99–108, 1996. [5] Hugues Hoppe, Tony DeRose, Tom Duchamp, John McDonald, and Werner Stuetzle. Mesh optimiza-
tion. In Proceedings of the 20th annual conference on Computer graphics and interactive techniques, pages 19–26. ACM Press, 1993. [6] Ales Jaklic, Ales Leonardis, and Franc Solina. Segmentation and recovery of superquadrics. Kluwer Academic Publishers, 2000. [7] S. Katz and A. Tal. Hierarchical mesh decomposition using fuzzy clustering and cuts. ACM Transactions on Graphics, 22(3):954–961, 2003. [8] Aaron W. F. Lee, Wim Sweldens, Peter Schr¨oder, Lawrence Cowsar, and David Dobkin. Maps: multiresolution adaptive parameterization of surfaces. In SIGGRAPH ’98: Proceedings of the 25th annual conference on Computer graphics and interactive techniques, pages 95–104. ACM Press, 1998. [9] Marc Levoy, Kari Pulli, Brian Curless, Szymon Rusinkiewicz, David Koller, Lucas Pereira, Matt Ginzton, Sean Anderson, James Davis, Jeremy Ginsberg, Jonathan Shade, and Duane Fulk. The digital michelangelo project: 3d scanning of large statues. In Proceedings of the 27th annual conference on Computer graphics and interactive techniques, pages 131–144. ACM Press/AddisonWesley Publishing Co., 2000. [10] Mark Meyer, Mathieu Desbrun, Peter Schr¨oder, and Alan H. Barr. Discrete differential-geometry operators for triangulated 2-manifolds. In Hans-Christian Hege and Konrad Polthier, editors, Visualization and Mathematics III, pages 35–57. Springer-Verlag, Heidelberg, 2003. [11] Alex P. Pentland. Perceptual organization and the representation of natural form. Artificial Intelligence., 28(3):293–331, 1986. [12] Karan Singh. Interactive curve design using digital french curves. In Proceedings of the 1999 symposium on Interactive 3D graphics, pages 23–30. ACM Press, 1999. [13] F. Solina and R. Bajcsy. Recovery of parametric models from range images: The case for superquadrics with global deformations. IEEE Trans. Pattern Anal. Mach. Intell., 12(2):131–147, 1990.