Accepted Manuscript Title: GraphVar: A user-friendly toolbox for comprehensive graph analyses of functional brain connectivity Author: J.D. Kruschwitz D. List L. Waller M. Rubinov H. Walter PII: DOI: Reference:
S0165-0270(15)00073-4 http://dx.doi.org/doi:10.1016/j.jneumeth.2015.02.021 NSM 7163
To appear in:
Journal of Neuroscience Methods
Received date: Revised date: Accepted date:
8-12-2014 28-1-2015 19-2-2015
Please cite this article as: Kruschwitz JD, List D, Waller L, Rubinov M, Walter H, GraphVar: A user-friendly toolbox for comprehensive graph analyses of functional brain connectivity, Journal of Neuroscience Methods (2015), http://dx.doi.org/10.1016/j.jneumeth.2015.02.021 This is a PDF file of an unedited manuscript that has been accepted for publication. As a service to our customers we are providing this early version of the manuscript. The manuscript will undergo copyediting, typesetting, and review of the resulting proof before it is published in its final form. Please note that during the production process errors may be discovered which could affect the content, and all legal disclaimers that apply to the journal pertain.
GraphVar: A user-friendly toolbox for comprehensive graph analyses of
ip t
functional brain connectivity.
cr
Kruschwitz, J.D.* 1,2, List, D.* 1,2, Waller, L 1. Rubinov, M. 3, Walter, H 1.
1
us
*equal contribution
Charité – Universitätsmedizin Berlin, Division of Mind and Brain Research, Department of
an
Psychiatry and Psychotherapy, Berlin, Germany; 2Technische Universität Dresden, Institute of General
M
Psychology, Dresden, Germany ; 3University of Cambridge, Cambridge, United Kingdom
d
Correspondence concerning this article should be addressed to Johann D. Kruschwitz (e-mail:
te
[email protected]) or David List (e-mail:
[email protected]); Division of Mind and
Ac ce p
Brain Research, Department of Psychiatry and Psychotherapy, Charitéplatz 1, 10117 Berlin, Germany
This research was supported by the German Research Foundation (SFB940/1 2014 to Technische Universität Dresden).
1 Page 1 of 23
Abstract: Background: Graph theory provides a powerful and comprehensive formalism of global and local
ip t
topological network properties of complex structural or functional brain connectivity. Software packages such as the Brain-Connectivity-Toolbox have contributed to graph theory’s increasing
cr
popularity for characterization of brain networks. However, comparably comprehensive packages are
command-line based and require programming experience; this precludes their use by users without a
us
computational background, whose research would otherwise benefit from graph-theoretical methods.
an
New Method: “GraphVar” is a user-friendly GUI-based toolbox for comprehensive graph-theoretical analyses of brain connectivity, including network construction and characterization, statistical analysis
M
on network topological measures, network based statistics, and interactive exploration of results. Results: GraphVar provides a comprehensive collection of graph analysis routines for analyses of
d
functional brain connectivity in one single toolbox by combining features across multiple currently
te
available toolboxes, such as the Brain Connectivity Toolbox, the Graph Analysis Toolbox, and the Network Based Statistic Toolbox (BCT, Rubinov and Sporns 2010; GAT, Hosseini et al., 2012; NBS,
Ac ce p
Zalesky et al., 2010). GraphVar was developed under the GNU General Public License v3.0 and can be downloaded at www.rfmri.org/graphvar or www.nitrc.org/projects/graphvar. Comparison with existing methods: By combining together features across multiple toolboxes, GraphVar will allow comprehensive graph-theoretical analyses in one single toolbox without resorting to code.
Conclusions: GraphVar will make graph theoretical methods more accessible for a broader audience of neuroimaging researchers. Keywords: resting-state; graph theory, brain connectivity; network analysis; toolbox
2 Page 2 of 23
1. Introduction The connectivity of the brain can be described by defining brain networks, which comprise
ip t
regions of interests (“nodes”) and interregional structural or functional connections (“edges”). Graph theory, the mathematical study of networks, provides a powerful and comprehensive formalism of
cr
global and local topological network properties of complex structural or functional brain connectivity
us
(Bullmore and Sporns, 2009; Rubinov and Sporns, 2010). Application of graph theoretical measures to clinical populations has revealed differences in these properties in Alzheimer's disease (He et al., 2008
an
and Stam et al., 2007), attention-deficit hyperactivity disorder (Wang et al., 2009), multiple sclerosis (He et al., 2009), schizophrenia (Bassett et al., 2008, Liu et al., 2008 and Rubinov et al., 2009), pathological gambling (Tschernegg et al., 2013), heroin dependence (Liu et al., 2009) and other
M
neurological and psychiatric disorders. Apart from describing topological network properties, graph theory also provides a framework for identification of anatomically localized sub-networks associated
d
with particular effects of interest (such as candidate genotype group differences or correlations with
te
neuropsychological test scores) across the entire brain (Zalesky et al., 2010).
Ac ce p
Recently developed software packages such as the Brain Connectivity Toolbox (Rubinov and Sporns 2010) have contributed to graph theory’s increasing popularity for characterization of functional brain networks. However, most comparably comprehensive software packages are command-line based and require some programming experience. This may lead to time-consuming, complicated, and error prone operations for researchers without sufficient computational background, and place such analyses out of reach for scientists whose research would otherwise benefit from graph-theoretical analyses. The development of accessible software for such analyses represents an important and unmet need. Here we address this need by developing “GraphVar” (www.rfmri.org/GraphVar or www.nitrc.org/projects/graphvar), a user-friendly graphical-user-interface (GUI)-based toolbox for comprehensive graph-theoretical analyses of brain connectivity, including pipeline network 3 Page 3 of 23
construction and characterization, statistical analysis on network topological measures, network based statistics, and interactive exploration of results. By combining features across multiple currently available toolboxes, such as the Brain Connectivity Toolbox, the Graph Analysis Toolbox, and the Network Based Statistic Toolbox (BCT, Rubinov and Sporns 2010; GAT, Hosseini et al., 2012; NBS,
ip t
Zalesky et al., 2010), GraphVar represents a comprehensive collection of graph analysis routines for
cr
analyses of functional brain connectivity.
us
2. Methods – general overview of the toolbox
GraphVar is a GUI-based toolbox which runs in MATLAB (MathWorks, Inc.) but does not
an
require MATLAB programming experience. GraphVar contains most functions included in the Brain Connectivity Toolbox, but allows users to add custom functions which can subsequently be accessed via the GUI. GraphVar accepts correlation matrices as input (or any n x n matrix containing
M
information about connectivity among network nodes) but can also generate connectivity matrices from input time series. Users may also provide demographic, clinical and other subject specific data
d
(in spreadsheet format) for statistical analyses. GraphVar offers pipeline construction of graph
te
networks with a choice of none, relative, absolute, and significance-based thresholding. Additionally,
Ac ce p
GraphVar offers estimating binary graphs with predefined densities using sparse inverse covariance estimation (Huang et al., 2010), as well as the generation of subject specific “null-model networks and sub-network analyses”. Binary and weighted network topological measures can be easily calculated, normalized, exported, and used in statistical analyses. Statistical analyses include correlation and partial correlation analyses and group comparisons (t-test, ANOVA) on the network measures but also on the raw connectivity matrices (i.e., network based statistics including identification of graph components). Statistical tests can be performed in a parametric and non-parametric fashion (i.e., testing against null-model networks, non-parametric permutation testing). If Matlab´s parallel computing toolbox is installed, GraphVar can distribute several jobs to different CPU´s and thus speed up computation time. Figure 1a displays a schematic workflow of the toolbox, whereas 1b displays GraphVar´s setup interface.
4 Page 4 of 23
GraphVar offers an interactive viewer that allows intuitive exploration of statistical results, such as selection of significance levels, plotting of parametric and non-parametric derived p-values, plotting of group differences and correlations, selection of threshold ranges, selection of network nodes, plotting of null-model networks, and plotting of graph components. It also includes correction
ip t
methods for multiple comparisons, including Bonferroni correction and false discovery rate, which can be applied to parametrically and non-parametrically distributed measures. Results can easily be saved,
cr
reloaded, and exported. Figures 3-6 of this article show output of GraphVars results viewer.
us
More detailed information on the functions and procedures of the toolbox can be found in the subsequent paragraphs and also in the detailed manual accompanying GraphVar which includes usage
an
instructions and a description of all the implemented functions. GraphVar was developed under MATLAB 2011a.
M
3. Methods – description of functions and procedures of the toolbox
d
3.1 Data input
te
GraphVar accepts correlation matrices as input (or any n x n matrix containing information about connectivity among network nodes in .mat file format) but can also generate connectivity
Ac ce p
matrices based on pearson correlation, partial correlation, spearman correlation, percentage bend correlation or mutual information from input time series. Additionally, GraphVar allows computing covariance matrices from input time series that may be used in combination with the option of estimating binary graphs with predefined densities using sparse inverse covariance estimation (Huang et al., 2010). Along with the connectivity matrices GraphVar requires a parcellation scheme for the brain (e.g., the AAL atlas) thereby defining the nodes of the graph in spread sheet format (.csv or excel). GraphVar is not limited to a specific number of nodes. The user can define the brain parcellation scheme according to his or her requirements. GraphVar also provides statistical analyses functions on network topological measures and network based statistics. Thus, the user may also enter clinical and other subject specific data in spreadsheet format (.csv or excel) for subsequent analyses. 3.2 Computation of connectivity matrices from time series 5 Page 5 of 23
When generating connectivity matrices from input time series, GraphVar creates parametric pvalues and/or non-parametric p-values that are saved along with the connectivity matrix. After generating connectivity matrices from input time series, GraphVar conveniently loads the computed
ip t
connectivity matrices into the subject list in the setup interface. GraphVar moreover provides the option to create random time series. Specifically, random
cr
time series can be created in three ways: first, randomizing the observed time series by taking its Fourier transform, scrambling its phase and then inverting the transform (Prichard and Theiler, 1994;
us
Zalesky et al., 2012). Second, random time series can be created by picking a random time point from a randomly selected other nodal time course (i.e., time series) of the subject until the new random time
an
course consists of the equal number of elements as the original time courses (in this method previously used random time points are acceptable - i.e., sampling with replacement. Third, generation of time
M
courses consisting of random normal distributed numbers with the same mean and standard deviation as the reference time course. Randomized time series are subsequently used for non-parametric testing
d
of the connectivity strenght of any two nodes in the n x n matrix against a multiple iteration derived
te
distribution of connectivity strengths between random time series (pairwise null-model-distribution). This option allows to derive p-values (retrieved by placing the “original” connectivity value in the
Ac ce p
corresponding null-model distribution and determining its percentile position) for each connection in the connectivity matrix that can be used for thresholding of the network (i.e. to create the adjacency matrix) and/or for determining a threshold for subsequent network based statistics (i.e., statistics on the association matrices).
3.3 Network construction
GraphVar offers pipeline construction of graph networks with a choice of relative, absolute and significance-based thresholding (Rubinov and Sporns, 2010; van Wijk et al., 2010). Significancebased thresholding is based on non-parametric p-values that are derived during the creation of random time series (c.f. 2.2). Relative thresholding refers to thresholding of the association matrix in a proportional way (i.e., normalization by “wiring cost” – e.g., 0.1 indicates that 10% of the strongest connections will be maintained as links to derive the adjacency matrices). By selection of absolute 6 Page 6 of 23
thresholding, the association matrices are thresholded in an absolute fashion (i.e., the selected value indicates the correlation coefficient considered as the minimum to display a connection between two nodes – e.g. 0.2 indicates that everything below this threshold will not be considered as a link in the adjacency matrices). Moreover, GraphVar allows choosing “no thresholding”, which may be used in
ip t
combination with particular graph topological measures as e.g. modularity, global clustering, etc. Additionally to applying the aforementioned “more traditional” thresholding methods, GraphVar
cr
offers pipeline construction of binary graphs with predefined densities using sparse inverse covariance
us
estimation “SICE”, also known as Gaussian graphical models or graphical Lasso (Huang et al., 2010). This method imposes a “sparsity” constraint on the maximum likelihood estimation of an inverse
an
covariance matrix, which leads to reliable estimation of the inverse covariance matrix with small sample sizes (i.e., length of the fMRI time series). As compared to partial correlations this method
M
entails the advantage that for reliable estimations the sample size of the data does not need to be substantially larger than the number of nodes (i.e., brain regions) modeled in the network (i.e., the number of time points can be close to or even less than the number of brain regions modeled). This
te
d
feature is implemented using “Glasso” (http://statweb.stanford.edu/~tibs/glasso/). As many graph topological measures are influenced by the polarity (i.e., positive versus
Ac ce p
negative) of edge connection weights, GraphVar also offers to transform all weights to positive values, absolute values or to set all negative weights to zero. As many graph topological measures require positive edge connection weights, GraphVar informs the user at which thresholds negative weights may enter the calculations. By selecting specific nodes in the network construction panel, the user can easily conduct sub-network analyses without reloading any new data. Moreover, GraphVar allows creating binary or weighted subject specific null-model networks
(with the same settings as the original networks – i.e., threshold range, number of nodes) that can be used for normalization of the network topological measures and for non-parametric testing of the significance of correlations among network measures with other subject specific data (e.g., Rubinov and Sporns, 2010; van Wijk et al., 2010). The number of subject specific random networks to be created and the function used to generate such a network (i.e., BCT functions: randomizer_bin_und, 7 Page 7 of 23
randmio_und, randmio_und_connected, null_model_und_sign) depend on the input and selection of the user. Besides these functions the user may simply add custom functions which can subsequently be accessed via the GUI. For reliable and valid assumptions using null-model networks it is advisable to generate a high number of reference networks. Note, that the current version of the toolbox only
ip t
features construction (and analyses) of undirected networks.
cr
3.4 Network calculations
us
GraphVar contains most functions included in the Brain Connectivity Toolbox (Rubinov and Sporns, 2010) and enables the user to calculate, normalize and export (in .csv or excel file format)
an
binary and weighted network topological measures via selection of the respective function in the GUI (please refer to the supplementary material or the manual for a detailed description of the currently implemented functions). Moreover, the user may simply add custom functions for the characterization
M
of networks that can subsequently be accessed via the GUI. For more convenient use, GraphVar entails a mouse-over function and displays the definition of each graph metric when putting the mouse
d
cursor on the respective function. Normalization of the network topological measures is achieved by
te
division with the mean of the respective null-model derived graph topological measure.
Ac ce p
3.5 Statistical analyses with network topological measures GraphVar uses routines from MATLAB´s statistics toolbox. Thus, to perform statistical
analyses with network topological measures or the raw connectivity matrices, the statistics toolbox is required. However, no statistics toolbox is required for calculation and export of network topological measures (as this is based on the codes of the BCT). Correlation and partial correlation analyses GraphVar features computation of correlations between network topological measures and other subject specific data (e.g., clinical data). GraphVar offers selection between regular correlation analyses (pearson correlation) and a partial correlational analyses. As values of many network measures are greatly influenced by basic network characteristics (e.g., number of nodes and links, degree of distribution), the significance of network statistics should be established by comparison with 8 Page 8 of 23
statistics calculated on null-hypotheses distributions. For correlational analyses GraphVar offers two types of non-parametric testing: null-model testing on the network level (i.e. generating subject specific random networks that have simple random or ordered topologies but preserve basic
metric level (i.e., permutation testing; e.g. Hosseini et al., 2012)).
ip t
characteristics of the original network (Rubinov and Sporns, 2010), and null-model testing on the
cr
Specifically, GraphVar features non-parametric testing of the correlation strenght (r) between a network measure with any user defined subject variable (e.g., age) against the correlation between
us
the graph theoretical measure derived from the subject specific null-model network with the same subject variable. Based on the number of subject specific null-model networks a null-model
an
distribution of these “random” correlations is generated from which a non-parametric p-value for the “original” correlation is retrieved by placing the “original” correlation value in the corresponding null-
M
model distribution and determining its percentile position. Additionally to performing non-parametric testing on the network level (i.e., rewiring of connections in the network), GraphVar also provides
d
generation of null-distributions on the metric level when performing correlational analyses. In this
te
case the network resulting topological measures are randomly shuffled among individuals and the
Ac ce p
correlation procedure is performed repeadetly resulting in a non-parametric correlation distribution.
Group Comparison analyses
GraphVar features group comparisons with graph topological measures as the dependent
variable. The user can compute comparisons between 2 groups (i.e., two-sample t-test) or test for differences between more than two groups (i.e., ANOVA). As the significance of network statistics should be established by comparison with statistics calculated on null-hypothesis distributions, GraphVar features non-parametric permutation testing with a user defined amount of repetitions (similar as in the GAT toolbox; Hosseini et al., 2012). For permutation testing, in each repetition, the network measures of each subject are randomly reassigned to one of the groups so that each randomized group obtains the same number of subjects as the original groups. Then, the differences in 9 Page 9 of 23
network measures between randomized groups are calculated resulting in a permutation distribution of difference under the null hypothesis (for ANOVA also the F value deriving from each repetition is computed). The actual between-group difference in network measures (and for ANOVA also the F value) is then placed in the corresponding permutation distribution and a p-value is calculated based
ip t
on its percentile position.
cr
3.6 Network based statistics
us
Similar as the NBS toolbox (Zalesky et al., 2010), GraphVar enables the user to perform network based statistics (association matrix based statistics) by applying either correlational and/or
an
group comparison analyses. In network based statistics, the respective analysis is performed on each link between any two nodes in the n x n matrix. Thus, this feature is inherently a mass-univariate approach that examines the significance of each link with respect to the applied analysis. However, to
M
deal with the problem of alpha inflation (i.e., multiple comparison problem), GraphVar makes use of graph components (i.e., sub-networks in which all pairs of nodes are connected by significant links)
d
that are identified by the BCT “get_components” function. The measure of interest with regard to
te
graph components is their size (this is similar to a contiguous cluster of voxels in fMRI). To evaluate,
Ac ce p
whether a graph component with a certain size as a result of the respective analysis is non-random (i.e., significant), it is compared against the amount of occurrences of maximal component sizes of graph components in “random” data (please refer to the subsequent paragraph for how “random” data is generated in correlational or group comparison analyses). However, with the raw matrix function as implemented in GraphVar, it is also possible to examine correlations and/or group differences between a set of a-priori specified structures (e.g., correlation of age on insula-amygdala connectivity). GraphVar also features significance-based thresholding of the raw connectivity matrices and transformation of input correlations in z values by using Fisher´s r-to-z transformation. For correlational analyses on the raw matrices, GraphVar features two ways of generating “random” data. First, generation of subject specific association matrices that serve as random data (i.e., random shuffling of the correlation values in the association matrix while keeping the degree of positive and negative weights for the random networks the same as in the original network; or using 10 Page 10 of 23
the BCT function “null_model_und_sign”; the user can also add custom functions for null-model generation). Second, non-parametric permutation testing with random shuffling of subject ID´s to the pre-existing (to other subjects belonging) association matrices. For group comparisons on the raw matrix, GraphVar produces these “random data” by performing non-parametric permutation tests with
ip t
the subjects underlying connectivity values for the respective groups (as described under “Group comparison analyses). When performing statistical analyses on the raw matrix and testing against
cr
“random data”, GraphVar outputs parametric and non-parametric p-values for the statistical
us
association on each single link of the association matrix.
an
3.7 Results exploration
GraphVar offers an interactive viewer that allows intuitive exploration of statistical results (e.g., selection of significance level, plotting of parametric and non-parametric derived p-values,
M
plotting of group differences and correlations, selection of threshold ranges, selection of network nodes, plotting of null-model networks, plotting of graph components in GraphVar and direct export
d
into BrainNetViewer (Xia et al., 2013). It also entails correction methods for multiple comparisons,
te
including Bonferroni correction and false discovery rate that can be applied to parametric and non-
Ac ce p
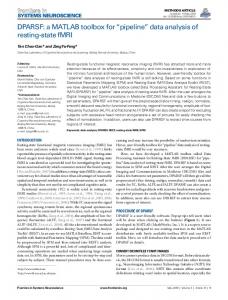
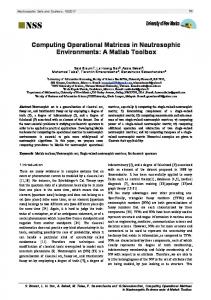
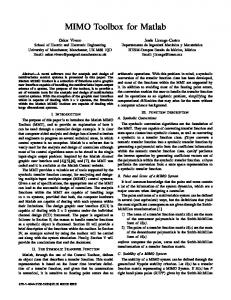
parametric derived results. Results can easily be saved, reloaded, and exported (in .csv or excel file format). Moreover, GraphVar´s results viewer allows inspection of individual connectivity matrices and the mean connectivity matrix across subjects (based on the association matrices). Figure 3 displays an example group comparison of characteristic path length across network
thresholds with non-parametric permutation testing as an output of GraphVars results viewer. Figure 4 displays example correlation testing with local clustering coefficient in 14 brain regions across network thresholds as an output of GraphVars results viewer. Figure 5 displays example results of a group comparison on differences in functional connectivity (FC) strength on the raw correlation matrices (association matrices) as an output of GraphVars results viewer. Figure 6 displays example output of GraphVars “network inspector” tool that may be used to identify graph components by applying network based statistics, as well as instant visualization of this graph component in BrainNetViewer (Xia et al., 2013) through GraphVar. 11 Page 11 of 23
ip t
4. Summary on GraphVar In this article we introduced “GraphVar” (www.rfmri.org/GraphVar), a user-friendly graphical-
cr
user-interface (GUI)-based toolbox for comprehensive graph-theoretical analyses of brain connectivity including pipeline network construction and characterization, statistical analysis on network
us
topological measures, network based statistics, and interactive exploration of results. We developed this toolbox with the aim of combining features across multiple currently available toolboxes, such as
an
the Brain Connectivity Toolbox, the Graph Analysis Toolbox, and the Network Based Statistic Toolbox (BCT, Rubinov and Sporns 2010; GAT, Hosseini et al., 2012; NBS, Zalesky et al., 2010) to
M
provide a comprehensive collection of graph analysis routines for analyses of functional brain connectivity in one single toolbox. Table 1 lists and compares global features of GraphVar with other
d
published neuroscience graph analysis toolboxes that are freely available for research.
te
With the development of GraphVar we intended to make graph theoretical analysis more available for a broader audience of neuroimaging researchers that were previously excluded from these methods
Ac ce p
due to lack of sufficient scripting and programming experience and whose research may benefit from graph-theoretical analyses. In its current form Graphvar focuses on presently more established methods of analyses. However, we strive to continuously develop and update GraphVar to potentially include upcoming and emerging analysis methods of connectivity. These future developments may include the possibility of using dynamic brain connectivity or machine learning based classification with graph topological measures. We developed GraphVar under the GNU General Public License v3.0 with the hope that GraphVar will experience further developments also due to the help and engagement of committed community members.
12 Page 12 of 23
References: Bullmore, E., Sporns, O., 2009. Complex brain networks: graph theoretical analysis of structural and functional systems. Nature Reviews Neuroscience 10, 186–198. doi:10.1038/nrn2575
Frontiers in Systems Neuroscience. doi:10.3389/fnsys.2010.00022
ip t
Fornito, 2010. Network scaling effects in graph analytic studies of human resting-state fMRI data.
cortical networks in Alzheimer’s disease. J. Neurosci. 28, 4756–4766.
us
doi:10.1523/JNEUROSCI.0141-08.2008
cr
He, Y., Chen, Z., Evans, A., 2008. Structural insights into aberrant topological patterns of large-scale
He, Y., Dagher, A., Chen, Z., Charil, A., Zijdenbos, A., Worsley, K., Evans, A., 2009. Impaired small-
an
world efficiency in structural cortical networks in multiple sclerosis associated with white matter lesion load. Brain 132, 3366–3379. doi:10.1093/brain/awp089
M
Huang, S., Li, J., Sun, L., Ye, J., Fleisher, A., Wu, T., Chen, K., Reiman, E., 2010. Learning brain connectivity of Alzheimer’s disease by sparse inverse covariance estimation. NeuroImage 50, 935– 949. doi:10.1016/j.neuroimage.2009.12.120
d
Liu, J., Liang, J., Qin, W., Tian, J., Yuan, K., Bai, L., Zhang, Y., Wang, W., Wang, Y., Li, Q., Zhao,
te
L., Lu, L., von Deneen, K.M., Liu, Y., Gold, M.S., 2009. Dysfunctional connectivity patterns in chronic heroin users: an fMRI study. Neurosci. Lett. 460, 72–77. doi:10.1016/j.neulet.2009.05.038
Ac ce p
Liu, Y., Liang, M., Zhou, Y., He, Y., Hao, Y., Song, M., Yu, C., Liu, H., Liu, Z., Jiang, T., 2008. Disrupted small-world networks in schizophrenia. Brain 131, 945–961. doi:10.1093/brain/awn018 Prichard, D., Theiler, J., 1994. Generating surrogate data for time series with several simultaneously measured variables. Physical Review Letters 73, 951–954. doi:10.1103/PhysRevLett.73.951 Rubinov, M., Knock, S.A., Stam, C.J., Micheloyannis, S., Harris, A.W.F., Williams, L.M., Breakspear, M., 2009. Small-world properties of nonlinear brain activity in schizophrenia. Hum Brain Mapp 30, 403–416. doi:10.1002/hbm.20517 Rubinov, M., Sporns, O., 2010. Complex network measures of brain connectivity: uses and interpretations. Neuroimage 52, 1059–1069. doi:10.1016/j.neuroimage.2009.10.003 Smith, S.M., Miller, K.L., Salimi-Khorshidi, G., Webster, M., Beckmann, C.F., Nichols, T.E., Ramsey, J.D., Woolrich, M.W., 2011. Network modelling methods for FMRI. Neuroimage 54, 875– 891. doi:10.1016/j.neuroimage.2010.08.063
13 Page 13 of 23
Stam, C.J., Jones, B.F., Nolte, G., Breakspear, M., Scheltens, P., 2007. Small-world networks and functional connectivity in Alzheimer’s disease. Cereb. Cortex 17, 92–99. doi:10.1093/cercor/bhj127 Tschernegg, M., Crone, J.S., Eigenberger, T., Schwartenbeck, P., Fauth-Bühler, M., Lemènager, T., Mann, K., Thon, N., Wurst, F.M., Kronbichler, M., 2013. Abnormalities of functional brain networks
ip t
in pathological gambling: a graph-theoretical approach. Front Hum Neurosci 7, 625. doi:10.3389/fnhum.2013.00625
Van Wijk, B.C.M., Stam, C.J., Daffertshofer, A., 2010. Comparing brain networks of different size
cr
and connectivity density using graph theory. PLoS ONE 5, e13701. doi:10.1371/journal.pone.0013701
us
Wang, L., Zhu, C., He, Y., Zang, Y., Cao, Q., Zhang, H., Zhong, Q., Wang, Y., 2009. Altered smallworld brain functional networks in children with attention-deficit/hyperactivity disorder. Hum Brain
an
Mapp 30, 638–649. doi:10.1002/hbm.20530
Xia, M., Wang, J., He, Y., 2013. BrainNet Viewer: A Network Visualization Tool for Human Brain Connectomics. PLoS ONE 8, e68910. doi:10.1371/journal.pone.0068910
M
Zalesky, A., Fornito, A., Bullmore, E.T., 2010. Network-based statistic: identifying differences in brain networks. Neuroimage 53, 1197–1207. doi:10.1016/j.neuroimage.2010.06.041
d
Zalesky, A., Fornito, A., Bullmore, E., 2012. On the use of correlation as a measure of network
Ac ce p
Figures:
te
connectivity. NeuroImage 60, 2096–2106. doi:10.1016/j.neuroimage.2012.02.001
Figure 1. Schematic workflow of GraphVar Figure 2. GraphVar setup interface
Figure 3. Example group comparison of characteristic path length across network thresholds with non-parametric permutation testing as an output of GraphVars results viewer. Grey lines represent differences in network measures between randomized groups (i.e., distribution of difference under the null hypothesis); blue line represents the actual group difference across thresholds; red dots represent significant group differences. x-axis: thresholds; y-axis: between group difference. Figure 4. Example correlation testing with local clustering coefficient in 14 brain regions across network thresholds as an output of GraphVars results viewer. x-axis: brain regions/network nodes; yaxis: network thresholds; color scale: correlation strength. Figure 5. Example results of a group comparison on differences in functional connectivity (FC) strength on the raw correlation matrices (association matrices) as an output of GraphVars results viewer. x-axis: brain regions/network nodes; y-axis: brain regions/network nodes; color scale: group difference in FC.
14 Page 14 of 23
Ac ce p
te
d
M
an
us
cr
ip t
Figure 6. Example output of GraphVars “network inspector” tool that may be used to identify graph components by applying network based statistics, as well as instant visualization of this graph component in BrainNetViewer (Xia et al., 2013) through GraphVar.
15 Page 15 of 23
Research highlights:
GraphVar is a user-friendly toolbox for comprehensive graph analyses of brain connectivity
-
GraphVar combines features across multiple current toolboxes without resorting to code
-
GraphVar entails an interactive viewer for results exploration
-
GraphVar will make graph theoretical methods more accessible for a broader audience
Ac ce p
te
d
M
an
us
cr
ip t
-
17 Page 16 of 23
cr
ip t
Table 1
Matlab
Matlab
Matlab
X X
-
X -
X X
X
GRETNA (Wang et al., 2013)
M
GAT (Hosseini et al., 2012)
METAlab_GTG (Jeffrey M. Spielberg; 2014)
MNET (Yoon et al., 2014)
NBS (Zalesky et al., 2010)
CONN (WhitfieldGabrieli et al. 2012)
BrainNet Viewer (Xia et al., 2013)
Matlab
Matlab
Matlab
Matlab
Matlab
Matlab
X X X
X X X
X X X
X -
X X X
X -
d
BCT (Rubinov and Sporns 2010)
ep te
Global Features Programing language GUI Preprocessing Generate connectivity matrix from time courses Most of BCT functions Sparse inverse covariance matrix estimation Second level analysis on graph measures Non-parametric tests (permutation on metric level) Non-parametric tests (subject specific nullmodel networks) Network based statistics (NBS) Network Visualization Interactive results exploration
GraphVar (Kruschwitz and List et al., 2015)
X
-
-
X
-
-
-
-
-
-
-
-
-
-
-
-
-
X
X
X
X
-
X
-
Ac c
Toolboxes
an
us
Table 1. Comparison of global GraphVar features with GUI-based features of other neuroscience graph analysis toolboxes that are freely available for research
X
-
X
-
X
-
X
X
-
X
X
-
-
-
-
-
-
-
X
-
-
-
-
-
X
X
-
X
X
X
-
-
X
X
X
X
X
-
X
-
-
X
X
X
(network visualization)
Page 17 of 23
ce pt
ed
M an
us
cr
i
Figure 1
Ac
Figures
Page 18 of 23
Ac
ce pt
ed
M an
us
cr
i
Figure 2
Page 19 of 23
Ac
ce pt
ed
M an
us
cr
i
Figure 3
Page 20 of 23
Ac
ce pt
ed
M an
us
cr
i
Figure 4
Page 21 of 23
Ac
ce pt
ed
M an
us
cr
i
Figure 5
Page 22 of 23
Ac
ce pt
ed
M an
us
cr
i
Figure 6
Page 23 of 23