simulations at present. I stress the importance of including postbounce neutrino physics, since it quantita- .... Robert Plant, Led Zeppelin, Stairway to heaven. 0.1 Preface. The major ...... and Lewy (CFL) condition [192]. Therefore we impose the ...
Gravitational Waves from 3D MHD Core-Collapse Supernova Simulations with Neutrino Transport
Inauguraldissertation zur Erlangung der W¨urde eines Doktors der Philosophie vorgelegt der philosophisch-naturwissenschaftlichen Fakult¨at der Universit¨at Basel von
Simon Urs Scheidegger aus Sumiswald, BE
Basel, 2011 Originaldokument gespeichert auf dem Dokumentenserver der Universität Basel edoc.unibas.ch
Dieses Werk ist unter dem Vertrag „Creative Commons Namensnennung-Keine kommerzielle Nutzung-Keine Bearbeitung 2.5 Schweiz“ lizenziert. Die vollständige Lizenz kann unter creativecommons.org/licences/by-nc-nd/2.5/ch eingesehen werden.
Genehmigt von der philosophisch-naturwissenschaftlichen Fakult¨at auf Antrag von Prof. Dr. Friedrich-Karl Thielemann, Prof. Dr. Matthias Liebend¨orfer und PD Dr. J´erˆome Novak
Basel, den 21. September 2010 Prof. Dr. Martin Spiess
ii
Namensnennung-Keine kommerzielle Nutzung-Keine Bearbeitung 2.5 Schweiz
Sie dürfen:
das Werk vervielfältigen, verbreiten und öffentlich zugänglich machen
Zu den folgenden Bedingungen:
Namensnennung. Sie müssen den Namen des Autors/Rechteinhabers in der von ihm festgelegten Weise nennen (wodurch aber nicht der Eindruck entstehen darf, Sie oder die Nutzung des Werkes durch Sie würden entlohnt).
Keine kommerzielle Nutzung. Dieses Werk darf nicht für kommerzielle Zwecke verwendet werden.
Keine Bearbeitung. Dieses Werk darf nicht bearbeitet oder in anderer Weise verändert werden. •
Im Falle einer Verbreitung müssen Sie anderen die Lizenzbedingungen, unter welche dieses Werk fällt, mitteilen. Am Einfachsten ist es, einen Link auf diese Seite einzubinden.
•
Jede der vorgenannten Bedingungen kann aufgehoben werden, sofern Sie die Einwilligung des Rechteinhabers dazu erhalten.
•
Diese Lizenz lässt die Urheberpersönlichkeitsrechte unberührt.
Die gesetzlichen Schranken des Urheberrechts bleiben hiervon unberührt. Die Commons Deed ist eine Zusammenfassung des Lizenzvertrags in allgemeinverständlicher Sprache: http://creativecommons.org/licenses/by-nc-nd/2.5/ch/legalcode.de Haftungsausschluss: Die Commons Deed ist kein Lizenzvertrag. Sie ist lediglich ein Referenztext, der den zugrundeliegenden Lizenzvertrag übersichtlich und in allgemeinverständlicher Sprache wiedergibt. Die Deed selbst entfaltet keine juristische Wirkung und erscheint im eigentlichen Lizenzvertrag nicht. Creative Commons ist keine Rechtsanwaltsgesellschaft und leistet keine Rechtsberatung. Die Weitergabe und Verlinkung des Commons Deeds führt zu keinem Mandatsverhältnis.
Quelle: http://creativecommons.org/licenses/by-nc-nd/2.5/ch/
Datum: 3.4.2009
iii
iv
Preceding page: Rotating core-collapse ‘jet’ supernova simulation (model R4E1CF) at equally spaced instances during the first 20ms after core bounce. The visualization was done by J. Biddiscombe, Swiss Supercomputer Centre (CSCS).
v
Dedicated to my mother, Ruth
Abstract
Core-collapse supernovae (CCSNe) are among the most energetic explosions in the universe, liberating the prodigious amount of ∼ 1053 erg, the binding energy of their compact remnants, neutron stars or stellar mass black holes. While 99% of this energy is emitted in neutrinos, 1% goes into the internal and asymptotic kinetic energy of the ejecta, and it is reasonable to assume that a tiny fraction is radiated in gravitational waves (GWs). Ever since the first experimental efforts to detect GWs, CCSNe have been considered prime sources of gravitational waves for interferometric detectors. Besides neutrinos, which have already been observed in the context of stellar core collapse of SN1987A, GWs could provide us access to the electromagnetically hidden compact inner core of some such cataclysmic events, supplying us for example with valuable information about the angular momentum distribution and the baryonic equation of state, both of which are uncertain. Furthermore, they might even help to constrain theoretically predicted SN mechanisms. However, GW astronomy strongly depends on the extensive data processing of the detector output on the basis of reliable GW estimates, which only recently have become feasible with the emerging power of supercomputers. The work presented in this thesis is concerned with numerical CCSN models and their imprints in GWs. I performed an extensive series of more than 30 three-dimensional magnetohydrodynamical (MHD) core-collapse simulations. My models are based on a 15M progenitor stemming from stellar evolution calculations, an effective general relativistic potential and either the Lattimer-Swesty (with three possible compressibilities) or the Shen equation of state (EoS) for hot, dense matter. Furthermore, the neutrino transport is tracked by computationally efficient algorithms for the radiative transfer of massless fermions. I systematically investigated the effects of the microphysical finite-temperature nuclear EoS, the initial rotation rate, both the toroidal and the poloidal magnetic fields, and multidimensional gravitational potentials on the GW signature. Based on the results of these calculations, I obtained the largest – and also one of the most realistic – catalogue of GW signatures from 3D MHD stellar core collapse simulations at present. I stress the importance of including postbounce neutrino physics, since it quantitatively alters the GW signature. Non- and slowly-rotating models show GW emission caused by prompt and protoneutron star (PNS) convection. Moreover, the signal stemming from prompt convection allows for the distinction between the two different nuclear EoS indirectly by different properties of the fluid instabilities. For simulations with moderate or even fast rotation rates, I only find the axisymmetric type I wave signature at core bounce. In line with recent results, I could confirm that the maximum GW amplitude scales roughly linearly with the ratio of rotational to gravitational energy (T /|W |) at core bounce below a threshold value of about 10%. Furthermore, I point out that PNS can become dynamically unstable to ro-
tational instabilities at T /|W | values as low as ∼ 2% at core bounce. Apart from these two points, I show that it is generally very difficult to discern the effects of the individual features of the input physics in a GW signal from a rotating CCSN that can be attributed unambiguously to a specific model. Weak magnetic fields do not notably influence the dynamical evolution of the core and thus the GW emission. However, for strong initial poloidal magnetic fields (& 1012 G), the combined action of flux-freezing and field winding leads to conditions where the ratio of magnetic field pressure to matter pressure reaches about unity which leads to the onset of a jet-like supernova explosion. The collimated bipolar out-stream of matter is then reflected in the emission of a type IV GW signal. In contradiction to axisymmetric simulations, I find evidence that nonaxisymmetric fluid modes can counteract or even suppress jet formation for models with strong initial toroidal magnetic fields. I emphasize the importance of including multidimensional gravitational potentials in rapidly rotating 3D CCSN simulations: taking them into account can alter the resulting GW amplitudes up to a factor of 2 compared to simulations which encounter gravity only by a monopolar approximation. Moreover, I show that the postbounce dynamics occuring in the outer layers (at radii R & 200km) of models run with 3D gravity deviates vastly from the ones run with a 1D or 2D gravitational potential. The latter finding implies that both spherically symmetric and axisymmetric treatments of gravity are too restrictive for a quantitative description of the overall postbounce evolution of rapidly rotating CCSN models. The results of models with continued neutrino emission show that including deleptonization during the postbounce phase is an indispensable issue for the quantitative prediction of GWs from core-collapse supernovae, because it can alter the GW amplitude up to a factor of 10 compared to a pure hydrodynamical treatment. My collapse simulations indicate that corresponding events in our Galaxy would be detectable either by LIGO, if the source is rotating, or at least by the advanced LIGO detector, if it is not or only slowly rotating.
viii
Contents
Overview 0.1 Preface . . . . . . . . . . . . . . . . . . . 0.2 Acknowledgements . . . . . . . . . . . . 0.3 New results obtained in this dissertation 0.4 Organisation of this Dissertation . . . . .
. . . .
. . . .
. . . .
. . . .
. . . .
. . . .
. . . .
. . . .
. . . .
. . . .
. . . .
. . . .
. . . .
. . . .
. . . .
. . . .
1 Introduction 1.1 General and historical notes on supernovae . . . . . . . . . . . . . . . 1.2 The ‘standard’ paradigm of core-collapse supernovae . . . . . . . . . 1.2.1 Stellar evolution . . . . . . . . . . . . . . . . . . . . . . . . . . 1.2.2 Core collapse and core bounce . . . . . . . . . . . . . . . . . . 1.2.3 Supernova dynamics & mechanism(s) . . . . . . . . . . . . . . 1.3 Gravitational waves . . . . . . . . . . . . . . . . . . . . . . . . . . . . 1.3.1 The linearized Einstein field equations . . . . . . . . . . . . . 1.3.2 Physical properties of gravitational radiation . . . . . . . . . . 1.3.3 The weak-field, slow-motion limit . . . . . . . . . . . . . . . . 1.3.4 Gravitational wave detectors . . . . . . . . . . . . . . . . . . . 1.4 Gravitational wave extraction in HD- and MHD simulations . . . . . 1.4.1 Alternative formulations of the Standard Quadrupole Formula 1.4.2 Total energy emission and spectral energy density . . . . . . . 1.4.3 Characteristical GW strain . . . . . . . . . . . . . . . . . . . . 1.5 Additional analysis tools . . . . . . . . . . . . . . . . . . . . . . . . . 1.5.1 The β-parameter . . . . . . . . . . . . . . . . . . . . . . . . . 1.5.2 The βmag -parameter . . . . . . . . . . . . . . . . . . . . . . . 1.5.3 Nonaxisymmetric structures . . . . . . . . . . . . . . . . . . . 1.6 Gravitational waves as messengers of stellar core collapse . . . . . . . 1.7 A brief survey on possible GW emission mechanisms from core-collapse supernovae . . . . . . . . . . . . . . . . . . . . . . . . . . . . . . . . . 1.7.1 Gravitational waves from rotating core collapse and core bounce 1.7.2 Gravitational waves from postbounce convection, SASI and anisotropic neutrino emission . . . . . . . . . . . . . . . . . . 1.7.3 Gravitational waves from magnetorotational core collapse . . . 1.7.4 Gravitational waves from nonaxisymmetric Instabilities at low T /|W | . . . . . . . . . . . . . . . . . . . . . . . . . . . . . . . 1.7.5 Gravitational waves from protoneutron star pulsations . . . . 1.8 Minimal requirements on 3D core-collapse supernova simulations . . .
xiii xiii xiv xv xix 1 1 4 4 5 9 13 15 16 18 20 29 30 33 33 33 34 34 34 35 38 39 39 40 40 40 41
ix
Contents 2 3D MHD Core-Collapse Simulations: Implementation 45 2.1 Ideal magnetohydrodynamics . . . . . . . . . . . . . . . . . . . . . . 45 2.2 Numerical solution of the MHD equations: The FISH & ELEPHANT codes 46 2.2.1 Code set-up and performance . . . . . . . . . . . . . . . . . . 56 2.2.2 Treatment of gravity . . . . . . . . . . . . . . . . . . . . . . . 58 2.3 Equations of state . . . . . . . . . . . . . . . . . . . . . . . . . . . . . 72 2.3.1 Lattimer-Swesty EoS . . . . . . . . . . . . . . . . . . . . . . . 74 2.3.2 Shen EoS . . . . . . . . . . . . . . . . . . . . . . . . . . . . . 74 2.4 Neutrino transport & transport approximations . . . . . . . . . . . . 74 2.4.1 Neutrino interactions . . . . . . . . . . . . . . . . . . . . . . . 76 2.4.2 Neutrino parametrization scheme . . . . . . . . . . . . . . . . 83 2.4.3 The isotropic diffusion source approximation IDSA . . . . . . 88 2.5 Presupernova stellar models & initial model configurations . . . . . . 100 3 3D 3.1 3.2 3.3 3.4
MHD Core-Collapse Simulations: Results I 103 Description of the magnetohydrodynamical models . . . . . . . . . . 103 Model parameters and nomenclature . . . . . . . . . . . . . . . . . . 104 Compute requirements . . . . . . . . . . . . . . . . . . . . . . . . . . 104 Non- or slowly rotating core collapse . . . . . . . . . . . . . . . . . . 105 3.4.1 General remarks . . . . . . . . . . . . . . . . . . . . . . . . . 105 3.4.2 Models without deleptonization in the postbounce phase: Effects of the EoS and magnetic fields on the GW signature . . . 107 3.4.3 Model with deleptonization in the postbounce phase . . . . . . 112 3.4.4 Model with IDSA in the postbounce phase . . . . . . . . . . . 114 3.5 Rapidly rotating core collapse . . . . . . . . . . . . . . . . . . . . . . 117 3.5.1 Core bounce: Effects of the rotation rate on the GW signature 117 3.5.2 Core bounce: Effects of the EoS on the GW signature . . . . . 124 3.5.3 Gravitational waves from the nonaxisymmetric rotational instability: General remarks . . . . . . . . . . . . . . . . . . . . 126 3.5.4 Models without deleptonization in the postbounce phase: Effects of the EoS and magnetic fields on the GW signature from the low T/|W| instability . . . . . . . . . . . . . . . . . . . . . 128 3.5.5 Lower limit . . . . . . . . . . . . . . . . . . . . . . . . . . . . 130 3.5.6 Models with deleptonization during the postbounce phase . . 131 3.5.7 The influence of strong magnetic fields on the gravitational wave signature . . . . . . . . . . . . . . . . . . . . . . . . . . 133
4 3D 4.1 4.2 4.3
MHD Core-Collapse Simulations: Results II Description of the magnetohydrodynamical models . . . . . . . . . Axisymmetric (2D) gravity . . . . . . . . . . . . . . . . . . . . . . . 3D gravity . . . . . . . . . . . . . . . . . . . . . . . . . . . . . . . .
5 Summary and Conclusions
141 . 141 . 142 . 144 149
A 1DGR & IDSA 155 A.1 Merging 1DGR & IDSA: hydrodynamics and curvature equations . . . 156
x
Contents List of Figures
161
List of Tables
171
B List of Publications
173
C Curriculum vitæ
175
xi
Contents
xii
Overview There’s a lady who’s sure all that glitters is gold and she’s buying a stairway to heaven. When she gets there, she knows if the stores are all closed with a word she can get what she came for. Ooh, ooh, and she’s buying a stairway to heaven. Robert Plant, Led Zeppelin, Stairway to heaven
0.1 Preface The major task of my PhD thesis was to study the gravitational wave signature of three-dimensional magnetohydrodynamical core-collapse supenova simulations. The foundations of this work were laid in the spring term 2005, when as an undergraduate student I attended a proseminar held by Prof. Dr. B. Binggeli and Prof. Dr. E. K. Grebel on current issues of modern astronomy. I picked gravitational waves as my presentation topic. Ever since, I have happily remained chained to this very fascinating and exciting subject, as I feel that our generation might be at the dawn of gravitational wave astronomy. In the subsequent master course, lasting from autumn 2005 to spring 2007, a joint lecture by Prof. Dr. M. Liebend¨orfer and Prof. Dr. F.-K. Thielemann on numerical astrophysics awaked my interest in computational and supernova physics. At this time, I began to collaborate with Prof. Dr. M. Liebend¨orfer on gravitational waves from stellar core collapse. He gave me the opportunity to take my first steps in science, supervising first my master thesis, and later also the course of my dissertation in the Astroparticle group of the University of Basel. During my PhD studies from June 2007 - August 2010, I had the unique chance to delve into the very interesting but also challenging world of stellar core collapse physics. Beside carrying out my own research in Basel, I was able to visit a large number of places all over the world in order to promote scientific results and for talks (Todtmoos, Germany; Trento, Italy; Ladek Zdroj, Poland; Ringberg Castle, Germany; Paris, France; Hirschegg, Austria; Heidelberg, Germany; Potsdam, Germany; Copenhagen, Denmark; Pasadena, USA; Caen, France; Garching, Germany). I would hardly have visited all these places so early in life if it hadn’t been for science! At these conferences and invited talks I profited extensively from discussions with many interesting and inspiring persons. The process of writing this thesis was an intense and exhausting experience. However, I would do it again: the positive impressions I gained in exchange for hard work will remain.
xiii
Overview
0.2 Acknowledgements The results obtained in this dissertation would not have been possible without the close collaboration and support of a variety of persons. My thanks go to • Prof. Dr. M. Liebend¨orfer (University of Basel) for advising the course of my PhD thesis, his steady support and encouragement. To him I would like to express my sincere gratitude! • Prof. Dr. F.-K. Thielemann (University of Basel) for co-supervising my dissertation and giving me the possibility to do this thesis in the very stimulating working environment of the Astroparticle group. • PD Dr. J. Novak (LUTH, Meudon, France) for the newly established collaboration from which I could profit extensively. Moreover, I appreciate his willingness to be the external expert for my dissertation. • R. K¨appeli & U. Frischknecht (University of Basel) for loads of useful and useless discussions. It was a unique time of sharing with them a ‘research outpost’ for three years at Oetlingerstrasse 194, 4057 Basel. • PD. Dr. A. Aste & Dr. C. von Arx (University of Basel) for proof-reading, sharing the office, discussions on theoretical foundations of human existence, and for their friendship. • the National Science Foundation for granting financial support for my PhD project. • Dr. T. Fischer, M. Horras, A. Perego, PD Dr. T. Rauscher, Prof. Dr. D. Trautmann, Dr. S. C. Whitehouse, C. Winteler, present and past members of the Astroparticle group of the University of Basel, for a cordial work ambiance. • Prof. Dr. C. D. Ott (CALTECH, Pasadena, USA) for the smooth and enjoyable collaboration on the matter of merging general-relativistic supernova codes with the IDSA, and mentoring me for more than three years on issues of gravitational wave physics. • PD Dr. Olaf Schenk (University of Basel) for his friendly and unbureaucratic support with issues concerning the PARDISO sparse matrix solver. • Dr. S. Alam and J. Biddiscombe (Swiss Supercomputing Centre CSCS) for their support on computational issues, the visualization of simulations and related topics. • Helen Wallimann, for proof-reading. • CompStar, a research networking programme of the European Science Foundation. • my family for their constant, altruistic support.
xiv
0.3 New results obtained in this dissertation
0.3 New results obtained in this dissertation This dissertation is primarily devoted to the study of the gravitational wave emission from core-collapse supernovae. The new results presented in this thesis and in part reported in [206, 208, 210] are my contributions to this very active field of research. Below, I list and summarize the most important findings.
An alternative formula for gravitational wave extraction The gravitational wave signature of stellar core collapse is usually extracted via numerically convenient formulations of the ‘quadrupole approximation’ [71, 32]. However, these formulas usually do not account for the contributions of magnetic fields. Since I perform magnetohydrodynamical simulations, I extended the existing formulas to the latter case in order to calculate the contribution to the GW signal due to magnetic stresses. Following the 2D axisymmetric derivations of [170,122], I have generalized the standard quadrupole formula to the case of a magnetized fluid in 3D Cartesian coordinates (see sec. 1.4.1).
The importance of spectral neutrino transport for the prediction of the 3D gravitational wave signal from ‘prompt’ and early protoneutron star convection Non- and slowly rotating progenitor stars all undergo quasi-spherically symmetric core collapse. As the emission of gravitational waves intrinsically depends on dynamical processes that deviate from spherical symmetry, the collapse phase does not provide any kind of signal. However, subsequent pressure-dominated core bounce, where the collapse is halted due to the stiffening of the equation of state at nuclear density, launches a shock wave that plows through the infalling layers, leaving behind a negative entropy gradient. Moreover, as soon as the shock breaks through the neutrino sphere ∼ 5ms after bounce, the immediate burst of electron neutrinos causes a negative lepton gradient at the edge of the protoneutron star. The combination of these two gradients forms a convectively unstable region according to the Schwarzschild-Ledoux criterion [127, 251], which in turn induces a gravitational wave burst due to this so-called ‘prompt’ convection. In order to study the influence and necessity of neutrino transport on the stochastic 3D matter dynamics and the gravitational wave emission in the early supernova stages (t . 100ms after bounce), without having other different physical parameters interfering, I investigated comparative simulations with various degrees of neutrino transport: a) purely hydrodynamical postbounce evolution, b) a leakage scheme, and c) full spectral electron neutrino transport. My results suggest that the primary ingredient for supernova simulations which attempt a quantitative prediction of GWs from ‘prompt’ and early protoneutron star convection (t . 100ms after bounce) is the accurate radial location and size of
xv
Overview convectively unstable layers. It defines the dynamical behaviour and timescale of overturning matter in this early supernova stage (see sec. 3.4.3).
Equation of state dependence of the gravitational wave signature The temperatures and densities inside a supernova core exceed the range that is easily accessible by terrestrial experiments. Thus, it will be impossible for the foreseeable future to construct a unique finite temperature equation of state for hot and dense matter based on experimentally verified data. In order to circumvent this problem, the information content gravitational waves carry to us from the heart of stellar core collapse might provide us with an alternative way of studying nuclear matter properties far beyond saturation. However, to tap this information, models with different nuclear input must be run and their computed wave form output can subsequently be compared with actual (future) detector data. In order to address this task, I carried out a large parameter study in 3D, employing the Lattimer-Swesty [130] and the Shen equation of state [215]. Note that I compared for the first time ever the gravitational wave signatures resulting from the three different choices of nuclear matter compressibility provided by the Lattimer-Swesty equation of state. My studies show that the gravitational wave signal stemming from prompt convection in slowly rotating supernova cores allows for the distinction between the two different nuclear equations of state (Lattimer-Swesty and Shen) indirectly by different properties of the fluid instabilities. I also found minor deviations in the GW characteristics for simulations which were carried out with different compressibility versions of the Lattimer-Swesty equation of state. However, the differences in the frequency domain of the GW signal are negligibly small and thus not likely to be constrained by observation (see sec. 3.4). Furthermore, my results indicate that the particular choice of the nuclear equation of state has little influence on the gravitational wave signal from rapidly rotating core collapse. It is, among other things, degenerate with the rotation rate of the supernova core (see secs. 3.4.2 and 3.5.2).
Nonaxisymmetric rotational instabilities in the protoneutron star Recently it has been argued, based on numerical simulations of equilibrium neutron star models or full core-collapse simulations, that differentially rotating protoneutron stars can be subject to non-axisymmetric rotational instabilities at β values (=T ˆ /|W |, the ratio of rotational to gravitational energy) far below the ones known from the classical dynamical bar mode instability with a threshold of βdyn = 27%, or the secular instability, which is triggered at βsec ∼ 14% [228], leading to strong, narrow-band gravitational wave emission [51, 179, 206]. At present little is known about the true nature of the so-called low T /|W | instability. Previous work has so far failed to establish (for example) an analytical instability criterion, as was pointed out by [174]. I address two relevant questions regarding the so-called ‘low T /|W |’ instability in the context of stellar core collapse: i) What is the minimum
xvi
0.3 New results obtained in this dissertation β value required in self-consistent core-collapse simulation to trigger the onset of the instability? This is important to know, since most stars which undergo a core collapse rotate only slowly [92]; furthermore, it was pointed out by [62] that even fast rotating protoneutron stars can never accrete enough angular momentum to reach the βdyn value required for the onset of the classical bar mode instability. ii) How does the inclusion of deleptonization in the postbounce phase quantitatively alter the GW signal? My studies indicate that protoneutron stars can become dynamically unstable to rotational instabilities at T /|W | values as low as ∼ 2% at core bounce. Moreover, they also show that the inclusion of deleptonization during the postbounce phase is very important for the quantitative GW prediction, as it enhances the absolute values of the gravitational wave trains up to a factor of ten with respect to a leptonconserving treatment (see sec. 3.5.3).
Effects of strong magnetic fields on the gravitational wave signature in 3D Weak magnetic fields do not notably influence the dynamical evolution of the core and thus the GW emission. However, for strong initial poloidal magnetic fields (& 1012 G), the combined action of flux-freezing and field winding leads to conditions where the ratio of magnetic field pressure to matter pressure reaches about unity which leads to the onset of a jet-like supernova explosion. The collimated bipolar out-stream of matter is then reflected in the emission of a type IV GW signal [170]. In contradiction to axisymmetric simulations, I find evidence that nonaxisymmetric fluid modes can counteract or even suppress jet formation for models with strong initial toroidal magnetic fields. The resulting GW signals consequently show pure hydrodynamical features (see sec. 3.5.7).
Effects of multidimensional gravitational potentials on the gravitational wave signature Since a CCSN does not proceed in an entirely spherically symmetric way, directiondependent gradients of the gravitational potential are likely to emerge in 3D simulations. This in turn is reflected in non-uniform matter acceleration, leading to a slightly modified temporal outcome of numerical simulations in which the dimensionality of the gravitational potential is varied while keeping the other parameters fixed. I investigate the sensitivity of the GW signal upon the dimensionality of the gravitational potential. For this I compare rapidly rotating models which implement gravity either by a spherically symmetric (1D), axisymmetric (2D) or 3D approach. My results show that in the case of a 2D gravitational potential, the axisymmetric acceleration of the fluid due to gravity leads to a somewhat more oblate configuration of the protoneutron star around bounce and the early postbounce phase compared to models which were run with a spherically symmetric approach for gravity. This causes, as a direct consequence, considerably stronger GW emission at core bounce,
xvii
Overview with an enhancement of the maximum amplitude of ∼ 20% − 30% compared to the reference models with 1D gravity. Moreover, significant differences also occur for the GW signal from the low T /|W | instability. Because the axisymmetric treatment of gravity can account better for spiral structures, this in turn leads to a faster growth of unstable modes to more prominent values, causing an earlier onset of GW emission and maximum amplitudes up to a factor of 2 larger compared to the reference models with 1D gravity (see sec. 4.2). In case of models which implement gravity in 3D, I confirm the trends found with respect to GW emission in simulations which treat the gravitational potential in axisymmetry. This is due to the fact that in my models, the dominant contributions to the GW amplitudes are emitted at radii R < 30km, where the predominant deformation of the PNS is of axisymmetric nature. Moreover, I also show that the postbounce dynamics occuring in the outer layers (R & 200km) of models run with 3D gravity deviates vastly from the ones run with a 1D or 2D potential. The latter finding implies that both spherically symmetric and axisymmetric treatments of gravity are too restrictive for a quantitative description of the overall postbounce evolution of rapidly rotating CCSN models.
xviii
0.4 Organisation of this Dissertation
0.4 Organisation of this Dissertation In chaper 1, I present a general introduction to core-collapse supernova physics, gravitational wave theroy and observation. In addition, I give a short overview on previous work concerning gravitational wave signatures of core-collapse supernovae. Finally, I outline a minimal set of requirements which should be included in 3D simulations if one wants to raise a claim on the reasonable and indicative outcome of the simulations and the predicted observables. Chapter 2 is devoted to a comprehensive and detailed description of the various components of the 3D magnetohydrodynamic codes FISH and ELEPHANT. Chapter 3 contains an extensive discussion of the results obtained via some of today’s most realistic calculations of non-rotating and rotating stellar core collapse in 3D. These calculations employ a finite-temperature equation of state, magnetic fields, an approximate treatment for deleptonization during the collapse, state-of-the-art presupernova stellar models from stellar evolutionary calculations, and computationally efficient methods for the neutrino transport. I discuss estimates for the gravitational wave signature. In chapter 4, the influence of axisymmetric (2D) and 3D gravitational potentials on the resulting GW signatures is investigated. In chapter 5, I conclude and summarize the work presented in this dissertation.
xix
xx
1 Introduction Was einmal gedacht wurde, kann nicht mehr zur¨ uckgenommen werden. Friedrich D¨ urrenmatt, Die Physiker
1.1 General and historical notes on supernovae Supernovae (SNe) owe their name to the astronomers Baade and Zwicky who in the 1930’s realized that these objects were much more luminous and by far rarer than common novae [21, 22, 262]. Their high luminosities, comparable to the integrated light of their host galaxies, broad spectral lines, and sudden occurrence in the sky led them to conclude that SNe were very energetic explosions. The two physicists even went a step further and hypothesized that ‘...the super-nova process represents the transition of an ordinary star into a neutron star’ [22]. This is a very remarkable idea for its time – only a few years after James Chadwick had actually discovered the neutron (1932) [52] – and still lies at the heart of modern theoretical models for SNe that result from the gravitational collapse of the cores of massive stars. Theorists distinguish two fundamentally different SN types, regardless of their spectroscopic appearance: core-collapse and thermonuclear SNe. Core-collapse supernovae (CCSNe hereafter) occur near star forming regions and have never been observed in elliptical galaxies [90], which leads to the idea that their progenitors are massive stars born with more than ∼ 8M , and are relatively shortlived (a massive star of e.g. 9M persists for . 2.6×10⁷ years in the overall dominant hydrogen burning phase, while our sun’s lifespan is & 9.8×10⁹ years [202,146]). Such massive stars go through all the nuclear burning stages up to iron, beyond which nuclear fusion would be endothermic (see, e.g., [47], with references therein). Hence, at the end of a massive star’s thermonuclear life, it has an ‘onion-skin’ structure in which an oxygen-neon-magnesium core or – for stars more massive than ∼ 10M – even an iron core is nested within shells comprised of elements of progressively lower atomic weight at progressively lower densities and temperatures (see, e.g., [146], with references therein). A typical nesting is Fe → Si → O → He → H (see figs. 1.3 and 1.4). When nuclear burning ceases in these massive stars the core becomes unstable and gravitational collapse follows, leading to the formation of a neutron
1
1 Introduction
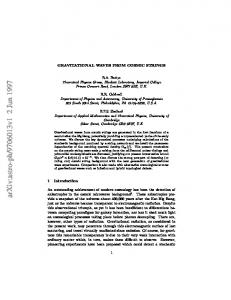
Figure 1.1: Astronomer’s supernova classification [70, 90]. The two main spectroscopic types are the type II class, which comprises SNe with prominent hydrogen lines, whereas the type I class is defined by the absence of hydrogen in their spectra. Note that theorists attach less importance to the external aspects of SNe (spectra) than to their interiors (the origin of their explosion), and distinguish two fundamentally different SN types regardless of their spectroscopic appearance: core-collapse and thermonuclear SNe. In this sense, SNe Ib, Ic are thought to be physically much closer to SNe II than to SN Ia, even though SNe Ia, Ib, and Ic all share the same prefix, owing to the lack of hydrogen in their atmospheres. star or black hole [214]. The standard paradigm is that most of the gravitational binding energy released during the collapse is liberated in neutrinos (O(1053 )erg) and in the kinetic energy of the explosion of the envelope (O(1051 )erg; 1051 erg ≡ 1 Bethe [B]). Thermonuclear supernovae (not a subject of this PhD thesis), on the other hand, are about ten times less prevalent than CCSNe [47] and thought to arise from small carbon-oxygen white dwarfs, the end products of low-mass stellar evolution. They explode as they approach the Chandrasekhar mass (∼ 1.4M ) after a period of mass accretion from a binary companion, leaving no compact remnant behind them [214]. Astronomers use observational, not theoretical criteria to type supernovae, according to the presence or absence of certain elements in their atmospheres based on spectroscopic observations (see, e.g., [70, 90] for detailed reviews, and fig. 1.1): • Type Ia: They are characterized by a strong absorption attributed to Si. Because all type Ia light curves (luminosity vs. time) are quite similar, they can
2
1.1 General and historical notes on supernovae be used as standard candles for measuring distances and probing the curvature of the universe [186]. • Type Ib: These objects are distinguished by spectra with no evident Balmer lines, weak or absent Si, and strong He. • Type Ic: The members of this class are characterized by weak or absent hydrogen and helium lines, and no evident Si. • Type II: These objects have prominent Balmer lines. Note that the distinguishing feature of types Ib and Ic is the lack of conspicuous hydrogen spectral lines. Their progenitors are believed to be massive stars that lose most of their H-rich (and perhaps He-rich) envelopes via strong winds or transfer to a binary companion via Roche overflow [90]. Moreover, neutron stars have been associated with remnants of CCSNe via pulsar radio emission such as in the Crab Nebula (see [142], with references therein). Finally, it is also of great importance to point out that about a decade ago, signatures of very energetic type Ic SNe, socalled ‘Hypernovae’ 1 , were found for the first time in the afterglows of the ‘long-soft’ gamma-ray bursts for the first time, thus linking nature’s two grandest explosions (see [254], with references therein). In our galaxy, i.e. at distances . 10kpc, SNe are considered to be rare events. Within the last millennium, mankind has witnessed only 6 supernovae in our galaxy and one in the Large Magellanic cloud (see fig. 1.2). Among them are the recent SN 1987A (type II, located not in the Milky Way, but in the Large Magellanic cloud), the SN in the Crab Nebula (type II), and the SNe recorded by Tycho Brahe (probably type Ia) and Johannes Keppler (type Ia). Even though observers estimate that this number represents only ∼ 20% of the galactic SNe that have exploded within the last 1000 years [47] (because the majority were shrouded from view by the dust that pervades the Milky Way), our generation of (gravitational wave) astronomers and astrophysicists would have to consider themselves very lucky if they could witness a SN explosion close by. Modern estimates of galactic SNe rates predict the frequency of core collapse to be 1.9(±1.1) events per century [58]. This event rate increases drastically only when we reach out to the Virgo galaxy cluster at a distance of ∼ 10 − 20Mpc. Then, the event rate for CCSNe is estimated to be ∼ 5 per year [49]. Hence, if one wants, for instance, to use gravitational wave astronomy for regular observations of stellar core collapse with reasonable statistics, detector facilities must one day be able to provide the sensitivities required to see as far as the Virgo cluster (see sec. 1.3). SNe were and are crucial for the dynamical and morphological development of the Universe and thus indispensable for the existence of life on earth. The ‘oxygen’ ejected during a CCSN for example is the dominant source of the element in the 1
Detailed studies of spectra and light curves suggest that hypernovae release about 1052 ergs in kinetic energy, or ten times that of a typical supernova [254].
3
1 Introduction
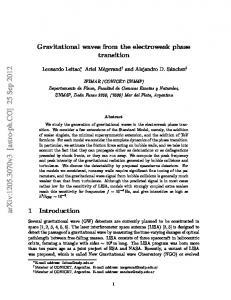
Figure 1.2: Compilation of ‘historical’ supernovae that have exploded in our Galaxy and the Large Magellanic cloud within the past millennium. Note that these supernovae are only a fraction of the total, because the majority were probably hidden from view by the dust that pervades the Milky Way. Note also that SN 1987A exploded not in the Milky Way but in the Large Magellanic cloud (one of its nearby satellite galaxies). Astronomical magnitudes are logarithmic and are given by the formula MV = −2.5 log10 (brightness) + constant. For comparison, the Moon is near −12 magnitudes, Venus at peak is −4.4 magnitudes, and good eyes can see down to about +6 magnitudes. Note that the compilation above also contains RX J0852-4642, a supernova remnant whose very nearby birth went unrecorded (perhaps because it resides in the southern hemisphere), and Cas A, a supernova remnant that may have been recorded only in ambiguous notes. Table taken from [47]. Universe [47]. So naturally, any attempt to address human origins must begin with the understanding of CCSNe. Finally, SNe were also of central historical and sociological importance. It is wellknown that Tycho’s and Kepler’s SNe 1572 and 1604 (see fig. 1.2) had tremendous effects on the development of astronomy in Europe because they were used to argue against the Aristotelian idea that the universe beyond the Moon and planets was immutable [54].
1.2 The ‘standard’ paradigm of core-collapse supernovae 1.2.1 Stellar evolution A star’s life begins in dense parts of molecular clouds. There, in so-called starforming regions (see, e.g. [123], with references therein), the gas collapses gravitationally via complicated interactions of turbulence, magnetic fields and radiation into balls of plasma (see, e.g., [26], with references therein).
4
1.2 The ‘standard’ paradigm of core-collapse supernovae If the initial mass of such a collapsing object is greater than about & 0.072M 2 [214], the plasma the hydrogen ignition temperatures of ∼ 1.5 × 10⁷ K exceeds during contraction, which is the first stage of a sequence of thermonuclear burning processes. The onset of nuclear fusion leads relatively quickly to a hydrostatic equilibrium in which energy released by the core exerts a radiation pressure balancing the weight of the star’s overlying matter, preventing further gravitational collapse [146]. With the exhaustion of core hydrogen, most stars proceed to shell hydrogen burning, and then on to core helium burning. The ashes of the latter are predominantly carbon and oxygen. With the passing of each stage, the centre of the star grows hotter and more dense (see, e.g., [255]). However, low mass (. 6 − 8M ) stars do not proceed beyond this stage. They are not massive enough to contract to sufficiently high densities and temperatures for carbon burning. They end their lives as white dwarfs [91, 214]. More massive stars ignite carbon burning which leaves oxygen, magnesium and neon as ashes. In the case of stars with birth masses of ∼ 8 − 10M , the core temperatures are too low to ignite further nuclear burning. Subsequently, they either lose their envelopes and become O/Ne/Mg white dwarfs (possible progenitors of accretion-induced collapse [57,15]), or undergo a collapse of their low-mass O/Ne/Mg cores [115, 74]. For stars with masses from ∼ 10M to 60-100M [256] (the upper limit depends on the heavy-element/metallicity fraction at birth), the ashes of carbon burning reach temperatures sufficient to ignite, and they burn predominantly to silicon, sulphur, calcium and argon. Finally, these products ignite to produce iron-group elements. Eventually, this core of iron-group nuclei is embedded in an onion skin structure, as already mentioned in the previous sec. 1.1 and shown in figs. 1.3 and 1.4. Note that after helium burning, the evolution is greatly accelerated by neutrino losses (see fig. 1.3). For the temperatures approaching a billion degrees or more, a large thermal population of electrons and positrons is maintained. When the electrons meet and annihilate with positrons, a neutrino-antineutrino pair is occasionally produced. These neutrinos escape the star with ease under the prevailing densities and force the burning to go faster to replenish the loss. Although the fusion of hydrogen and helium takes millions of years, the last burning stage – silicon burning – lasts only about two weeks [256]. Because the nuclear binding energy per nucleon has its maximum value for the iron group (see, e.g., [35]), no further energy can be released by nuclear fusion.
1.2.2 Core collapse and core bounce When the iron core is formed in the centre of the massive star, it grows steadily by the ashes of the silicon shell burning. Even though the central part of the massive star is hot, the high densities and the ordered arrangement of its constituent nucleons into nuclei results in a low specific entropy. Therefore, at this low entropy the core’s pressure support against gravity is derived mostly (& 90%; see [29]) from relativistic, 2
Objects with a mass . 0.072M cannot fuse H to He and are called ‘Brown dwarfs’. For a thorough review on Brown dwarfs, see [44], with references therein.
5
1 Introduction
Figure 1.3: Schematic structure of a 15M precollapse star, taken from [257]. The upper panel displays the temperature and the density profile. Moreover, Ltot , �ν and �nuc stand for total energy loss/luminosity and the corresponding contributions from the neutrino emission and the energy generation in nuclear reactions. The lower panel shows the composition profile, where the iron core is surrounded by shells of lighter elements. The size of the iron core is of the order 109 cm, while the stellar radius is larger than 1013 cm. degenerate electrons [214], Pe ∝ Ye4/3 ρΓ ,
6
(1.1)
1.2 The ‘standard’ paradigm of core-collapse supernovae where Ye is the number of electrons per baryon (electron fraction), ρ is the density, and Γ is the adiabatic index which assumes a value of 4/3 for the relativistic degeneracy limit [214]. For precollapse iron cores, typical values for Ye are ∼ 0.42 at the centre and ∼ 0.48 at the outer edge [258]. Once the iron core is pushed over the Chandrasekhar mass limit, which is the maximum mass of a non-rotating fluid body that can be held in hydrostatic equilibrium by electron-degeneracy pressure in Newtonian gravity (see [29], with references therein), " � �2 # s e MCh ≈ 5.8 Ye2 1 + M , (1.2) πYe electron degeneracy pressure can no longer stabilize the core and it collapses. Note that Ye and se in eq. 1.2 are average values of electron fraction and electronic entropy per baryon over the mass of the Fe core. Putting typical values (Ye = 0.45, se = 0.52) in a 15M into eq. 1.2, one gets a Chandrasekhar mass of ∼ 1.34M . The onset of infall is accelerated by two additional processes that rob the core’s energy and pressure support: a) electron capture and b) photodissociation (see, e.g., [214]). Under the prevailing densities and temperatures, electron capture occurs on heavy Fe group nuclei and free protons via 56
Fe + e− → 56 Mn + νe , p + e− → n + νe ,
(1.3)
because the Fermi energy of electrons [214, 119], � µe = 11.1MeV
ρYe 10 10 gcm−3
�1/3 (1.4)
exceeds the mass difference between the nuclei, namely mMn − mFe = 3.7MeV. Electron captures reduce Ye and consequently the pressure support. Note that the electron-type neutrinos escape freely from the core before the densities reach ∼ 1012 gcm−3 , as will be outlined later below. Furthermore, the endothermic photodissociation of iron nuclei [214], γ +56 26 F e → 13α + 4n − 124.4MeV ,
(1.5)
occurs for temperatures T & 5 × 10⁹ K, which leads to the reduction of the additional thermal pressure support. Moreover, the internal energy produced by the core contraction is exhausted by this reaction. Note that after the onset of the gravitational collapse, the core proceeds to contract under the pull of the self-gravitating force, unnoticed by the rest of the outer part of the star, on a free-fall time-scale which is of the order τdyn ∼ 1/ (Gρ)1/2 (with G and ρ being the gravitational constant and the average density). This is because the density decreases steeply from the core to the surrounding shells. Hence the dynamical timescale of the core is much shorter than the one of the envelope (cf. the upper panel of fig. 1.3). As a result, the dynamics of the iron core is hardly or not, affected by the envelope. Hence, the outer shells are not moved. They are
7
1 Introduction oblivious to their impending fate until the supernova shock wave generated in the core hits and ejects them. An important change in the physics of the collapse occurs as the densities reach ∼ 1012 gcm−3 . At this point, the scattering opacities become so large that the mean free path of the neutrinos is reduced to values much smaller than the core’s size. Thus, the diffusion timescale of the neutrinos becomes large compared to the dynamical timescale of the collapse [29]. Note that during collapse, only electron neutrinos are produced copiously by electron captures. Therefore, the dominant opacity source for the neutrinos during the infall phase is coherent scattering, νe + A → νe + A ,
(1.6)
by which the cross section becomes roughly A2 times the cross section of each scattering of nucleons (νe +n/p → νe +n/p) [37]. The trapping of neutrinos also means that β-equilibrium prevails, keeping the lepton fraction (Yl = Ye + Yνe ) fixed [29,214,150]. After β-equilibrium is achieved, the collapse proceeds adiabatically. When neutrinos are trapped and become degenerate, the average neutrino energy increases and the core becomes optically thicker because the cross section of the coherent scattering increases as σcoh ∝ Eν2 with the electron neutrino energy. Note as a side remark that since low-energy neutrinos can escape easily from the core, most neutrinos emitted during the collapse phase, before the trapping is active, have relatively low energy (. 30 MeV; see [119], with references therein). During the collapse, the core forms two parts: the (homologously collapsing) inner core and the (subsonically infalling) outer core. Matter inside the sonic point – the point in the star where the sound speed equals the magnitude of the infall velocity – stays in communication and collapses homologously (v ∝ r; see [85]). On the other hand, the material outside the sonic point falls in quasi-free fall. Analytical studies by Goldreich & Weber [85] have shown that typical inner core masses scale roughly as Mic ∝ Ye2 . The entire collapse continues on a time scale of a few 100 ms until nuclear densities, several ×1014 gcm−3 [29], are reached. Now, strong repulsive nuclear forces lead to an immediate stiffening of the nuclear equation of state (EoS), which halts the collapse of the inner core on a timescale of a millisecond. The abrupt halt of the collapse of the inner core and its rebound, the so-called ‘core bounce’, generates a hydrodynamical shock wave as the core’s outer half continues to crash down. During the collapse of the iron core, a huge amount of gravitational binding energy, the ultimate energy source of CCSNe, is released when contracting from a radius of ∼ 1500km and central densities below 1010 gcm−3 to a radius of ∼ 10km and densities above that in atomic nuclei (see fig. 1.4). To first order, the gravitational binding energy of the remnant neutron star is given by 3 GMN2 S |W | ∼ ∼ 2 − 3 × 1053 erg , Ekin � Egrav 5 R
(1.7)
where MN S is the neutron star mass and RN S is its radius. Typical values are ∼ 1.4M , ∼ 10km and |W | ∼ 2 − 3 × 1053 erg, respectively. 99% of this energy is liberated in form of neutrinos throughout the SN evolution and the late-time cooling
8
1.2 The ‘standard’ paradigm of core-collapse supernovae of the PNS [29], as I will outline below. It is a huge amount of energy in contrast to the kinetic energy of observed SNe (Ekin ∼ 1051 erg [29]).
1.2.3 Supernova dynamics & mechanism(s) The core bounce with the formation of the shock wave is the starting point of a sequence of events that ultimately trigger a supernova explosion. The shock wave which propagates into the outer core quickly loses its initial strength to the dissociation of nuclei into free nucleons at a cost of ∼ 8.8MeV per nucleon [29]. At the same time, this process enables copious electron captures on the emerging free protons (e− + p → n + ve ) just behind the shock. Before the shock arrives at the neutrino sphere, electron neutrinos cannot escape on a hydrodynamical timescale, because the diffusion timescale is much longer than that for the shock propagation. However, as the shock wave moves through the neutrino sphere, the previously trapped electron neutrinos decouple from matter and begin to stream freely [232]. This sudden liberation of electron neutrinos is called the neutronization burst, where the peak luminosities can easily exceed 1053 ergs−1 for the duration of several ms. Hence, the combined action of dissociation and neutrino emission causes the shock to stall within ∼ 10 − 20ms after core bounce as ‘standing accretion shock’ at radii around 100 − 200km [138, 252] due to the large energy loss caused by dissociation and neutrino emission. Thus, all today’s state-of-the art models agree that this so-called ‘prompt’ shock is unable 3 to trigger supernova explosions (see [252], with references therein). Meanwhile, after the core bounce, a compact remnant begins to form at the centre of the collapsing star, quickly growing through the infalling stellar material. The nascent remnant – the protoneutron-star (PNS) – will evolve to a neutron star [167] or may eventually collapse to a black hole, depending for example on whether the progenitor star had a mass below or above ∼ 25M [91]. By the time the shock stalls, a hot and dense PNS has formed with an average lepton number of Yl . 0.3. It contracts slowly while deleptonizing and cooling as neutrinos of all flavours – µ and τ neutrinos and antineutrinos are created by thermal processes [37] – diffuse through the optically thick regime to less dense, more transparent regions. These neutrinos are emitted on a timescale of the order of ∼ O(1) − O(10) s, which is the timescale of neutrino diffusion (see fig. 1.4, and [106], with references therein). Note that convective processes may enhance this neutrino cooling and boost the PNS luminosity (see, e.g. [56,41]). After several tens of seconds, the compact remnant becomes transparent to neutrinos and the neutrino luminosity drops significantly [42]. Furthermore, there is accretion-driven neutrino emission from the outer layers of the PNS onto which material is accreted through the stalled shock, which is active on 3
Note that it is only for very special combinations of physical parameters such as the stellar model of the progenitor or the compressibility of nuclear matter, resulting in extraordinarily small cores, that the so-called prompt explosion might work (see, e.g., [19, 95]), in which the shock wave at core bounce propagates through the outer core to produce explosions without the shock-stall.
9
1 Introduction
Figure 1.4: The sequence of events in the collapse of a stellar core to a nascent neutron star. It begins with a massive star with an ‘onion-skin’ structure, and goes through core implosion, to core bounce and shock wave formation, to the protoneutron-star stage before explosion, and finally to the cooling and isolated-neutron-star stage after explosion [47]. The black, straight arrows depict mass motion and the curved red arrows depict escaping neutrinos. ‘B.E.’ denotes ‘binding energy’, and ‘?’ stands for the (proto) neutron star structure and composition, which is uncertain [167].
the timescale of the order of O(100) ms until an explosion sets in, i.e. certain mass shells move outwards [138]. All this neutrino emission radiates, as stated previously, about ∼ 99% of the released binding energy and is actually the dominant output of the event which is presumably a gravity-powered neutrino explosion. Note that a small number of neutrinos were already detected from SN 1987A and thus confirm the very basic picture of stellar core collapse [96, 97].
10
1.2 The ‘standard’ paradigm of core-collapse supernovae
The question now arises how this huge reservoir of energy emitted by neutrinos can be tapped in order to ‘revive’ the stalled shock and turn the collapse of the rest of the star into an explosion? This part of the supernova problem has kept astrophysicists busy for more than 40 years (see, e.g., [252] and [106] for relatively recent reviews). Four SNe mechanisms are at present being discussed in literature: a) the so-called delayed, neutrino-driven explosion mechanism, b) the magneto-rotational mechanism, c) the acoustic mechanism, and d) the QCD phase transition mechanism. a) The delayed, neutrino-driven explosion mechanism has the longest pedigree. It was already considered theoretically in the 1960’s by Colgate & White [55], and then numerically ‘discovered’ by Bethe & Wilson [30, 250] in the 1980’s. It is based on the idea that neutrinos streaming off the neutrinosphere of the PNS can revive the stalled shock wave by depositing some of their energy in the layers between the nascent neutron star and the stalled shock front by charge-current νe and ν e captures on free nucleons [30, 250]: νe + n → e− + p ν e + p → e+ + n .
(1.8) (1.9)
The neutrino heating increases the pressure behind the shock and the heated layers begin to expand, creating between the shock front and the neutron star surface a region of low density but rather high temperatures, the so-called ‘hot bubble’. The persistent energy input by neutrinos keeps the pressure high in this region and drives the shock outwards again, eventually leading to an SN explosion. This may take a few 100 ms and requires that during this time a small percentage of the energy radiated in electron flavour neutrinos be converted into the thermal energy of nucleons, leptons, and photons. There is also a threshold of energy that must be deposited in a short time to overcome the ‘ram’ pressure of the infalling matter, which is rapidly accreting [29]. The success of the delayed neutrino mechanism turned out to be sensitive to a delicate competition of neutrino cooling between the neutrinosphere and the so-called ‘gain radius’ on the one hand, and the neutrino heating between the gain radius and the shock on the other hand (see [106], with references therein). The gain radius is defined as the radial position where the neutrino heating rate per nucleon and the neutrino cooling rate per nucleon become equal. However, spherically symmetric state-of-the-art simulations agree that no delayed explosions can be obtained with this mechanism in the general case [138,134]. Only for stars with a birth mass of ∼ 8 − 10M – which instead of an iron core develop a O/Ne/Mg core with a thin carbon shell, surrounded by an extremely dilute and only loosely-bound He-shell – was neutrino heating found to power explosions in one-dimensional simulations (e.g., [115, 74]). Recent multidimensional simulations suggest that the neutrino heating mechanism might work in combination with hydrodynamical instabilities, namely convection (see, e.g., [94, 107]) and the standing-accretion-shock instability (SASI; see e.g., [40, 104, 148, 164] and [203], with references therein). Both hydrodynamic instabili-
11
1 Introduction ties combined stretch the advection time of matter accreted through the neutrinoheating layer and thus enhance the neutrino energy deposition in support of the neutrino-driven explosion mechanism [203]. Recent, computationally demanding, axisymmetric (2D) simulations by the Garching group for example produced weak explosions for 11.2M and 15M progenitor models [41, 148] in this fashion. SASI/convection-aided neutrino driven explosions are in a sense appealing because they bear the potential to explain a variety of physical properties related to the remnants of stellar core collapse. Since they produce highly anisotropic explosions, the SASI can lead to a large recoil of the newly-born neutron star in the direction opposite to the stronger mass ejection, producing a neutron star kick up to ∼ 1000kms−1 (see, e.g., [204]), which is in agreement with the measured proper motions of young pulsars. Three-dimensional simulations have revealed the possibility of an unstable l = 1, m = 1 spiral SASI mode that can create a strong rotational flow in the vicinity of the accreting neutron star, thus providing a possible mechanism for the generation of neutron star spin [33]. Moreover, the globally asymmetric onset of the explosion with sizeable initial shock deformation triggers strong hydrodynamical instabilities at the composition interfaces of the progenitor when the shock propagates outwards to the stellar surface. This leads to large-scale element mixing in the exploding star, as observed in context with SN 1987A (see, e.g., [89], with references therein). However, even though different research groups agree on the presence, necessity and functionality of the hydrodynamical instabilities mentioned, the 2D results obtained by different groups, which apply similar input physics, but different numerical methods, do not converge for the time being (cf. [148] with [45]) 4 . In addition, note that both convection as well as the SASI are genuine three-dimensional phenomena. Hence, fully self-consistent 3D calculations with sophisticated energydependent neutrino transport are indispensable for judging about the viability of the neutrino heating mechanism [106], but are still pending. b) The magneto-rotational mechanism probably only works in the case of rapid rotation. Combined action of flux-freezing, field winding [151] and also of the magnetorotational instability MRI [24] during collapse and the postbounce phase generally may lead to the growth of magnetic fields by many orders of magnitude to values where the magnetic pressure becomes comparable to matter pressure. This, in turn, triggers a collimated, bipolar jet-explosion (see, e.g., [43], and references therein) by converting magnetic energy into kinetic energy [131, 120, 43, 156, 227, 208]. Alternatively, the magnetic fields could also convert the free energy of the differential rotation of the forming compact remnant to kinetic energy of the SN ejecta by viscous heating behind the shock in addition to the energy input there by neutrinos [231]. The magneto-rotational mechanism may also be relevant in the context of long-soft gamma ray bursts (see, e.g., [254]). c) The acoustic mechanism of Burrows at al. [45,46] requires the excitation of strong 4
Note that contrary to the multi-D case, spherically symmetric state-of-the-art codes yield converging results, as was shown, for example, in a comparative study with the Vertex and Agile-Boltztran codes [134].
12
1.3 Gravitational waves l = 1 g-mode oscillations by turbulence and SASI-modulated accretion downstreams. The large-amplitude core motions then create powerful sonic activity in the neutron star surroundings by which energy is transported to the shock, driving the explosion at relatively late times (t & 1s after bounce). The source of this energy is the gravitational binding energy of the accreted gas, converted to sound by the rapidly ringing neutron star, which thus acts like a transducer. Even though this mechanism appears to be sufficiently robust to blow up even the most massive progenitor stars, it remains the most controversial mechanism. It has so far not been confirmed by other groups, and there exist even strong ‘analytical’ arguments against its existence [245]. d) The transition from baryonic to quark matter, a so-called QCD phase transition, may power a secondary shock wave which triggers a successful hydrodynamical explosion, as reported by [225,81], and recently also [166] and [198]. The beauty of this mechanism is that it is able to explode stars more massive than ∼ 8 − 10M even in a spherically symmetric setup. The main drawback is that the way the explosion is triggered relies on a rather phenomenological-, and not self-consistent description of quark matter (see [198], with references therein). Up to now, there is a consensus among theorists that there is no agreement on the CCSN explosion mechanism. The CCSN mechanism – if there is a unique one – may eventually involve a combination of all the outlined mechanisms, as stated e.g. in [182]. Hence, a more decisive answer with respect to the theoretically operating explosion mechanism may only be given once future 3D numerical models can incorporate all the relevant input physics known at present, i.e. full Boltzmann neutrino radiation transport, magnetic fields, general relativity, a physically well-motivated way of describing nuclear matter at ‘high’ densities, and multi-dimensional progenitor star models that consistently include rotation and magnetic fields.
1.3 Gravitational waves Einstein’s theory of General Relativity (GR) [64, 63] teaches us that space and time are not separate entities, but join as ‘spacetime’. The field equations of GR connect matter dynamics to the curvature of spacetime and describe gravity as the curvature of a four-dimensional spacetime (one temporal and three spatial dimensions) [126]. In the framework of relativity, gravity must be causal: any change to a gravitating source must be communicated to distant observers at a speed no faster than the speed of light c. This leads immediately to the idea that there must exist some notion of ‘gravitational radiation’ [76]. The first calculation of gravitational waves (GWs) is due to Einstein himself [65]. His final result stands today as the leading-order quadrupole formula for gravitational wave emission. This formula plays a role in the theory of gravity analogous to the dipole formula for electromagnetic radiation, showing that GWs arise from accelerated masses [157], exactly as electromagnetic waves arise from accelerated charges [105]. The quadrupole formula implies that GWs are very difficult to produce in the fabric of space-time [235] – very large masses and relativistic speeds are needed. This follows from the weakness of the
13
1 Introduction gravitational interaction and coupling to matter compared to the other forces of the standard model of physics [246]. The only objects which are possibly massive and relativistic enough to emit detectable GWs are of astrophysical origin, as outlined in the review of Sathyaprakash and Schutz [39]. Due to the weakness of GWs at astronomical distances so far no one has found direct evidence of their existence. Nevertheless, Russell Hulse and Joseph Taylor found indirectly indications of their reality by observing the inspiral of the binary system PSR 1913+16, which was discovered in 1974 [101]. Several decades of observation have shown that the orbit is decaying and that the decay rate matches with very high precision GR’s prediction for such decay due to loss of orbital energy and angular momentum due to GWs. For this achievement, Russell Hulse and Joseph Taylor were awarded the Nobel Prize in Physics in 1993. However, even though their studies proved beyond a reasonable doubt that GWs exist, it still remains an open task to detect GWs directly and – even more important – exploit them as a tool for astronomy. Today, the understanding of the cosmos depends more or less entirely on the observations of electromagnetic waves, cosmic rays and marginally on neutrinos [235]. The information that GWs could carry to us would be almost orthogonal to that carried by electromagnetic waves [39]. While gravitational radiation arises from bulk matter of dense concentrations of mass and energy, ratio waves find their origin in the acceleration of individual electric charges, showing the thermodynamic state of optically thin concentrations of matter. While electromagnetic waves show us the surface of their astrophysical source (e.g. atmospheres of stars, accretion disks, clouds of interstellar gas), GWs could provide access to high density regimes such as the innermost, central part of a CCSN [174, 119], which is hidden behind a dense layer of stellar gas and whose temperatures and densities exceed the range that is easily accessible by terrestrial experiments [137]. Today, technology has brought us to the point where detectors are beginning to set interesting upper limits on the GWs of some sources (see, e.g., [14,23]), and there is reasonable hope that the first direct detection will be made in the not too far future. In this section, I will outline and review the linearized GR. Moreover, I will summarize some basic physical properties of gravitational radiation, GW generation in the weak-field, slow-motion limit by essentially-Newtonian matter sources. Moreover, I will touch on the methods for detecting GWs (see, e.g., [14, 23]). The discussion below is based on my Project- and Master Thesis ( [205], with references therein), where I summarized the subject in great detail. In addition, I have used the book by Misner, Thorne & Wheeler [157], Thorne’s review, published in [233], the review by Flanagan and Hughes [76] and Ott’s PhD Thesis [182]. Throughout this section, I use cgs units, carrying along all factors c and G. The signature of the metric gµν is, as in [157], chosen to be (−1, 1, 1, 1). Greek indices run from 0 to 3, Latin ones from 1 to 3, and the Einstein summation convention is followed. Partial derivatives of any tensor T α1 ...αn with respect to any coordinate xα are denoted by T α1 ...αn ,α
14
1.3 Gravitational waves
1.3.1 The linearized Einstein field equations The Einstein equations express the non-linear relation between spacetime curvature and the energy-matter fields and are given by 1 8πG Gµν = Rµν ≡ gµν R = 4 Tµν , {z2 } | c {z } | ‘Geometry 0
(1.10)
‘Energy 0
where all tensors are symmetric. Gµν is the Einstein tensor, Tµν is the stressenergy tensor describing the matter and electromagnetic components of spacetime. R = Rρρ is the Ricci scalar, and Rµν is the Ricci tensor, obtained via the contraction ρ Rµν = Rµρν of the Riemann curvature tensor which is given by σ Rµρν = Γρµν,ρ − Γρµρ,ν + Γστρ Γτµν − Γστν Γτµρ .
(1.11)
The Christoffel symbols themselves are defined in terms of the metric: 1 Γσµρ = g στ (gρτ,µ + gµτ,ρ − gµρ,τ ) . 2
(1.12)
Note that eqs. 1.10-1.12 are covariant, which means that they are independent of the choice of coordinates. In GR, all coordinate systems and reference frames are treated as equivalent. Thus, there is no such thing as global inertial frames known in Newtonian theory. Despite the superficial simplicity of eq 1.10, the Einstein equations form a complicated set of 10 coupled non-linear partial differential equations which have closed analytical solutions only for the most idealized physical settings such as the static spherically, or the stationary axisymmetric situation: the Schwarzschild or the Kerr solutions. In most astrophysical scenarios it is thus necessary to solve the Einstein equations numerically in ways outlined for example in the review by Baumgarte and Shapiro [28]. However, in regions of spacetime where the curvature is only small, it is possible to simplify the Einstein equations by a so-called linearization. In linearized gravity, the metric gµν may be treated as deviating only slightly from the flat Minkowski metric ηµν = diag(−1, 1, 1, 1): gµν = ηµν + hµν ,
(1.13)
khµν k � 1 .
(1.14)
demanding that Here hµν is the metric perturbation. Note that the condition khµν k � 1 requires both the gravitational field to be weak and the coordinate system to be approximately Cartesian. In the linearized theory of gravity, we only keep terms linear in hµν . Higher order terms are discarded. As a consequence, indices are raised and lowered by the flat metric ηµν . Note that since we use ηµν to raise and lower indices, spatial indices can be written either in the ‘up’ position or the ‘down’ position without changing the value of a quantity: f a = fa . However, raising or lowering a time index switches sign: f t = −ft . The metric perturbation hµν thus transforms under Lorentz transformations, but not under general coordinate transformations.
15
1 Introduction In order to find the Einstein equations in the linear limit, we have to compute all the quantities which are needed to describe linearized gravity by dropping all non-linear terms in hµν . The Christoffel coefficients are now given by Γνµρ =
� 1 ν h µ,ρ + hνρ,µ − hµρ,ν . 2
(1.15)
Having this, the Riemann curvature tensor, 1 Rµναβ = (hµβ,να + hµα,νβ − hµα,νβ − hνβ,µα ) , 2
(1.16)
and subsequently, also the Ricci tensor, Rµν =
� 1 α h µ,να + hνα,µ,α − �hµν − h,µν , 2
(1.17)
can be constructed in linearized theory, where h = hαα is the trace of the perturbation, and � = ∇2 − ∂t2 is the d’Alembert wave operator. Contracting once more, the Ricci scalar is given by � R = hρµ ,µ,ρ − �h . (1.18) Building now the Einstein tensor from above’s linearized expressions results in a unwieldy expression: Gµν =
� 1 α h µ,να + hνα,µ,α − �hµν − h,µν − ηµν hρσ ,σ,ρ + ηµν �h 2
(1.19)
One can clean-up the latter eq. 1.19 by two measures. First, the trace-reversed tensor h is introduced: 1 hµν = hµν − ηµν h , (1.20) 2 α α
for which h conditions
= −h holds. Moreover, if one assumes secondly the Lorentz gauge µν
h
,ν
=0,
(1.21)
and applies it in combination with eq. 1.20 to the Einstein tensor, we find that all terms but one in eq. 1.19 vanish. The linearized Einstein equations then reduce to Gµν = �hµν = −
16πG Tµν . c4
(1.22)
1.3.2 Physical properties of gravitational radiation Wave solutions in vacuum spacetimes, GW polarizations and the transverse-traceless (TT) gauge In vacuum (Tµν = 0 everywhere), eq. 1.22 reduces to the simple wave equation µν
�h
16
=0,
(1.23)
1.3 Gravitational waves and admits plane wave solutions: µν
h
= Aµν exp(ikλ k λ ) ,
(1.24)
with the wave vector k λ = (ω/c, ~k). Inserting eq. 1.24 into 1.23 results in kλ k λ = 0, implying that GWs travel along the null geodesics, i.e. at the speed of light c. µν Due to symmetry properties of h , the polarization tensor Aµν has initially ten independent components. Enforcing the Lorentz gauge reduces this to six. A useful specialization of the Lorentz gauge is the so-called transverse-traceless (TT) gauge, which is obtained by choosing a special generator for the gauge transformation (ξ µ ; see [76]) with �ξ µ = 0. This reduces the wave field to two independent physical degrees of freedom which can be identified as polarizations: Aµν kλ = 0 ,
Aλλ = 0 ,
Aµλ U λ = 0 ,
(1.25)
with an arbitrary, light-like (Uν U ν = 0) unit 4-vector U ν . From the TT gauge conditions it follows that the metric perturbation is purely spatial hTµ0T = hT00T = 0 ,
hTij,jT = 0 ,
(1.26)
and traceless h = hii = 0 . Note that since
TT hµν
is traceless, there is no distinction between
(1.27) TT hµν
and hTµνT , i.e.
TT
hµν = hTµνT . In the transverse plane, the dimensionless GW amplitude can now simply be represented by a two-dimensional matrix with only two independent elements h+ and h× : � � h+ h× TT hab = . (1.28) h× −h+ If the coordinate unit basis vectors in this particular plane are eˆx and eˆy , then we can define the basis tensors as e+ = eˆx ⊗ eˆx − eˆy ⊗ eˆy e× = eˆx ⊗ eˆx + eˆy ⊗ eˆy ,
(1.29) (1.30)
where ⊗ is the outer product. The dimensionless gravitational field tensor hTijT of a GW propagating in the positive z-axis can then be written as a linear combination of the two independent, transversetraceless unit tensors that correspond to the two possible polarization modes of GWs: hTijT = h+ e+ + h× e× . (1.31) If the coordinates in the transverse plane are rotated by an angle of Ψ, one obtains new amplitudes h0+ and h0× given by h0+ = cos 2Ψh+ + sin 2Ψh× h0× = − sin 2Ψh+ + cos 2Ψh× .
(1.32) (1.33)
This shows that a rotation by π/4 changes one polarization into the other (see fig. 1.5), implying that gravitational radiation possesses helicity 2 [157].
17
1 Introduction
Figure 1.5: The lines of force for a purely + GW (left), and for a purely × GW (right). Note that the names are derived from the shape of the equivalent force fields that they produce. Figure taken from [16].
1.3.3 The weak-field, slow-motion limit Gravitational waves are generated by the matter source term on the right hand side of the linearized Einstein equations (see eq. 1.22). The solution to this inhomogeneous wave equation is found in analogy to electromagnetic theory [105] via the convolution of the inhomogeneity in eq. 1.22 with a time-retarded Green’s function G(t, ~x, t0 , ~x0 ). The Green’s function associated with the wave operator � is [105] G(t, ~x, t0 , ~x0 ) = −
δ(t0 − |~x − ~x0 |/c) , 4π|~x − ~x0 |
(1.34)
where t − |~x − ~x0 |/c is the retarded time, emphasizing the causal nature of GWs. It takes into account the lag associated with the propagation of information from events at ~x to position ~x0 . Applying eq. 1.34 to eq. 1.22, the solution is given by hTijT (t, ~x)
�
4G = c4
Z
3 0 Tij (t
dx
− |~x − ~x0 |/c, ~x0 ) |~x − ~x0 |
�T T .
(1.35)
Note that, as already mentioned, the radiative (physical) degrees of freedom are contained entirely in the spatial part of the metric, projected transverse and traceless. The latter quantity (eq. 1.35) can now be evaluated at large distances from the source. Under this assumption, we may expand |~x − ~x0 |−1 ≈ r−1 , where r is the distance from the observer to the source. Moreover, the source will conform to the weak-field limit ( GM � 1, with M, R being the mass and extent of the source) and to c2 R the slow-motion approximation (|~v | � c, where ~v is the velocity of internal motions of the source). In these limits and after some mathematical manipulations, this expansion (in powers of ~x~x0 ) yields in lowest order the so-called quadrupole formula hTijT (t, ~x)
18
� � ��T T 2G ¨ |~x| = 4 Iij t − , cr c
(1.36)
1.3 Gravitational waves where I¨ij is the second time derivative of the mass quadrupole moment, defined as Z Iij := d3 x0 ρ(t, ~x0 )x0i x0j . (1.37) In order to match the right hand side of eq. 1.37 with the transverse-traceless gauge conditions, we first have to subtract the trace from Iij : 1 tij = Iij − δij I , 3
I := Iii ,
(1.38)
which is the so-called reduced mass quadrupole tensor. Moreover, to complete the derivation, we must project out the non-TT pieces of the right-hand side of eq. 1.36. Having the projection tensor 1 Pijkl = Pik Pjl − Pij Pkl , 2
where
Pij = δij −
xi xj , |~x|2
(1.39)
we can write out the standard quadrupole formula (SQF): hTijT (t, ~x) =
2G ¨klT T (t − |~x| ) . P t ijkl c4 r c
(1.40)
Note that higher-order terms are strongly suppressed by powers of 1/c and thus not considered anywhere in this thesis (see, e.g., [234, 32, 158]). It should be clear from the TT projection operation that the emitted radiation is not isotropic: it will be stronger in some directions than others. It should also be clear from this that spherically-symmetric motions do not emit gravitational radiation; when the trace is removed, nothing remains. This fact is independent of the quadrupole approximation and known as Birkhoff ’s theorem, which states that any spherically symmetric solution of the vacuum field equations must be stationary and asymptotically flat. This means that the exterior solution must be given by the Schwarzschild metric [157]; as direct consequence, no monopolar gravitational radiation can exist. At this point, it is wort mentioning that similarly to electrodynamics, there are in principle two sets of moments in the GW expansion: moments of mass distribution ρ and moments of mass current distribution ρv [234], where v is the velocity (cf. electrodynamics, where electric and magnetic moments exist [105]). The mass-dipole moment as well as the mass-current dipole moment (the subsequent expansion terms next to the monopole term) will not produce any kind of gravitational radiation due to conservation of momentum and angular momentum in an isolated system. Thus, gravitational radiation of a leading order must be of a quadrupolar nature [157]. Note moreover that the prefactor G/c4 in eq. 1.40 turns out to be O(10−50 ) – a very small number. Hence, in order to generate interesting amounts of GWs, the quadrupole moment’s variation must be enormous. The only interesting sources of GWs will be those which have very large masses undergoing extremely rapid variation; even in this case, the typical GW strains we expect from such sources are tiny [39]. This reflects the fact that gravity is the weakest of the fundamental interactions [246].
19
1 Introduction Finally, there are several issues related to the SQF (eq. 1.40) and its use, which need to be mentioned: a) The quadrupole formalism to extract the gravitational radiation is not gauge invariant and only valid in the Newtonian slow-motion limit. However, it was shown by [219] that the method above seems to be sufficiently accurate compared to more elaborate techniques, as it preserves phase while being off in amplitude by ∼ 10% in neutron star pulsations. b) GWs extracted by the SQF live only in the distant wave zone [157], that is, they are fully formed and linear. From electrodynamics [105] it is known that waves that are very close to their source do not yet have their asymptotic shape. The same is true for GWs. Moreover, since GR is a non-linear theory, GWs also interact strongly with curvature near their source. Note that there exist elaborate techniques such as post-Newtonian expansions which in principle allow for an extension of the SQF to regions of space-time where the pure weak-field slow-motion approximation breaks down [157, 76]. However, this is beyond the scope of my thesis. c) The SQF contains second time derivatives of the mass quadrupole tensor which are numerically cumbersome, related to numerical high-frequency noise and the r2 momentum-arm, which make the performance of a direct numerical evaluation of eq. 1.40 poor, as discussed in [71]. Therefore, in my simulations I use alternative expressions of [32] and [71] where one or both time derivatives of the quadrupole moment are transformed into hydrodynamical variables that are known from the core collapse simulation. I will outline this issue in more detail in subsection 1.4.
1.3.4 Gravitational wave detectors Physics is after all an empirical science. The simulations I carried out during the course of my PhD studies were aimed at producing GW forms which might help to measure and/or interpret future detector output which is generated by a CCSN. Hence, in this subsection I will give an overview of the ongoing experimental efforts to observe GWs with earth-based facilities. Interaction of gravitational waves with matter Before I start with describing ground-based detector facilities, it is necessary to explain how GWs act on matter, since this in consequence influences the design of the experimental set-up. In GR, the Newtonian expression of the gravitational force is replaced by the idea that freely falling bodies follow geodesics in spacetime. Given a spacetime metric gµν and a set of spacetime coordinates xµ , the classical equation of motion is replaced by ν σ d2 xµ µ dx dx + Γ =0, (1.41) νσ dτ 2 dτ dτ where τ is the proper time measured by an observer travelling along the geodesic. If we specialize again to linearized theory, with the non-flat part of the metric dominated by a GW in TT gauge, and assume moreover non-relativistic motions for
20
1.3 Gravitational waves the test body (v � c), eq. 1.41 simplifies to d2 xi + Γi00 = 0 . 2 dt
(1.42)
In linearized GR and the TT gauge, Γi00 = Γi00 =
� 1 2∂t hTj0T − ∂j hT00T = 0 , 2
(1.43)
since hTµ0T = 0. Hence, we find that d2 xi /dt2 = 0. This does not mean that GWs have no effect; it simply tells that in the TT gauge the coordinate location of a slowly moving, free falling body is unaffected by the GW. In essence, the coordinates move with the waves. The proper separation between two freely falling particles on the other hand oscillates, even if the coordinate separation is constant. This can be best seen if we consider two spatial freely falling particles, located at z = 0, and separated on the x axis by a coordinate distance Lc [76]. For simplicity, we assume a GW in the TT gauge that propagates down the z axis, hTµνT (t, z). The proper distance L between the two particles in presence of the GW is given by Z Lc Z Lc p (1.44) L= ds = dx (1 + hTxxT (t, z = 0)) , 0
0
where the infinitesimal line element ds is ds2 = gµν dxµ dxν = (ηµν + hµν ) dxµ dxν . Eq. 1.44 can be approximated by � � � Z Lc � 1 TT 1 TT L≈ dx 1 + hxx (t, z = 0) = Lc 1 + hxx (t, z = 0) . 2 2 0
(1.45)
(1.46)
Expression 1.46 tells that the proper separation between the two test particles oscillates with a fractional length change ∆L/Lc which is proportional to the gravitational wave strain: 1 ∆L = hTxxT (t, z = 0) . (1.47) Lc 2 Notice that although I applied the TT gauge in order to perform this calculation, the result is gauge independent [76]. Any attempt to measure GWs thus must be based on the fact that the physical distance ∆L between two point masses will undergo changes when a wave passes them, since they act tidally, stretching and squeezing space and thus any object they pass through. Figure 1.5 shows this behaviour in a more general case: the two polarizations of a GW and the lines of force associated with them. In contrast to electromagnetic radiation, the wavelength of GWs is typically comparable or larger than the size of the radiating source. GWs are generated by the bulk dynamics of the source itself such as the motion of neutron stars in a binary system. In consequence, GWs cannot deliver an image, since the radiation simply does not resolve the generating system. However, since GWs are coherent, they probe, in
21
1 Introduction analogy to sound, the two polarizations which carry a stereophonic description of the source’s dynamics. Another extremely important consequence of the coherency mentioned is that the direct observable of gravitational radiation is the GW strain hT T , being an amplitude, falls off by ∝ 1/r. This contrasts with electromagnetic radiation whose observables are in most cases energy fluxes and hence fall off with ∝ 1/r2 . This means that relatively small improvements in the sensitivity of GW detectors can have a large impact on science: doubling the sensitivity of a detector doubles the distance to which sources can be detected, increasing the volume of the Universe to which sources are measurable by a factor of 8. In contradiction to electromagnetic astronomy, which is based on deep imaging of small fields of view, GW astronomy is an all-sky affair: GW detectors have nearly a 4π steradians sensitivity to events in the sky [14]. This means on one hand that any source in the sky will be detectable, but on the other hand also that the ability of a single detector to localize a source is not good at all. However, having a network of GW observatories operating widely scattered over the globe improves the situation drastically. Sky location and the simultaneous measurement of the distance to the source follows from triangulation of time-of-flight differences between separate detectors [242,39,23,13]. From these general considerations, we now turn to more specific details. The ‘known’ sources of GWs cover 22 decades of frequencies, ranging from ∼ 10−18 Hz (inflationary universe) up to ∼ 104 Hz (e.g. neutron star mergers; for a review of GW sources, see e.g., [39], with references therein). The high-frequency band, 1Hz . f . 104 Hz [76, 39, 233], can be targeted by ground-based detectors, while lower frequencies can only be accessed via spaceborne facilities for reasons which will be given later in this subsection. Note that I will restrict myself from now on to the discussion of earth-based facilities and their performance, because the GW signature of stellar core collapse falls into this particular frequency range, as can be seen by the following simplistic, but nevertheless very useful estimates: for compact sources such as a core-collapse supernova, typical GW properties such as the GW amplitude at a given distance r, or the typical frequency of emission can be related to the source’s size R and mass M by dimensional analysis and the quadrupole formula (eq. 1.40). Here, R means the length scale over which the source’s dynamics vary. The ‘natural’ GW frequency fGW of such a source, and its inverse, the dynamical timescale τdyn , can be estimated by [76, 157] r characteristic size R R R3 τdyn := ∼p = . (1.48) mean velocity GM GM/R Using the estimate of eq. 1.48 and applying the quadrupole formula (eq. 1.40), a first order-of-magnitude estimate for the dimensionless GW strain can be made [157]: |hT T | ∼
2G M R2 . 2 rc4 τdyn
(1.49)
If we assume in eq. 1.49 values which are representative for a Galactic stellar core collapse, namely M ∼ 1M , R ∼ 1500km, and r = 10kpc, then we obtain as a
22
1.3 Gravitational waves
Figure 1.6: Strain sensitivity of the AU RIGA detector (Istituto Nazionale di Fisica Nucleare [5]). The cryogenic ‘bar’ detector AU RIGA is possibly the most sensitive and stable detector of this kind continuously on the air. The figure is courtesy of Massimo Cerdonio, private communication (April 2010). rough estimate |hT T | ∼ O(10−21 ). Results which I will present later in this thesis, namely in chapters 3 and 4, verify such value as the right order of magnitude. With the aid of the simplistic arguments above, the extreme requirements upon GW detector sensitivity and the related experimental challenges become obvious: measuring a fractional change in length of order O(10−21 ) translates into determining the distance from earth to moon with the incredibly high precision of several atomic nuclei. Earth-based gravitational wave detectors are divided into two classes, namely resonant mass detectors and interferometric detectors. In the following, I will outline the basic functionality and strategies of the present detector systems/classes in operation.
Resonant-mass detectors The first attempts to detect GWs in a laboratory were made by Joseph Weber in 1960 by building two cylindrical aluminium resonant-mass detectors, operating at room temperature, a resonance frequency of ∼ 1660Hz, and a strain sensitivity of ∼ 10−15 [244]. Nowadays, resonant bar detectors are still constructed Weber-like; however, going to cryogenic- or even ultracryogenic temperatures has improved their sensitivities by many orders of magnitude.
23
1 Introduction A typical resonant bar detector consists of a cylinder of very high-Q 5 material such as aluminium or niobium, a length l ∼ 3m, and a mass of M ∼ 2000kg, and possesses a resonance frequency of ∼ 1kHz (for a summary of properties of resonant-mass detectors in operation in 2005, see [48]). As a basic principle of operation, one exploits the fact that the fundamental longitudinal frequency of such a bar is very sharply defined, allowing for the resonant driving of mechanical oscillations by incident GWs at the bar’s resonant frequency and in a narrow bandwidth of ∼ 100Hz around it (see fig. 1.6). A GW burst with h ∼ 10−21 will make the bar vibrate with an amplitude ∆LGW ∼ hL ∼ 10−21 m .
(1.50)
The elastic vibrations of the mass are measured by means of a transducer that converts the displacement into an electric signal, which is then amplified [20, 233, 157]. To be able to measure this, the experimentalists have to fight against three main sources of noise [39] 1. Thermal noise: This is due to the Brownian motion of the detector atoms. The root mean square amplitude of this motion is 1/2 h∆LiT h
� =
kT 2 4π M f 2
�1/2 .
(1.51)
At room temperature, the rms amplitude of the Brownian vibration is of the order of 10−16 m [20]. The most advanced bar detectors such as AURIGA (Legnaro, Padova, Italy) and NAUTILUS (Frascati, Rome, Italy) operate today at ultracryogenic temperatures of T = 100mK and very high Q-values of Q ∼ 106 − 107 [5, 11]. Under these circumstances, the rms amplitude of vibration is lowered to ∼ 10−18 m. Moreover, the fundamental mode changes its thermal amplitude of vibration in a random walk with very small steps, taking a time Q/f ∼ 1000s to change by a full amount. For a 1ms GW burst at resonance frequency, the thermal noise will have random-walked to an expected amplitude change (1000s/1ms)1/2 = Q1/2 times smaller [20, 39]: 1/2 h∆LiT h,1ms
� =
kT 4π 2 M f 2 Q
�1/2 .
(1.52)
Thus ultracryogenic resonant-mass detectors can have a thermal-noise limited strain sensitivity of ∼ 6 × 10⁻²¹ m [39]. 2. Sensor noise: A transducer converts the bar’s mechanical energy into electrical energy and an amplifier increases the electrical signal level to record it. Both components introduce noise, limiting the sensitivity to narrow regions 5
Note that a high-Q (quality) factor is important, since it causes a lower rate of dissipation relative to the stored energy of the oscillator; the oscillations hence die out more slowly. Oscillators with high quality factors have low damping so that they ring longer [86].
24
1.3 Gravitational waves near the resonance frequency f . However, state-of-the art transducer-amplifier units allow for resonant-mass detector bandwidths of not only 10 [48], but more than 100Hz, as displayed in fig. 1.6. 3. Quantum noise: The zero-point vibrations of a bar with a resonance frequency of 1kHz are given by Heisenberg’s uncertainty principle [20, 39]: 1/2 h∆LiQuant
� =
~ 2πM f
�1/2
∼ 4 × 10⁻²¹ m .
(1.53)
This number is comparable to the thermal limits over 1ms. So, as detectors improve their thermal limits, they run into the quantum limit, which must be breached before a signal at 10−21 can be seen with such a detector. From the discussion above, it becomes clear that bar detectors have great difficulty in achieving the sensitivity goal of 10−21 . Nevertheless, the excellent sensitivity of resonant detectors within their rather narrow bandwidth makes them suitable for specialized searches such as for GWs from so-called low T/|W| instabilities [243], as shown in fig. 3.22 in sec. 3.5. However, funding for bar detectors at present (2010) is very restricted, because there is a more promising detector design: laser interferometry. Currently, there are only two remaining bar detectors, NAUTILUS and AURIGA. They might eventually be shut down in the near future, when the interferometers begin operating at sensitivities clearly better than 10−21 . It is however important to keep them on air at least until 2014, when all the large interferometric detector systems, currently shut down due to major sensitivity upgrades [242], are back in operation. In the words of Massimo Cerdonio (April 2010): rather be shortsighted than blind. Interferometric detectors The first seeds of the idea for laser interferometer GW detectors were already planted in the 1960’s and 1970’s, since already at that time the limitations of bar detectors were apparent (see e.g., [82, 159, 247, 31]). As a basic principle of operation, interferometric GW detectors use laser light to measure changes in the difference between the length of two perpendicular arms. This design is, in contrast to the bar detectors, intrinsically wide-band [16]. The experimental set up is very much like that of a two-armed Michelson Interferometer, as shown in fig. 1.7. An injected laser beam is split into two components which then travel at right angles to each other down separate arms. The beams bounce off polished test masses/mirrors at the end of each arm and return to their starting point, where they interfere with one another. The interferometer is set up so that in its default mode the laser beams interfere destructively and there is no net output. A passing GW would make one arm slightly longer and the other shorter, which induces a relative phase shift in the arm light, seen as a change in intensity at the output of the detector. In general, both the + and × polarization of incident GWs influence the test masses. A general detector output h(t) can then be written as a
25
1 Introduction
Figure 1.7: Schematic view of a laser light interferometric GW detector. Figure taken from [16]. time series:
∆L = F+ h+ (t) + F× h× (t) + n(t) = h(t) , (1.54) L where L is the detector arm length. The instrument response is a convolution of the antenna patterns F+,× with the two GW polarizations. The antenna patterns depend on the frequency and sky location of the source, and n(t) marks the instrument noise [233]. From astrophysical models (see eq. 1.49), we know that h ∼ 10−21 strain sensitivity is required. With the current displacement sensitivities of ∆L ∼ 10−18 m, a detector should thus have an arm length of ∼ 1 − 10km in order to achieve the desired sensitivity. This is the actual scale of the interferometers which are in operation. The sensitivity of the interferometer thus depends on the arm length, but also on the amount of light energy stored in the arms (see [20], with references therein). Furthermore, note that all the main interferometric optical components and beam path are enclosed in an ultra-high vacuum system (10−8 − 10−9 Torr) for acoustical isolation and to reduce phase fluctuations from light scattering off residual gas [14]. More detailed reviews of the interferometric detector design can be found in [233, 201, 108, 39]. Like the resonant mass detectors, interferometers are also plagued by different kinds of noise which put limits upon the sensitivity of the instrument (see fig. 1.8). The main sources of noise competing with physical signals are [20, 39]: 1. Seismic noise. External mechanical vibrations lead to displacements of the mirrors that are many orders of magnitude larger than the expected signal. Seismic noise is the limiting noise below ∼ 10 Hz (see Fig. 1.8). Above this value, a combination of active filters (piezo-electric actuators), passive filters (alternate layers of steel and rubber) and a multi-stage pendulum suspension of the optical components allow effective filtering. 2. Thermal noise. As with bar detectors, Brownian motion of the mirrors and the excitation of the violin modes of the suspension can mask GWs. Thermal
26
1.3 Gravitational waves
Figure 1.8: Strain sensitivity of LIGO, its limiting noise sources, and the strain sensitivity of Advanced LIGO. These curves are for unity signal to noise in strain amplitude in a one-hertz bandwidth, for a single instrument. The sensitivity curves are for an optimally incident wave in position and polarization; no averaging over position is given. Note that for Advanced LIGO, there is an adjustable frequency response, labelled as ’NSNS’, which is a narrow-band tuning, and ’Burst’, which corresponds to broad-band tuning. The LIGO data are courtesy of D. Shoemaker (2007). noise is the limiting noise between 50 and 250Hz. 3. Shot noise. The photons that are used to do interferometry are quantized and so arrive at random and make random fluctuations in the light intensity that can look like a GW signal. The more photons one uses, the smoother the interference√signal will be. As a random process, the measurement error improves with N , where N is the number of photons. The shot noise related error displacement is given by [20] � �1/2 ~c λ , (1.55) δlshot = 2π ηP where η is the efficiency of the photodiode, λ the laser wavelength and P the circulating light power. In order to obtain h < 10−22 , ηP ∼ 1kW is required. Photon shot noise is the principal limitation to sensitivity for frequencies above
27
1 Introduction 250Hz, as shown in fig. 1.8. Today, the interferometric detectors operate with lasers of 10W output, and the necessary high light power is obtained via resonant cavities and beam recycling [14]. 4. Quantum effects. Shot noise is a quantum noise, and like all quantum noises there is a corresponding conjugate noise. As the laser power is increased to reduce the shot noise, the position sensing accuracy improves, and one eventually comes up against the Heisenberg uncertainty principle ∆x∆p > ~. For present-day detectors, this corresponds to hqu ≈ 10−25 [20]. 5. Gravity gradient noise. Changes in the local gravitational field act like tidal forces on a GW detector. This environmental noise comes from human activities, but also from atmospheric activity such as clouds or the surf of the sea [39]. These effects become dominant at low frequencies and are the primary reason why the detection of GWs in the frequency band below 1Hz cannot be done with earth-based detectors, but must be done in space [14]. In order to be able to probe GW sources at frequencies below . 1Hz, two major projects, namely the Laser Interferometer Space Antenna (LISA), a joint project of the ESA and NASA [2,102], and the Japanese DECIGO (DECi-hertz Interferometer Gravitational wave Observatory, [113]) are scheduled for launching in 2018 (LISA), or probably later, depending on the funding situation [39]. Today, the major projects for large interferometers are [39, 248] (see fig. 1.9): • LIGO. The Laser Interferometer Gravitational wave Observatory [14,10] consists of three operating systems: A single 4km interferometer in Livingston (Louisiana, USA), as well as a pair of interferometers (4km, 2km) in Hanford (Washington, USA). • VIRGO. VIRGO is a 3km French-Italian detector near Pisa, Italy [17, 7]. • GEO600. GEO600 is a 600m interferometer, constructed in a GermanEnglish joint project near Hannover, Germany [144, 1]. • TAMA300. TAMA300 is a 300m interferometer operating near Tokyo [4,226]. Note that all these sites are well separated, which supports coincidence analysis. I further point out that there is also a small detector operating in Western Australia, the so-called AIGO (Australian Interferometric Gravitational Observatory [8]). At the moment, it is not clear if a large detector might also be funded. From the point of view of extracting information from observations, however, it would be very desirable to have a large-scale detector in Australia too, because of its very long baselines to the USA and Europe [39]. Within the past few years, the first generation of these interferometers have got very close to or even reached design sensitivity and collected partially coincident data, as discussed in [14]. Lately, the two 4km LIGO detectors were upgraded to sensitivities increased by a factor of 2-3 (enhanced LIGO, see [191]) and resumed observations in 2009 for the S6 science run [10]. S6 is expected to continue until
28
1.4 Gravitational wave extraction in HD- and MHD simulations
Figure 1.9: The interferometric GW projects spread around the globe. Figure taken from [242].
the end of 2010, when the interferometers will be shut down and disassembled in preparation for the installation of Advanced LIGO. Moreover, VIRGO, also, will undergo major upgrades at the same time [242]. The installation of the advanced detectors is expected to be completed by 2014 [10]. This will increase the observable volume by a factor of ∼ 1000. Operating at such a high level of precision, 1 year of initial LIGO data taking will correspond to . 1 day of Advanced LIGO [242].
1.4 Gravitational wave extraction in HD- and MHD simulations In sec. 1.3.3 I introduced and discussed the basics of the linearized GW theory. As pointed out there, I extract the GWs from my magnetohydrodynamical simulations via the quadrupole approximation (eq. 1.40). For relatively weak fields ( cG2 M ∼ 0.1), R and motions (v ∼ 0.1 − 0.2c) encountered in CCSNe, this method works reasonably well, as pointed out in [219] (see sec. 1.3.3). However, since the SQF (eq. 1.40) is numerically cumbersome [71], I will now present expressions for GW extraction which I implemented because they are directly applicable to astrophysical problems. Note that for purposes of convenience, I have slightly changed the notation in the following subsection as compared to subsections 1.3.3-1.3.1.
29
1 Introduction
1.4.1 Alternative formulations of the Standard Quadrupole Formula As a reminder, I start again with the two independent polarisations of the dimensionless gravitational wave field hµν = gµν − ηµν , which in the transverse-traceless gauge are given by 1 hTijT (X, t) = (A+ e+ + A× e× ) . (1.56) r The spatial indices i, j run from 1 to 3 [157]; r is the distance from the source to the observer. Since stellar core collapse proceeds in good approximation spherically, I choose a source-local spherical coordinate frame (r, θ, φ) to describe the two possible GW polarizations. Hence, this time I give the unit polarisation tensors e+ and e× in Spherical and not Cartesian coordinates: e+ = eθ ⊗ eθ − eφ ⊗ eφ e× = eθ ⊗ eφ + eφ ⊗ eθ .
(1.57) (1.58)
In the slow-motion limit [157,71], the amplitudes A+ and A× are linear combinations of the second time derivative of the transverse-traceless mass quadrupole tensor tTijT , as shown in sec. 1.3.3. In Cartesian coordinates, the quadrupole tensor is expressed as � �T T Z 1 G 2 TT 2 2 tij = 4 dV ρ xi xj − δij (x1 + x2 + x3 ) . (1.59) c 3 The polarisation modes can be obtained explicitly from a coordinate transformation, for example for the θθ-component: tθθ = tTijT
∂xi ∂xj . ∂θ ∂θ
(1.60)
This leads to the following non-vanishing components [173]: tθθ = (tTxxT cos2 φ + tTyyT sin2 φ + 2tTxyT sin φ cos φ) cos2 θ + tTzzT sin2 θ − 2(tTxzT cos φ + tTyzT sin φ) sin θ cos θ tφφ = tTxxT sin2 φ + tTyyT cos2 φ − 2tTxyT sin φ cos φ tθφ = (tTyyT − tTxxT ) cos θ sin φ cos φ + tTxyT cos θ(cos2 φ − sin2 φ) + tTxzT sin θ sin φ − tTyzT sin θ cos φ. For convenience I evaluate below the GW amplitudes along the polar axis (θ = φ = 0, denoted as subscript I) TT TT A+I = t¨xx − t¨yy , TT A×I = 2t¨xy ,
(1.61) (1.62)
and in the equatorial plane (θ = π2 , φ = 0, denoted as II) TT A+II = t¨zzT T − t¨yy , TT A×II = −2t¨yz .
30
(1.63) (1.64)
1.4 Gravitational wave extraction in HD- and MHD simulations Note that in axisymmetry, A+I , A×I , and A×II all vanish, leaving only A+II [234]. Since a direct evaluation of eq. 1.59 is numerically problematic, as discussed e.g. in [71] and [32], we apply alternative reformulations of the standard quadrupole formula, in which one or both time derivatives are replaced by hydrodynamic variables using the continuity and momentum equations. In the first moment of momentum density formula [71], one can get rid of one time derivative by making use of the continuity equation [127]: ∂ρ ∂ (ρvi ) =0. + ∂t ∂xi
(1.65)
Inserting eq. 1.65 into eq. 1.40 and integrating by parts, the first time derivative of the quadrupole moment is then � �T T Z G 2 T T t˙ij = 4 dV ρ vi xj + vj xi − δij (v1 x1 + v2 x2 + v3 x3 ) . (1.66) c 3 This first moment of momentum density (eq. 1.66) already greatly reduces the numerical noise in the extracted GW signal [71]. In order to obtain my GW forms numerically, I compute the single remaining time derivative via finite differences in a postprocessing step. One can even go a step further and additionally apply the Newtonian equation of momentum conservation [127], ∂ (ρvi ) ∂ (ρvi vj + pδij ) ∂Φ + = −ρ , ∂t ∂xi ∂xi
(1.67)
in order to get rid of the second time derivative [32]. In eq. 1.67, p stands for the fluid pressure. By virtue of eqs. 1.67 and 1.66, the so-called stress formulation [32], t¨ijT T is given by Z G TT ¨ tij = 4 dV ρ (2vi vj − xi ∂j Φ − xj ∂i Φ)T T , (1.68) c where Φ is the Newtonian gravitational potential. Note that in the simulations I carried out, an effective, GR corrected gravitational potential Φef f is used, which then replaces Φ in eq. 1.68 (see [147] and sec. 2.2.2). I applied both ways of computing the GW signal and compared them by computing the overlap [83] of the resulting waveforms via O(h1 , h2 ) = p
hh1 |h2 i
, hh1 |h1 ihh2 |h2 i Z ∞ ˆ ˆ 2 (f ) h1 (f )h hh1 |h2 i = 4< df . Sh (f ) 0
(1.69) (1.70)
ˆ is the Fourier transform of h, Sh (ν) [Hz−1 ] is the power spectral density of where h the strain noise from a given detector, e.g. LIGO, which was kindly provided by D. Shoemaker (2007, private communication). The results show good agreement with
31
1 Introduction
Model
Ωc,i [rads−1 ]
R1E1ACL R3E1ACL R4E1ACL
0.3 2π 3π
Overlap 96% 92% 97%
Table 1.1: Overlap of GW trains from representative models R1E1CAL , R3E1CAL and R4E1FCL (see chap. 3, and [206]). numerical deviations of a few percent, as displayed in tab. 1.1. There, I computed the overlap of GW trains from the representative models R1E1CAL , R3E1CAL and R4E1FCL (see chap. 3, and [208]), extracted by using eqs. 1.66 and 1.68. I assume optimal orientation of detector and source as well as the GW to be emitted along the polar axis. In [122], it was pointed out that magnetic fields as strong as O(1017 )G can affect the GW amplitude considerably. Thus, in order to calculate the contribution to the GW signal due to ‘strong’ magnetic stresses (see e.g. [170, 208, 122], and sec. 3.5), I generalized eq. 1.68, taking into account contributions from the magnetic field. Following the 2D axisymmetric derivations of [120] and [170], I accounted for the magnetic field in the SQF by applying the equation of motion of a magnetized fluid [105, 124], ∂ (ρvi ) ∂ (ρvi vj + P? δij − bi bj ) ∂Φ + = −ρ , (1.71) ∂t ∂xi ∂xi is composed of the fluid and magnetic to eq. 1.68. In eq. 1.71, the total pressure √ b2 pressure, P? = p + 2 , where bi = Bi / 4π are the normalized Cartesian components of the magnetic field. The Cartesian quadrupole gravitational wave amplitude in the MHD case, published in [208], then becomes: Z G T T t¨ij = 4 dV [2fij − ρ (xi ∂j Φ + xj ∂i Φ)]T T , (1.72) c where fij = ρvi vj − bi bj . Below, I apply eq. 1.66 if not stated otherwise. Given our spherically-symmetric effective GR approach to the solution of the Poisson equation in most models I computed (cf. chap. 3 and [206, 210, 208]), this expression is best motivated physically, since it does not depend on spatial derivatives of the gravitational potential. Note that the radiative quadrupole moment is a measure of asphericity of the core’s density distribution. It was pointed out by [170] in the purely ‘axisymmetric’ case that the quadrupole moment is positive for a very prolate core, and negative in the limit of a very oblate core. Its first time derivative measures the asphericity of the mass-flux and momentum distribution of the core, and its second time derivative, A+II , is a measure of the asphericity of the forces acting on the fluid. As a rule of thumb, a prolate mass-flux or a prolate momentum distribution (e.g. bipolar jetlike outflow along the rotational axis) gives rise to a positive value of the first time derivative of the quadrupole moment. Forces that act on the core in a way to make
32
1.5 Additional analysis tools it more oblate, such as centrifugal forces, will give rise to a negative contribution to the total amplitude.
1.4.2 Total energy emission and spectral energy density The energy carried away by gravitational radiation can be calculated by the following expression [157]: ��2 Z � � d c3 1 (1.73) Iij − δij Ill dt EGW = 5G dt 3 Z h 2c3 2 2 2 dt I˙xx + I˙yy + I˙zz = 15G −I˙xx I˙yy − I˙xx I˙zz − I˙yy I˙zz i 2 2 2 + 3(I˙xy + I˙xz + I˙yz ) , where Iij = t¨ijT T . The equivalent frequency integral yields [161] Z ∞ h 4c3 2 2 2 EGW = ν 2 dν Iˆxx + Iˆyy + Iˆzz 15G 0 −Iˆxx Iˆyy − Iˆxx Iˆzz − Iˆyy Iˆzz � �i 2 2 2 ˆ ˆ ˆ +3 Ixy + Ixz + Iyz ,
(1.74)
where Iˆij (ν) is the Fourier transform of the quadrupole amplitude Iij (t).
1.4.3 Characteristical GW strain In order to assess the question of detectability of a certain model, I estimate the signal-to-noise ratios (SNR) for optimal filtering searches according to [75]: � �2 Z ˆ Z ˆ ˆ × (ν)|2 |h(ν)|2 |h+ (ν)|2 + |h S =4 dν = 4 dν , (1.75) N Sh (ν) Sh (ν) ˆ where h(ν) is the Fourier transform of the gravitational wave amplitude and Sh (ν) is the power spectral density of strain noise in the detector. For numerical results, I always assume the source to be located at the Galactic centre at R = 10kpc. Moreover, I assume optimal orientation of detector and source. Note also that the Fourier spectra were normalized according to Parseval’s theorem.
1.5 Additional analysis tools Gravitational waves are a result of bulk matter motion [157]. Below, I therefore define a number of quantities and analysis tools which I extracted from my simulation data in order to help me to specify a particular model and allow me to monitor the development of the collective matter dynamics.
33
1 Introduction
1.5.1 The β-parameter A variable commonly used to quantify the dynamics of rotating, Newtonian fluid bodies (see, e.g., [228]) is the dimensionless parameter β, β :=
T , |W |
(1.76)
which is the ratio of rotational kinetic (T ) to gravitational binding energy (|W |). The rotational kinetic energy is given by [86] Z 1 Ωz (xjy − yjx )d3 x , (1.77) T = 2 where ji = ρvi is the specific angular momentum. v ~ = ~r×~ Moreover, based on Ω , the z-component of the angular velocity can be comr2 puted via xvy − yvx . (1.78) Ωz = 2 x + y2
1.5.2 The βmag -parameter In order to track the growth, strength and influence of the magnetic fields on the fluid, I monitor the quantity βmag Emag , |W |
(1.79)
~ 2 Bx2 + By2 + Bz2 |B| = 8π 8π
(1.80)
βmag := which is the ratio of magnetic Emag =
to gravitational binding energy (|W |).
1.5.3 Nonaxisymmetric structures A commonly used way to monitor the growth of nonaxisymmetric structures is to examine the azimuthal Fourier components in the density distribution (see [182], and references therein): ρ(R, z, φ) =
∞ X
Cm (R, z)eimφ ,
(1.81)
m=−∞
where R is the radius orthogonal to the rotational z-axis. The Fourier components Cm correspond to the azimuthal modes m and are defined by Z 2π 1 ρ(R, z, φ)e−imφ dφ . (1.82) Cm = 2π 0
34
1.6 Gravitational waves as messengers of stellar core collapse Furthermore, it is useful to define the normalized amplitudes 1 p Am = |Cm |/C0 = 40 .
(2.126)
In the case of neutrino absorption on neutrons in nuclei, the emissivity is given by
� �1/2 Me2 G2 2 2 0 0 2 nA gA Np (Z)NZ (Z)Fe− (ω + Q ) (ω + Q ) 1 − , j(ω) = π 7 (ω + Q0 )2 (2.127) where Q0 = MA∗ 0 − MA = MA0 − MA + ∆ ≈ µn − µp + ∆ ,
(2.128)
and A is the mean nucleus. The quantity ∆ = MA∗ 0 − MA0 is the energy of the neutron 1f5/2 state above the ground state. In [37] its value is estimated to be about ∼ 3MeV for all nuclei. The resulting absorptivity yields
χ(ω) =
2 G2 nA exp(β[µn − µp − Q0 ])gA2 Np (Z)Nn (N )· π 7 � �1/2 Me2 0 0 2 [1 − Fe− (ω + Q )] (ω + Q ) 1 − . (2.129) (ω + Q0 )2
The derivations of expressions 2.127 and 2.129 neglect nuclear recoil and thermal motions. • Interaction IV (2.110): ν + N � ν + N (isoenergetic neutrino-nucleon scattering, where N is a neutron or proton). Neutrino-nucleon scattering proceeds via the exchange of a neutral Z boson only. In this process, the different neutrino or anti-neutrino flavours will not be distinguished, since the reaction rate is the same for all types. Note that in the derivation of this process, the nucleon recoil and thermal motions were neglected. Expanding the isoenergetic (ω = ω 0 ) scattering kernel in terms of a Legendre series, it yields (approximated by the first two Legendre coefficients): in 1 3 RIS (ω, ω, cos(Θ)){out} = Φ0,IS (ω) + Φ1,IS (ω) cos(Θ) , 2 2
80
(2.130)
2.4 Neutrino transport & transport approximations where cosΘ is the cosine of the relative angle between the incoming neutrino and the outgoing neutrino directions. The zeroth and first moments of the scattering functions are given by � N 2 � 2 N 2 ΦN , 0,IS (ω) = 4πG ηN N (hV ) + 3(hA ) � � 4π 2 2 N 2 ΦN G ηN N (hN , 1,IS (ω) = V ) − (hA ) 3
(2.131) (2.132)
where ηN N accounts for the nucleon final-state blocking,
2d3 pN FN (EN ) [1 − FN (EN )] (2π)3 1 ∂nN . = β ∂µN Z
ηN N =
(2.133)
N The quantities hN V and hA are the neutral nucleon current form factors in the limit of zero-momentum transfer:
1 − 2 sin2 θW , 2 1 = gA , 2 1 = − , 2 1 = − gA , 2
hpV =
(2.134)
hpA
(2.135)
hnA hnA
(2.136) (2.137) (2.138)
where sin2 θW ≈ 0.23 and ΘW the Weinberg angle. The constant G2 here takes the value G2 = 1.2 × 10−65 MeVcm3 s−1 . (2.139) • Interaction V (2.111): ν + A � ν + A (Coherent scattering of neutrinos on nuclei) In the derivation of this process, nuclear recoil and thermal motions were neglected. The isoenergetic scattering kernel (see eq. 2.130) is again expressed by the zeroth and first moments of the scattering functions which are given by:
ΦA 0,IS (ω)
2
= 2πG nA A
2
�
1N −Z CV0 + CV1 2 A
�2
2y − 1 + e−2y · , y2
(2.140)
81
2 3D MHD Core-Collapse Simulations: Implementation and ΦA 1,IS (ω)
2
= 2πG nA A
2
�
�2 1N −Z CV0 + CV1 · 2 A 2 − 3y + 2y 2 − (2 + y)e−2y , (2.141) y3
where y = bω 2 and b ≈ 4.8 × 10⁻⁶ A2/3 MeV−2 . Moreover, Cx0 = 21 (hpx + hnx ) and Cx1 = (hpx − hnx ), where x = V (‘Vector’ ) or A (‘Axial’ ). The constant G is given by eq. 2.139. • Interaction VI (2.112): ν + e− � ν + e− (neutrino electron scattering NES) I first consider the electron-type neutrinos. The first two Legendre coefficients of the scattering kernel, in in 1 {out 3 {out { in } } } 0 0 0 RNout (ω, ω , cos(Θ)) ≈ (ω, ω ) + Φ Φ ES 0,N ES 1,N ES (ω, ω ) cos(Θ) 2 2
(2.142)
are then given by � � Z G2 exp[−β(ω − ω 0 )] 0 Φl,N ES (ω, ω ) = dEe Fe (Ee ) [1 − Fe (Ee + ω − ω )] · πω 2 ω 20 1 � � 2 I 0 2 II 0 × (CV + CA ) Hl (ω, ω , Ee ) + (CV − CA ) Hl (ω, ω , Ee ) , (2.143) in {out }
0
where CV = the value
1 2
+ 2 sin2 (ΘW ) and CA = 12 . The constant G2 in eq. 2.143 has G2 = 1.55 × 10⁻³³ cm3 MeV−2 s−1 .
(2.144)
The functions HlI and HlII for l = 0 and l = 1 are given by relatively large expressions. For details, we refer the reader to [260], appendix A. The NES for ν e can be obtained from eq. 2.143 by replacing CA by −CA . The NES for νµ and ντ can be obtained by replacing CV and CA in eq. 2.143 by CV − 1 and CA − 1, respectively. Finally, the NES for ν µ and ν τ neutrinos is obtained by replacing CV and CA in eq. 2.143 by CV − 1 and CA − 1, respectively, and then changing the sign of CA − 1. • Interaction VII (2.113): e− + e+ � ν + ν (pair creation and annihilation) The thermal production (TP) and absorption kernels of absorption/annihilation (a) and production/creation (p) processes are given by 1 {p} 3 {p} {p} RT aP (ω, ω 0 , cos(Θ)) ≈ Φ0,Ta P (ω, ω 0 ) + Φ1,Ta P (ω, ω 0 ) cos(Θ) 2 2
(2.145)
{p} The l-th moment Φl,Ta P is given by an expressions of the form I {p} II {p} {p} Φl,Ta P = α12 jl,T aP (ω, ω 0 ) + α22 jl,T Pa (ω, ω 0 ) .
82
(2.146)
2.4 Neutrino transport & transport approximations
Figure 2.12: Electron fraction (Ye ) profiles at varying central densities during collapse in model G15 of Liebend¨orfer et al. [134]. As shown, Ye (ρ, t) is only a weak function of time. Figure taken from [136]. The very large expressions for the zeroth and first moments of the absorption and production functions for the different neutrino species can be found in [37], eqs. (C66) - (C74).
2.4.2 Neutrino parametrization scheme Stellar core collapse proceeds, as outlined previously in sec. 1.2, by an imbalance between the self-graviting forces of the inner core and its fluid pressure. At the onset of the collapse, a degenerate electron gas provides the dominant contribution to the pressure. The electron fraction Ye is therefore the fundamental quantity for 4/3 stability of the inner core, as the electron pressure scales as Pe ∝ Ye (see sec. 1.2, with references therein). The electron fraction evolves during the collapse of the iron core by electron capture on protons (eq. 2.107) and on protons bound in nuclei (eq. 2.109). These reactions lead to a reduction of the electron fraction Ye . The electron neutrinos νe produced in these charged-current weak interactions either (1) directly escape at low densities, (2) thermalize and eventually escape, or (3) are trapped for longer than the dynamical timescale (see, e.g., [29, 106]). As in cases (1) and (2) the core loses leptons, one commonly refers to electron capture during collapse as deleptonization. Case (3) is encountered above neutrino trapping densities ∼ 1012 gcm−3 , when the opacities for neutrino scattering become large enough such that the neutrinos can leave the core only on a diffusion timescale,
83
2 3D MHD Core-Collapse Simulations: Implementation which is much larger than the dynamical timescale. In this regime, the total lepton fraction Yl = Ye + Yν is conserved and the neutrinos are in β-equilibrium. νµ and ντ neutrinos and their antiparticles are not yet present in this supernova stage, as the material does not provide the high temperatures needed for the pair-production processes. Thus, during the collapse phase until core bounce, a consistent numerical treatment of deleptonization is important, as a reduction of Ye leads to a reduction of pressure support below nuclear densities. This in turn reduces the size of the homologous inner core [259] which rebounds coherently and that defines the size of the inner core and the initial energy that is imparted to the shock. The latter scales roughly 10/3 as ∝ Ye (see [37], with references therein). This is also one of the reasons why core-collapse simulations that do not include a treatment of deleptonization almost always produce ‘prompt’ explosions, while computations that do take into account deleptonization hardly explode [138]. Taking deleptonization properly into account is also very important in the context of the GW emission from CCSNe: In quickly spinning core collapse, one of the strongest GW signals is expected to come from the matter dynamics at core bounce (see sec. 3.5, and for a review [174]). The size of the inner core is the dynamically relevant quantity for the emission of GWs at core bounce (see [62], with references therein). Hence, for reliable estimates of the GW signature of rotating iron core collapse, it is essential to fully capture the bounce dynamics and include deleptonization which – in combination with the EoS and centrifugal effects – controls the mass of the inner core. As full 3D Boltzmann neutrino transport is, as outlined above, computationally not yet feasible on today’s HPC machines [152], the Basel code ELEPHANT encounters the deleptonization during the collapse phase with a simple and computationally efficient Ye vs. ρ parametrization scheme of Liebend¨orfer [136]. It is based on data from detailed 1D radiation-hydrodynamics calculations [136]. The deleptonization scheme is based on the observation that the Ye (ρ, t) is only very weakly dependent on time during the collapse phase of the iron core, as shown in fig. 2.12. A microphysically consistent Ye can be obtained during collapse in a hydrodynamical simulation with high precision from a tabulated 7 , time-independent Y e (ρ) = Ye (ρ, t = tb ) that is based on computationally expensive radiation hydrodynamics calculations in spherical symmetry. Moreover, Liebend¨orfer [136] has shown that in spherical symmetry such a parametrization yields microphysical and thermodynamical conditions at core bounce to within ∼ 5% of those obtained with a detailed radiation-hydrodynamics simulation. Note that the parametrization of the deleptonization during the collapse relies much more on the local density evolution than on the global geometry. Hence, applying the Ye parametrization for rotating models as well is likely to be almost as accurate as for spherically symmetric models. However, note that the applicability of the scheme in highly asymmetric situations has not been numerically investigated up to now, because their assessment would require corresponding reference simulations with multidimensional neutrino 7
Alternatively, a fitting formula which may replace a Ye -table is provided in [136].
84
2.4 Neutrino transport & transport approximations transport [136]. Following [136], the implementation of an electron fraction evolution along Y e is achieved by � min 0, Y¯e (ρ (t + δt)) − Ye (t) δYe = , (2.147) δt δt where δ/δt denotes a Lagrangian change in a fixed mass element, and where Y e (ρ(t + δt)) is the parametrized Ye interpolated in log10 ρ to update the density at t+δt. The minimum function guarantees that the electron fraction decreases monotonously even if transient instances occur in which the parametrized Y e is larger than the actual Ye (t). This happens, as can be seen in fig. 2.12, at the beginning of Liebend¨orfer’s computation. The deleptonization sets in slowly after a short time of adiabatic compression during which the original electron fraction profile moves to the right in the ρ − Ye plane to join the bounce profile, Y e . Note that eq. 2.147 is implemented in
Figure 2.13: Electron fraction Ye as a function of density, obtained from detailed general relativistic, spherically symmetric three-flavour Boltzmann neutrino transport. The calculations were carried out using a 15M progenitor from [258] a finite temperature EoS of either [130] or [215], and the Agile-Boltztran-code [133]. In the figure, we denote the LS EoS version with a compressibility of 180MeV as LS180, the one carried out with 375MeV as LS375. The Shen EoS is named as such. an operator-splitted manner from the 3D MHD update. For the computations I carried out and which are presented in chap. 3 and 4, I use Ye -tables obtained with the Agile-Boltztran code [134], including either the Lattimer-Swesty [130] or the Shen EoS [215] and the electron capture rates from [36] (processes 2.107-2.113) plus the reactions 2.114 and 2.115 (T. Fischer (2010), private
85
2 3D MHD Core-Collapse Simulations: Implementation communication). Exemplary Ye (ρ) profiles from the Lattimer-Swesty [130] and the Shen EoS [215] are shown in fig. 2.13. The offset between the Ye profiles from the LS- and the Shen EoS is consistent with the different asymmetry energies of the two EoS. This in turn is reflected in different neutrino reaction rates and thus a different Ye at a given density. These effects have been discussed in [222] and [74] for massive progenitor stars in the range of 40-50M . Entropy changes during the collapse phase Electron capture during collapse not only reduces Ye , but also affects matter entropy. The baryons are in NSE and the electrons in thermal equilibrium. Changes in the entropy per baryon (δs) are then determined by the chemical potentials µn , µp and µe of neutrons, protons and electrons, respectively. The resulting energy transfer between matter and neutrinos, δq, has to be taken into account (see, e.g., [29, 37]): T δs = −δYe (µe − µn + µp ) + δq ,
(2.148)
where T is the fluid temperature. Depending on matter density and the energy, produced neutrinos can, as pointed out earlier, either (1) escape freely without further interactions, (2) thermalize and escape, or (3) be trapped for longer than the dynamical timescale. In regime (1), which prevails at densities . 1011 gcm−3 [29], the energy transfer is δq = δYe hEνescape i, where hEνescape i is the average energy of the freely escaping neutrino [29]. Thus, T δs = −δYe (µe − µn + µp − hEνescape i) .
(2.149)
Since hEνescape i > µe − µn + µp , the entropy of the fluid decreases in regime (1). However, since the energy of the escaping neutrinos is only marginally larger than µe − µn + µp due to the average Q-value of the nuclei at ∼ 3MeV (see, e.g., [37] and eq. 2.128), the resulting entropy change is small and thus neglected here in case (1). In regime (2), between ∼ 2 × 10¹¹ gcm3 and the density threshold for neutrino trapping around ∼ 2 × 10¹² gcm3 , the neutrino mean free path is reduced by coherent scattering off heavy nuclei. The increasing matter density causes the electron chemical potential to rise, resulting in the production of neutrinos at higher energies compared to regime (1). Since the neutrino mean free path scales as Eν−2 , thermalization to low energies provides the fastest way of escape. This thermalization process leads to a mean final escape energy of the order of ∼ 10MeV [150]. For the parametrization of the entropy changes, Liebend¨orfer suggests using Eνescape = 10 MeV as a constant parameter that defines where regime (2) begins, namely when the inequality µe − µn + µp − Eνescape > 0 holds true. Hence, the entropy increases according to δs δYe µe − µn + µp − Eνescape =− , (2.150) δt δt T where δYe /δt is given by eq. 2.147. At even higher densities in regime (3), the neutrinos are no longer able to escape before the postbounce neutronization burst. Hence, β-equilibrium prevails (the neutrinos are in equilibrium with the fluid) and δq in eq. 2.148 can be determined by the neutrino chemical potential δq = δYe µν [136].
86
2.4 Neutrino transport & transport approximations Since µe + µp = µn + µν in β-equilibrium, δs follows. Thus, in regime (3), no further entropy changes are taken into account. Note again that the entropy changes are updated in an operator-splitted manner. Neutrino stress and neutrino pressure In the optically thick regime (3), the neutrinos are trapped inside the PNS and their diffusion timescale is longer than the hydrodynamical timescale [134, 150]. The neutrinos now form a normal (Fermi-) gas component without transport abilities within the fluid, giving the pressure �µ � 4π ν 4 , (2.151) (kT ) F pν = 3 3 kT 3 (hc) the neutrino chemical potential is given by µν = µe − µn + µp . Fn (η) = Rwhere ∞ n −1 x (ex−η + 1) dx is the Fermi-Dirac function of order n. F3 then is given by 0 the expression of [196]: � � 7π 4 1 7π 4 −η 4 2 2 F3 (η) ' η + 2π η + − e , (2.152) 4 15 120 where η = µ/kT . Note that eq. 2.151 considers only the pressure originating from electron neutrinos. In principle, both electron and anti-electron neutrinos should be considered in this stage of the collapse. This would require a term [F3 (η) + F3 (−η)] instead of F3 (η) 8 . However, as the anti-electron neutrino fraction is several orders of magnitudes smaller than the electron neutrino fraction during collapse and bounce, we may neglect their contribution. The neutrino stress then is approximately given by the gradient of the neutrino pressure, ∂pν dv ∇pν =− = −4πr2 , dt ρ ∂m
(2.153)
where dv/dt is the Lagrangian time derivative of the velocity, the term in the middle the general expression, and the term on the right the spherically symmetric limit based on enclosed mass m(r) at radius r. In the optically semi-transparent and transparent regimes (ρ < ρtrap ), the procedure to calculate the neutrino stress is computationally more intensive and less straightforward than in regime (3). Thus, I outline only how the neutrino stress is computed. For details of the derivation, I refer to Liebend¨orfer [136]. At ρ < ρtrap , a first-order estimate for the neutrino stress relies on arguments based on the neutrino number luminosity, spherical symmetry, the assumption that neutrinos leave isotropically and without time delay from the locations of deleptonization, and the requirement of lepton conservation. With all these assumptions, the neutrino stress (in spherical symmetry) can be expressed by " # � µν 2 dv CL 3 F5 kT escape 3 F2 (0) F5 (0) � = max (kT ) ) , (2.154) µν , (Eν dt 4πr2 F33 (0) F2 kT 8
In β-equilibrium, electron and anti-electron neutrinos have equal chemical potentials with the opposite sign.
87
2 3D MHD Core-Collapse Simulations: Implementation where r, T , µν ≡ µe − µn + µp and the neutrino number luminosity L represent the local values at the point where dv/dt is evaluated. An estimate of L (in spherical symmetry) is given by Z m(r) δYe NA dm , (2.155) L(r) = − δt 0 where Avogadro’s number is denoted by NA and δYe /δt is given by eq. 2.147. The constant C is defined such that it attaches regime (3) to regime (2): � �−1 3 F5 (µν /kT ) L C = −4πr (kT ) . ∂m F2 (µν /kT ) 4πr2 2 ∂pν
(2.156)
In eq. 2.156, r, ∂pν /∂m, T , µν , and L are evaluated at the transition density ρtrap . Finally, the Fermi integrals F3 and F5 can be evaluated by [196]: � � 7π 4 1 7π 4 −η 4 2 2 F3 (η) ' η + 2π η + − e , 4 15 120 � � 1 31π 6 31π 6 −η 6 2 4 4 2 F5 (η) ' e . (2.157) η + 5π η + 7π η + − 6 21 252 As the expressions for the neutrino stress in the optically thin regime is only valid in spherical symmetry, Liebend¨orfer [136] recommends for multi-D simulations to use spherically averaged conditions of the multidimensional configurations to evaluate the neutrino stress. This approach is justified by the fact that neutrino pressure contributions are already small at the transition density (. 5 − 10% of the fluid pressure). Limitations of the parametrization scheme There is a minor i) and a major ii) limitation of the parametrization scheme: i) The present deleptonization scheme cannot capture the slight increase of Ye around core bounce (see fig. 2.12), which is due to increasing neutron degeneracy at very high densities. In the density regime where neutrinos are trapped and β-equilibrium prevails, Yl is conserved/constant; hence, Ye should be obtained by a weak equilibrium calculation. A parametrization of the lepton fraction Yl instead of the electron Ye fraction would improve this, as it allows for a more consistent Ye at nuclear densities. However, such a treatment would also lead to a significant increase in the computational complexity of the scheme [136]. The major limitation ii) of the parametrization is its inability to capture any postbounce neutrino effects such as the neutronization burst (see fig. 2.14), which occurs when the shock reaches the electron-neutrinosphere.
2.4.3 The isotropic diffusion source approximation IDSA Around core bounce, the neutrino parametrization scheme, described above, breaks down as it cannot model the neutronization burst (see fig. 2.14). After core bounce, the neutrino transport is tracked via a partial (i.e., a leakage scheme) or a full
88
2.4 Neutrino transport & transport approximations
Figure 2.14: The figure shows the comparison of the almost non-rotating 3D model R1E1CA (see sec. 3.2) with the spherically symmetric model G15 (see Liebend¨orfer et al. [134]), which is based on general relativistic threeflavour Boltzmann neutrino transport. From the upper left to the lower right we compare as a function of enclosed mass: the density, the velocity, the Ye , and the entropy profiles. The solid lines show the results of model R1E1CA (cf. chap. 3) and the dotted lines the results of model G15. The thin lines represent a time instance at 5ms before bounce and the thick lines represent a time instance at 5ms after bounce. Excellent agreement is found in all four quantities – with one exception. The parametrised neutrino leakage scheme cannot model the neutronization burst, which causes a prominent Ye -dip and additional cooling in the G15 data.
implementation of the so-called Isotropic Diffusion Source Approximation (IDSA) [140]. Note that the IDSA, contrary to the parametrization scheme outlined above, is a general concept of radiative transfer, applicable to all sorts of problems where matter interacts with radiation or transported particles. However, as our target application is the neutrino transport in stellar core collapse, we will only discuss the IDSA in this particular context. As a basic concept, the IDSA decomposes the distribution function f of a given neutrino species into two components, an isotropic, trapped component f t and a streaming component f s , representing neutrinos of a given species and energy which find the local zone opaque or transparent, respectively. The total distribution function is the sum of the two components, f = f t + f s . One particle species (in the
89
2 3D MHD Core-Collapse Simulations: Implementation current implementation either the νe or ν e neutrino) is allowed to have a component that evolves in the hydrodynamical limit, while another component of the same particle species is treated by radiative transfer techniques. Moreover, the two components are coupled by a diffusion source term Σ. The source term Σ converts trapped particles into streaming particles and vice versa. It can be determined from the requirement that the temporal change of f t has to reproduce the diffusion limit within the limit of a small mean free path. The Boltzmann transport equation can then be written in terms of a linear operator D () describing particle propagation, D (f = f t + f s ) = C, where C = C t + C s is a suitable decomposition of the collision integral according to the coupling to the trapped (C t ) or streaming (C s ) particle components. Consequently, we have to solve the following set equations for the individual components in a operator-split manner: � D f t = Ct − Σ (2.158) s s D (f ) = C + Σ. (2.159) Application of the IDSA to the O(v/c) Boltzmann transport equation in spherical symmetry For the time being, in our current implementation of the IDSA the linear operator D () in eqs. 2.158 and 2.159 represents the O(v/c) Boltzmann transport equation (cf. eq. 2.106) of massless fermions in spherical symmetry (see [50, 153]). It reads � � � � � ∂f df ∂f d ln ρ 3v 1 + µ + µ + + 1 − µ2 cdt ∂r cdt cr r ∂µ � � � � d ln ρ 3v v ∂f + µ2 + − E cdt cr cr ∂E 2 E = j (1 − f ) − χf + |{z} | {z } c (hc)3 absorption emission Z Z 0 0 × (1 − f ) Rf dµ − f R (1 − f 0 ) dµ0 (2.160) | {z } {z } | isoenergetic
‘inscattering 0
isoenergetic
‘outscattering 0
and describes the propagation of massless fermions at the speed of light c, with respect to a compressible background with a rest mass density ρ. Note that in this subsection, for sake of simplicity, I follow the conventions used by Liebend¨orfer et al. [140], who uses for energy the variable E instead of ω (cf. sec. 2.4.1). The particle distribution function f (t, r, µ, E) depends on the time, t, radius, r, and the momentum phase space spanned by the angle cosine, µ, of the particle propagation direction with respect to the radius and the particle energy, E. The momentum phase space variables are measured in the frame co-moving with the background matter, which moves with velocity v with respect to the laboratory frame. The Lagrangian time derivative (see, e.g. [127]) in the co-moving frame is
90
2.4 Neutrino transport & transport approximations denoted by df /dt. The derivatives ∂f /∂µ and ∂f /∂E in eq. 2.160 are also taken co-moving with a fluid element. On the right hand side of eq. 2.160, a particle emissivity, j, and a particle absorptivity, χ, as well as an isoenergetic scattering kernel, R, are included. All blocking factors (1 − f ) in eq. 2.160 are explicitly written out to ease the identification of in-scattering and out-scattering terms. The abbreviation f 0 refers to f (t, r, µ0 , E), where µ0 is the angle cosine over which the integration is performed. Note that currently the inelastic scattering process is neglected. Furthermore, note that the current implementation only considers νe and ν e neutrinos. The particle density is given by an integration of the distribution function over the momentum phase space, Z 3 f (t, r, µ, E) E 2 dEdµ, (2.161) n (t, r) = 4π/ (hc) where h denotes Plancks constant.
Figure 2.15: Comparison of the spherically averaged Ye profiles of models R0E1CAL (circled line, ‘LEAK 0 , see sec. 3.2), R0E1CAIDSA (solid line, ‘IDSA0 , see sec. 3.2) with the spherically symmetric model G15 (dashed line, ‘Boltzmann0 ) as a function of the enclosed mass at 5ms after bounce. Model G15 is based on general relativistic three-flavour neutrino transport [134]. Note that our leakage scheme significantly overestimates the deleptonization in and around the neutrinosphere region, as it neglects any absorption of transported neutrinos by discarding the streaming component (f s = 0).
Time-evolution of the trapped and the streaming particle distributions We assume that the ‘trapped’ and the ‘streaming’ particle components of the neutrino distribution function f = f t + f s evolve separately according to eq. 2.160,
91
2 3D MHD Core-Collapse Simulations: Implementation coupled by a source term Σ. Hence, the evolution of the trapped particle component f t can be written as � � � � � ∂f t ∂f t d ln ρ 3v 1 df t +µ + µ + + 1 − µ2 cdt ∂r cdt cr r ∂µ � � � � t d ln ρ 3v v ∂f + µ2 + − E cdt cr cr ∂E t = j − (j + χ) f − Σ � �Z Z E2 t0 0 t 0 + Rf dµ − f Rdµ . (2.162) c (hc)3 Since we assume that f t = f t (t, r, E), and the source function, Σ = Σ (t, r, E), are isotropic, an angular integration of eq. 2.162 over µ simplifies this equation to df t 1 d ln ρ ∂f t + E = j − (j + χ) f t − Σ . cdt 3 cdt ∂E
(2.163)
In the hydrodynamical limit, i.e. fast-moving particles with a very short transport mean free path, the trapped particle distribution function f t has to reproduce the diffusion limit [140]. In the framework of the IDSA, the diffusive drain (or replenishment) of trapped particles is accounted by means of a source term Σ. Comparing 2.163 with the diffusion limit of the Boltzmann equation [154,140] yields the following source term: � � Z 1 ∂ −r2 λ ∂f t 1 f s dµ , (2.164) Σ= 2 + (j + χ) r ∂r 3 ∂r 2 where λ = 1/ (j + χ + φ) is the mean free path and φ the opacity. Note that isoenenergetic R scattering enters eq. 2.164 only implicitly via φ. The additional term (j + χ) /2 f s dµ in eq. 2.164 accounts for the absorption of streaming particles in matter; its necessity is visualized in fig. 2.16. Note that the IDSA does not allow for the possibility of a direct emission of matter into the streaming particle component. This can be tracked more easily by a large conversion rate Σ of trapped particles. Moreover, Liebend¨orfer et al. [140] suggest accounting the streaming particles that are absorbed by matter in the manner represented by the arrow labelled by (j + χ) f s in fig. 2.16. In the diffusion limit, Rthe net particle exchange of the fluid element with its environment, Σ − (j + χ) /2 f s dµ, must then correspond to the diffusion term (cf. [140], their eq. A10). This is the case for the choice of Σ in eq. (2.164). In order to guarantee that eq. 2.164 delivers consistent, ‘physical’ particle fluxes in the entire computational domain, limiters must be applied. As a limit in the transparent region, the diffusion source is thus set to Σ ≤ j. If the diffusion source and emissivity reach equality, the matter absorptivity − (j + χ) f t removes remaining trapped particles while all newly emitted ones are directly converted to streaming particles that escape the fluid element. With this limit imposed, the net interaction of particles with matter in fig. 2.16 has the correct limit for large mean free paths, j − (j + χ) f s . The lower boundary is chosen to fulfill the requirement
92
2.4 Neutrino transport & transport approximations
Figure 2.16: The shaded box schematically represents a fluid element in the diffusion source approximation. It contains matter (lower part) and trapped radiation particles (upper part). The interaction with other fluid elements can only occur through the exchange of streaming particles or the combined hydrodynamics of matter and trapped particles. Thus, streaming particles can be absorbed in matter at the rate (j + χ) f s and trapped particles are converted to streaming particles at the rate Σ. Within the fluid element, matter emits trapped particles at the rate j and absorbs trapped particles at the rate (j + χ) f t . The emissivity in the absorption term originates from the identity j (1 − f ) − χf = j − (j + χ) f , which hides the Pauli blocking factor in the absorption term. Figure taken from [140]. f t ≤ j/ (j + χ), where j/ (j + χ) represents the equilibrium distribution function. This in consequence leads to the requirement Σ ≥ 0. Therefore, the net absorption of particles in a fluid element cannot exceed (j + χ) f s (cf. fig. 2.16). In a compact notation, the diffusion source is limited as follows: �
� � � Z 1 s Σ = min max α + (j + χ) f dµ, 0 , j 2 � � 1 ∂ −r2 ∂f t α = 2 . r ∂r 3 (j + χ + φ) ∂r
(2.165)
Having discussed the time evolution of the trapped particle distribution component, we now turn our attention to the evolution of the streaming component f s . The starting point for its temporal evolution is again eq. 2.160: � � � � � ∂f s df s ∂f s d ln ρ 3v 1 + µ + µ + + 1 − µ2 cdt ∂r cdt cr r ∂µ � � � � s d ln ρ 3v v ∂f + − E + µ2 cdt cr cr ∂E � �Z Z 2 E s0 0 s 0 s = − (j + χ) f + Σ + Rf dµ − f Rdµ . c (hc)3
(2.166)
93
2 3D MHD Core-Collapse Simulations: Implementation By design of the IDSA, the particle density of the streaming component is small compared to the trapped one in regions where scattering dominates the interactions. Hence, the scattering integrals on the right hand side of eq. 2.166 can be neglected. For reason of convenience, eq. 2.166 is transformed into the laboratory frame. Then, the temporal evolution of f s reads � � � ∂ fˆs ∂ fˆs ∂ fˆs 1 ˆ, +µ ˆ (2.167) + 1−µ ˆ2 = − ˆj + χˆ fˆs + Σ ∂r r ∂µ ˆ c∂ tˆ where the quantities carrying a hat are measured in the laboratory frame. Furthermore, it is assumed that the fluxes of free streaming particles reach stationary values much faster than the dynamical time scale of interest. Thus, the time-derivative can be dropped in the first term in eq. 2.167. If the source on the right hand side is assumed to be known from a consistent solution of eqs. 2.163 and 2.165, the integration of eq. 2.167 over angles leads to a Poisson equation for a potential ψ, whose gradient represents the particle flux: Z 1 ∂ψ = fˆs µ ˆdˆ µ ∂r 2 � � Z i � 1 ∂ 1 h �ˆ s 2 ∂ψ ˆ ˆ µ. − j + χˆ f + Σ dˆ r = r2 ∂r ∂r 2
(2.168)
Finally, the streaming particle flux and particle density are, as suggested in [133], related by an expression which assumes that all particles of a given energy group are emitted isotropically at their corresponding scattering sphere: 1 2
Z
fˆs (E) dˆ µ=
2 ∂ψ (E) ∂r � �2 , Rν (E) 1 − max(r,Rν (E))
r 1+
(2.169)
where Rν (E) is the radius of the monochromatic scattering sphere, i. e. the neutrinosphere, that depends on the particle energy E. The radial position of the neutrinosphere is usually defined as the surface where the neutrino’s optical depth reaches Z ∞ dr 2 (2.170) τ (r, Eν ) = = . 3 Rν (E) λν,Eν The neutrinosphere is the effective radiating surface for neutrinos, in analogy to the ‘photosphere’ of normal light emitting surfaces. Note that its position differs from neutrino species to species and is dependent on the neutrino energy. Moreover, note also that τ is used to discriminate between f t and f s at the neutrinosphere. In order to solve for both the trapped and the streaming particle component, the quantities must be Lorentz-boosted from the laboratory frame to the co-moving frame and vice versa . However, in the current implementation of the IDSA, where we run our simulations in the Newtonian limit, the required transformations are neglected. Hence, we refer the reader to [140] and [155], where the details of the necessary Lorentz transformation can be found in their full glory.
94
2.4 Neutrino transport & transport approximations The coupling of the IDSA with hydrodynamics The neutrino distribution function must be somehow coupled to the dynamics of the background matter. The latter can be described by the conservation laws of hydrodynamics (see sec. 2.2, and [155]). In spherical symmetry for example, this set of equation results in � ∂ ∂ U+ 2 r2 F = 0 , (2.171) ∂t r ∂r where U is a vector of primitive variables and F a vector of fluxes. In the IDSA, the following approach is taken: since the characteristic timescale of the local reactions between the transported particles is faster than the diffusion timescale, which is of order [155] l2 , (2.172) 2cλ (where λ is the mean free path, l characteristical length, i. e. the size of a computational domain, and c the speed of light), the neutrino spectrum can be approximated by a thermal spectrum: tdif f ∼
Y
t
Zt
Z mb 4π = f t E 2 dEdµ 3 ρ (hc) Z mb 4π = f t E 3 dEdµ , ρ (hc)3
(2.173)
where mb in our application is the baryon rest mass of the background matter, Y t and Z t a particle number fraction and a particle mean specific energy, respectively. Note that this assumption is only made for the trapped particle component within a fluid element. The streaming particles, which communicate between fluid elements, keep their detailed spectral information. The measure taken in eq. 2.173 reduces the number of variables to describe the distribution functions of the trapped particles drastically. We can now rewrite the evolution equation 2.162 for the trapped particle component with an Eulerian time derivative and use the continuity equation to substitute the d ln ρ/dt term by the velocity divergence, ∂ � 2 v t� ∂ � 2 v � ∂ (E 3 f t ) ∂f t + 2 r f − 2 r c∂t r ∂r c r ∂r c 3E 2 ∂E t = j − (j + χ) f − Σ .
(2.174)
If we now perform the energy integrals which appear in eq. 2.173 on 2.174, we obtain the following evolution equations for Y t and Z t : � � ∂ ∂ ρY t + 2 r2 vρY t ∂t r ∂r 4πc = mb (hc)3
� Z � Z 1 t j − (j + χ) f − Σdµ E 2 dE , (2.175) 2
95
2 3D MHD Core-Collapse Simulations: Implementation and � � � ρZ t ∂ ∂ ∂ ρZ t + 2 r2 vρZ t + 2 r2 v ∂t r ∂r r ∂r 3Z � � 4πc = mb j − (j + χ) f t − Σ E 3 dE . (2.176) 3 (hc) The equation for Z t corresponds to an energy equation with a pdV term for the radiation pressure ρZ t /3 on the left hand side. Moreover, and in analogy to an entropy equation, it can be transformed into a conservative form for the evolution 3/4 of (ρZ t ) . Therefore, one can solve the advective part, i.e. the left hand side of eq. 2.176 together with the hydrodynamical conservation law (eq. 2.171) expressed by the following primitive variables: ρ ρv � ρ e + 21 v 2 U = ρYe ρYlt 3 (ρZlt ) 4
,
vρ vρv +p �
� vρ e + 1 v 2 + p 2 ρ F = , vρY e t vρYl 3 t 4 v (ρZl )
(2.177)
where p is the fluid pressure, e the fluid specific internal energy, and Ye the electron fraction. The index l stands for the different species of trapped particles, i.e. the νe and ν e neutrinos in the current implementation. The distribution function of trapped particles in thermal equilibrium, flt (E) = {exp [βl (E − µl )] + 1}−1 , has two free parameters βl and µl . Hence, it can be reconstructed in such a way that eq. 2.173 is fulfilled for the new/updated values of Ylt and Zlt . Subsequently, the remaining update of the trapped particle distribution in eq. 2.174 is given by ∂flt = jl − (jl + χl ) flt − Σl . c∂t Equation 2.178 also determines the net reaction rates, � sl = jl − (jl + χl ) flt + fls ,
(2.178)
(2.179)
between matter and the radiation particles, which leads to the following changes of the electron fraction and internal specific energy: Z 1 ∂flt + Σl − (jl + χl ) fls dµ sl = c∂t 2 Z ∂Ye mb 4πc = − (sνe − sν¯e ) E 2 dE c∂t ρ (hc)3 Z ∂e mb 4πc (sνe + sν¯e ) E 3 dE . = − c∂t ρ (hc)3
96
(2.180) (2.181) (2.182)
2.4 Neutrino transport & transport approximations The changes in electron fraction Ye and specific energy e feed back into the emissivity j and absorptivity χ used in eq. 2.178. Once a consistent solution has been found, eq. 2.178 allows updates of the trapped particle fraction Z ∂Ylt mb 4πc ∂flt 2 = E dE , (2.183) ∂t ρ (hc)3 ∂t of the trapped particle specific energy ∂Zlt mb 4πc = ∂t ρ (hc)3
Z
∂flt 3 E dE , ∂t
(2.184)
and of the matter velocity, which is subject to radiation pressure. � � 1 ∂ ρZlt ∂v . =− ∂t ρ ∂r 3mb
(2.185)
After updating Ylt , Zlt and v, the cycle of updates is completed by the solution of eqs. 2.168 and 2.169 for the distribution function f s for streaming particles based on the sources determined in eqs. 2.178 and 2.165. IDSA in 3D So far I have only discussed the IDSA in spherical symmetry. However, the IDSA was in principle designed as a computationally efficient approximation to radiative transfer in multidimensional HD/MHD simulations. Thus, I will now sketch the basic measures required to extend the transport scheme from 1D to 3D. Note that a detailed discussion of the generalization of the IDSA to multi-D applications goes beyond the scope of my PhD thesis. For a partial discussion, I refer the reader to [140], sec. 4. The details about the implementation will follow in Whitehouse et al. (2010, in preparation). To summarize, one could say that the difference between the 3D and 1D IDSA is only technical – scientifically the schemes are identical. The major difference is given by the fact that the streaming component is treated in spherical symmetry and the trapped component is done in full 3D. When changing from 1D to 3D, the extension of the state vector U in the equations of hydrodynamics comes quite naturally, and differs from the 1D spherically symmetric one (see eq. 2.177) only by the velocity v, which becomes a vector ~v = (vx , vy , vz ). Using i = 1 . . . 3 for the three spatial directions in the momentum equation, the corresponding 3D state vector U and flux vector F read ~v ρ ρ ρvi � � ~v ρvi + p � ~v ρ e + 1 v 2 + p ρ e + 21 v 2 2 ρ , F = U = (2.186) . ρY e ~ v ρY e ρYlt ~v ρYlt 3 3 t 4 (ρZlt ) 4 ~v (ρZ ) l
97
2 3D MHD Core-Collapse Simulations: Implementation This state vector can be evolved by any standard hydrodynamics scheme that solves the multi-dimensional conservation law ∂ ~ · F~ = 0 , U +∇ ∂t
(2.187)
as outlined for example in sec. 2.2. A more difficult part in the multi-dimensional IDSA is the consistent solution of eqs. 2.165 and 2.178-2.182. The difficulty arises from the non-local scalar � � −1 t ~ · ~ ∇f α=∇ (2.188) 3 (j + χ + φ) in eq. 2.165. All the other equations are local and do not depend on the dimensionalR ity of the problem, except that the integration over the angle cosine, 1/2 dµ,R must be replaced by an integration over the entire solid angle of a sphere, 1/ (4π) dΩ. In the preliminary 3D IDSA implementation I got provided by S.C. Whitehouse, eq. 2.188 is calculated via f t of the previous time step and update f t locally with eqs. 2.178-2.182. Hence, only the local reactions are implemented implicitly while the diffusion part remains explicit. This approach is only conditionally stable and the time step must be restricted to ∆x2 / (2λc). The relevance of trapped particles diminishes in the transparent regime around λ ∼ ∆x. Thus, the time step restriction is of a similar order of magnitude as the CFL condition for the particle propagation speed c. The result of this step determines a partial update of the compositional quantities in U and a spectral diffusion source Σl (E) for each particle species l at each grid point. This information is stored for the following updates. The stationary-state solution for the streaming particle component is then in principle based on Z h � i � 1 ˆ dΩ ˆ, − ˆj + χˆ fˆs + Σ (2.189) ∆ψ = 4π which is the extension of eq. (2.168) to the multi-dimensional case. The integration ˆ is again performed over the solid angle of a sphere. Note that eq. 2.189 over dΩ must be solved for each energy group and particle species separately. However, all ~ can then be retrieved from directional information of the streaming particle flux ∇ψ ˆ the corresponding scalar potential ψl (E). After the hydrodynamic update according to eq. 2.187, we have to convert the par~ l (E), ˆ into a streaming particle density. For nearly spherical problems ticle flux, ∇ψ such as ours, the simple spherically symmetric ansatz described above currently is applied to obtain an R estimate of the flux factor. Once the spectral streaming parti~ l (E) ˆ and cle density 1/ (4π) fls (E) dΩ has been determined by the quotient of ∇ψ the flux factor, one cycle of updates in a multidimensional application is concluded, as shown in fig. 2.17, where a schematic view of the IDSA code and flow inside ELEPHANT is displayed. Note that even though the procedure to extend the IDSA from 1D to multi-D was outlined in the pure hydrodynamical case, it is done in the same fashion also for MHD.
98
2.4 Neutrino transport & transport approximations
Figure 2.17: Schematic view of the IDSA code and flow inside ELEPHANT according to S.C. Whitehouse. Current reactions implemented in the IDSA The current implementation of the IDSA includes only electron flavour neutrinos. Their dominant emission and absorption reactions in the postbounce phase are given by electron and positron capture, as outlined in eqs. 2.107 and 2.108. The opacities in our implementation of the IDSA are given by isoenergetic scattering on nucleons and nuclei (eqs. 2.110 and 2.111). Note that all weak interactions are implemented as described in sec. 2.4.1. The thermodynamical state of matter as a function of density, ρ, temperature, T , and electron fraction, Ye , is calculated by the LS EoS [130] or the Shen EoS [215]. In order to resolve the neutrino energy spectrum, we use, as suggested by S. W. Bruenn, 20 geometrically spaced energy zones to span the neutrino energy range between 3 and 300 MeV. Planned IDSA upgrades The IDSA includes at present only the dominant reactions relevant to the neutrino transport problem (see [140] for details). Future upgrades will also include contributions from electron-neutrino electron scattering (eq. 2.112). which are indispensable during the collapse phase. This reaction thermalizes the neutrinos very effectively (see, e.g., [37]), which in turn is important because the neutrino mean free paths vary inversely with the square of the neutrino energy (λ ∼ E12 ). Thus, it influences ν directly the size/mass of the inner core at bounce, which scales roughly proportional to the square of the electron fraction Ye (and the entropy per baryon) [85]. The size/mass of the inner core in turn is the dynamically relevant quantity for the emission of GWs at core bounce [62]. Moreover, the inclusion of this reaction will
99
2 3D MHD Core-Collapse Simulations: Implementation
Figure 2.18: Comparison of different precollapse initial rotational configurations, set up according to eq. 2.190. Note that the displayed values of Ωc,i were applied for models discussed in chap. 3. For the entire model set, I choose A = 500 km. also make the cumbersome switch from the parametrization to the IDSA at bounce obsolete. Finally, there are ongoing efforts (A. Perego) to include µ and τ neutrinos. They are very important for the radial position of the shock wave and to the moment when it stops, before the ‘revival’ of the stalled shock wave sets in again, and the cooling of the PNS to its final stage as neutron star or black hole (see, e.g., [138,73], and reference therein).
2.5 Presupernova stellar models & initial model configurations All presupernova stellar models available today stem from Newtonian 1D stellar evolution calculations and hence may not cover all possible states prior to the collapse of a multidimensional star. Therefore, we construct the initial conditions of our simulations by a parametric approach. We employ a solar-metallicity 15M progenitor star of [258]. Angular momentum is added to the presupernova model according to a shell-type constant j (j denotes specific angular momentum) rotation law of [67]: Ωc,i for A → ∞ 2 A 2 Ω(r) = Ωi,c · 2 = , (2.190) A + r2 Ωc,i A for A → 0 r2 p where we define r = x2 + y 2 + z 2 as spherical radius, and (x, y, z) as Cartesian coordinates. The constant A is the degree of differential rotation that controls the steepness of the angular velocity profile, Ωi,c the initial central rotation rate, and r is the distance
100
2.5 Presupernova stellar models & initial model configurations from the origin (see fig. 2.18). Note that for A → ∞, the rotation becomes uniform. Throughout our entire model set we choose A = 500 km as degree of differential rotation. In order to guarantee a divergence-free initial state, the initial magnetic field con~ The comfiguration was set up employing its definition via the vector potential A. ~ chosen are ponents of A � � p B B pol pol ~= − A (2.191) y, x, x2 + y 2 Btor . 2 2 In order to mimic a dipole-like field, we scale the vector potential with density according to the suggestion of M. Liebend¨orfer as r ρ ~ ~ ˜ A. (2.192) A= ρref Finally, the magnetic field is derived from this vector potential via [105] ~˜ . ~ =∇×A B
(2.193)
The initial toroidal and poloidal components of the magnetic field are specified at a reference density of ρref = 5 × 10⁷ gcm−3 according to [93].
101
2 3D MHD Core-Collapse Simulations: Implementation
102
3 3D MHD Core-Collapse Simulations: Results I So this, then, was the kernel of the brute! Johann Wolfgang von Goethe, Faust I
In this chapter, I will present results from fully self-consistent 3D MHD core-collapse simulations, carried out with ELEPHANT. In the subsequent sections, I will discuss the GW signature of 28 three dimensional models. While presenting the resulting GW patterns, I will pay special attention to possible imprints of different finite temperature EoS, rotation rates, nonaxisymmetric instabilities, magnetic fields and postbounce neutrino transport schemes on the predicted 3D GW signals. The following papers present the result of this work in condensed form: Scheidegger et al. (2008) [206] and Scheidegger et al. (2010a,b) [208, 210].
3.1 Description of the magnetohydrodynamical models For the 3D Newtonian ideal MHD core-collapse simulations and their GW signatures presented in this chapter 3, I use the ELEPHANT code. However, as a reminder, I will detail here quickly the underlying input physics of the models discussed below. In this entire section, the gravitational potential is calculated via a spherically symmetric mass integration that includes radial GR corrections (see sec. 2.2.2 and [147]). As for the treatment of the deleptonization during the collapse phase, I apply the simple and computationally efficient Ye vs. ρ parametrization scheme (see sec. 2.4.2 and [136]. For this I use the results obtained with the Agile-Boltztran code [134], including the above-mentioned EoS of Shen et al. [215] and Lattimer-Swesty in all three variations [130], and the electron capture rates from [36]. After core bounce, the neutrino transport is tracked for several models via a partial (i.e. a leakage scheme) or full implementation of the isotropic diffusion source approximation scheme (see sec. 2.4.3 and [140]). The IDSA, decomposes the distribution function f of neutrinos into two components, a trapped component f t and a streaming component f s , representing neutrinos of a given species and energy which find the local zone opaque or transparent, respectively. The total distribution function is the sum of the two components, f = f t + f s . The two components are evolved using separate numerical techniques, coupled by a diffusion source term Σ. The latter converts trapped particles into streaming particles and vice versa. We determine it
103
3 3D MHD Core-Collapse Simulations: Results I from the requirement that the temporal change of f t has to reproduce the diffusion limit within the limit of a small mean free path. Note that our leakage scheme significantly overestimates the deleptonization in and around the neutrinosphere region, as it neglects any absorption of transported neutrinos by discarding the streaming component (f s = 0). The 3D computational domain consists, for all models, of a central cube of either 6003 or 10003 cells. The grid spacing is chosen to be 1km or 0.6km. The presupernova stellar models stem from Newtonian 1D stellar evolution calculations and hence may not cover all possible states prior to the collapse of a multidimensional star. Therefore I construct the initial conditions of our simulations by a parametric approach, as described in sec. 2.5 above. I employ a solar-metallicity 15M progenitor of [258], and set it into rotation according to a shell-type rotation law of [67] with a shellular quadratic cutoff at 500km radius (see sec. 2.5).
3.2 Model parameters and nomenclature All my models are named after the combinations of initial central rotation rate, the EoS, and toroidal and poloidal magnetic fields. The first two letters of the model name represent the initial central rotation rate Ωc,i [rads−1 ] according to 0 R0
0.3 R1
π R2
2π R3
3π R4
4π R5
,
the second two letters stand for the applied EoS LS (K = 180MeV) E1
LS (K = 220MeV) E2
LS (K =325 MeV) E3
Shen , ST
while the last two letters assign the order of magnitude of the toroidal and poloidal field strength [G] according to 106 A
107 B
109 C
1010 D
1011 E
1012 F
.
The subscript L and IDSA denotes simulations which were carried out with the leakage scheme or the ‘complete’ IDSA; and whenever the grid spacing is chosen to be not 1km, but 0.6km, this is denoted with a subscript HR, standing for high resolution. Some of the values I adopt as rotation rate and magnetic fields correspond to those suggested in [93]. However, I point out that some of the initial rotation rates (Ωc,i & π·rads−1 ) and magnetic fields (B & 1010 G) are larger and stronger than current predictions from stellar evolution calculations. I computed these models in order to cover a wide parameter space for our three-dimensional models with neutrino transport approximations.
3.3 Compute requirements Pure MHD simulations (including the approximate treatment of deleptonization during the collapse phase) require about 150 000 − 200 000 CPUh per run on CSCS’s
104
3.4 Non- or slowly rotating core collapse
Table 3.1: Summary of initial conditions of non- and slowly rotating models a Model
Ωc,i [rads−1 ]
βi
βb
EoS
g ρb [ cm 3]
Btor,i [G]
Bpol,i [G]
Em /|W |b
Em /|W |f
R0E1CA
0
0
0
E1
4.39 × 10¹⁴
5 × 10⁹
1 × 10⁶
1.8 × 10⁻⁹
3.8 × 10⁻⁸
R0E1CAIDSA
0
0
0
E1
4.34 × 10¹⁴
5 × 10⁹
1 × 10⁶
-
-
R0E3CA
0
0
0
E3
4.17 × 10¹⁴
5 × 10⁹
1 × 10⁶
1.8 × 10⁻⁹
3.1 × 10⁻⁸
R0STCA
0
0
0
ST
3.38 × 10¹⁴
5 × 10⁹
1 × 10⁶
1.7 × 10⁻⁹
3.3 × 10⁻⁸
R1E1CA
0.3
0.59 × 10⁻⁵
1.7 × 10⁻⁴
E1
4.53 × 10¹⁴
5 × 10⁹
1 × 10⁶
1.7 × 10⁻⁹
3.4 × 10⁻⁸
R1E1CAHR
0.3
0.59 × 10⁻⁵
1.7 × 10⁻⁴
E1
4.36 × 10¹⁴
5 × 10⁹
1 × 10⁶
-
-
R1E3CA
0.3
0.59 × 10⁻⁵
1.7 × 10⁻⁴
E3
4.17 × 10¹⁴
5 × 10⁹
1 × 10⁶
1.7 × 10⁻⁹
3.6 × 10⁻⁸
R1E1DB
0.3
0.59 × 10⁻⁵
1.7 × 10⁻⁴
E1
4.53 × 10¹⁴
5 × 10¹⁰
1 × 10⁷
1.7 × 10⁻⁷
3.0 × 10⁻⁶
R1STCA
0.3
0.59 × 10⁻⁵
1.7 × 10⁻⁴
ST
3.38 × 10¹⁴
5 × 10⁹
1 × 10⁶
1.7 × 10⁻⁹
3.2 × 10⁻⁸
R1E1CAL
0.3
0.59 × 10⁻⁵
1.8 × 10⁻⁴
E1
4.38 × 10¹⁴
5 × 10⁹
1 × 10⁶
6.1 × 10⁻⁹
1.2 × 10⁻⁷
a
The subscript i stands for initial, b for bounce, while f stands for f inal. ρb is the maximum central density at the time of core bounce. Bpol,i and Btor,i abbreviate the initially imposed toroidal and poloidal magnetic fields, whereas Em /|W | stands for the ratio of magnetic to gravitational energy.
Rosa cluster 1 when pushed to ∼ 100ms after bounce. As soon as the full IDSA or the leakage scheme is switched on, this number multiplies by a factor of ∼ 10. Each of these runs require about 300 GB of storage space. However, this number grows at a pace of ∼ 150GB per ∼ 100ms of physical simulation time after core bounce, depending of course also on the rate at which data is written out.
3.4 Non- or slowly rotating core collapse The non- and slowly rotating models’ initial conditions and similar relevant quantities are summarized in tab. 3.1, whilst the GW data is listed in tab. 3.2.
3.4.1 General remarks Non- and slowly rotating progenitors (Ωc,i = 0 . . . 0.3rads−1 in our model set) all undergo quasi-spherically symmetric core collapse. As the emission of GWs intrinsically depends on dynamical processes that deviate from spherical symmetry, the collapse phase in my models (that neglect inhomogenities in the progenitor star) therefore does not provide any kind of signal, as shown in fig. 3.1 for t − tb < 0. However, subsequent pressure-dominated core bounce, where the collapse is halted due to the stiffening of the EoS at nuclear density ρnuc ≈ 2 × 10¹⁴ gcm−3 , launches a shock wave that ploughs through the infalling material, leaving behind 1
Swiss Supercomputing Centre CSCS; URL: www.cscs.ch
105
3 3D MHD Core-Collapse Simulations: Results I
Table 3.2: Summary of GW related quantities of non- and slowly rotating models tf [ms]
EGW [M c2 ]
R0E1CA
130.8
2.15 ×
10−11
R0E1CAIDSA
81.7
1.22 × 10⁻¹¹
R0E3CA
103.9
5.72 × 10⁻¹¹
R0STCA
70.3
1.35 × 10⁻¹¹
R1E1CA
112.8
1.36 × 10⁻¹⁰
R1E1CAHR
25.6
2.42 × 10⁻¹⁰
R1E3CA
130.4
1.43 × 10⁻¹⁰
R1E1DB
112.8
1.24 × 10⁻¹⁰
R1STCA
45.8
2.01 × 10⁻¹¹
R1E1CAL
92.9
1.04 × 10⁻¹⁰
Model
a
a
dir. I II I II I II I II I II I II I II I II I II I II
|A+,b,max | 3 2 3 2 2 2 3 1 3 3 1