20th International Congress on Modelling and Simulation, Adelaide, Australia, 1–6 December 2013 www.mssanz.org.au/modsim2013
Great Barrier Reef Source Catchment’s modelling: Enhanced simulation and water quality targeting through event based assessment C. Dougall a and C. Carroll a a
Department of Natural Resources and Mines, Queensland Email:
[email protected]
Abstract: A decline in marine water quality entering the Great Barrier Reef (GBR) lagoon is associated with terrestrial runoff discharged from adjacent GBR catchments. Reef Plan 2013 outlines water quality targets to address this decline, with the eWater CRC Source Catchment modelling framework used to report progress towards meeting these targets. Catchment modelling is an ideal tool to investigate constituent budgets and the potential impact of management strategies and it follows that the better a catchment model performs spatially and temporally the greater the confidence in targeted management actions. However model assessment data can often be sporadically collected, over different time periods, different locations and from disparate groups of projects. An advantage of the Source Catchment’s framework is the ability to generate daily outputs for discrete periods and locations, thus facilitating aggregation of the disparate monitoring data for use in model calibration and validation. A Source Catchment model has been built for the second largest GBR catchment the Burdekin. The model identifies constituent sources, supply and losses; and explores the impact of a change in land management on loads discharged to the reef lagoon. The Burdekin, like many rivers has had the majority of its water quality sampling located at the end of system gauging station and to better utilise this data in model assessment, events were defined and catalogued by identifying the source of runoff to this site. Speculating; that the process may add to the limited information on the spatial and temporal sources of pollutants within the catchment. An important feature of the Burdekin catchment is the large Burdekin Falls Dam (BFD), and the consensus is that the area below the dam is a major sediment source and an appropriate area for the targeting of ameliorative management action. The classification system identified 35 flow events between 1986 and 2009 at Burdekin End of valley, of these events, 16 were classed as originating from “Above Dam”, 8 “Below Dam”, and 11 were classed as “Mixed” in origin. Of the 16 “Above Dam” events, 11 were classified as discrete flow events from the Upper Burdekin catchment. In contrast the classification system did not identify a discrete sub-catchment source for the “Below Dam” events. “Below Dam” classified events had the highest event mean sediment concentrations (EMC) 0.62 g/l, since they only contributed 6% of the total discharge, these events contributed just 9% of the total sediment load. In contrast, the “Above Dam” events contributed the largest proportion of discharge (41%) and sediment load (42%), with a lower EMC (0.40 g/l). “Mixed” events contributed 34% of the total discharge and 39% of the load, with a similar EMC (0.45 g/l) to the “Above Dam” events. The classification of “Other” had the lowest EMC (0.19 g/l) with 19% of the total discharge and contributing just 9% of the total sediment load. All events irrespective of classification have a proportion of flow and load sourced from above and below the BFD. Nonetheless, it was possible to estimate the above dam and below dam contribution to the total TSS load for the study period. The analysis suggests that 60% of the total load is sourced from “above the dam” and 40 % from “below the dam” for the assessment period (1986 and 2009) The work suggests that above the dam sources may generate greater loads then previously considered and should therefore be further investigated. Additionally the source catchment’s model assessed in this paper was found to under predict “Above Dam” classified events and it appears that a lack of generation from the Upper Burdekin catchment is a likely source of error. Importantly we have outlined a method for utilising water quality data, through event cataloguing of spatial source and daily timestep modelling. A similar approach may prove beneficial for other model users. Keywords:
Source Catchments, Burdekin, reef water quality
3176
Dougall, C and Carroll C., Great Barrier Reef Source Catchment’s modelling: Enhanced simulation and water quality targeting through event based assessment 1.
INTRODUCTION
In a recent Reef Science Consensus Statement agricultural lands have been identified as delivering disproportionate quantities of sediment, nutrients and agro-chemicals from GBR catchment’s to freshwater, estuarine, and marine ecosystems (Brodie et al., 2013). Reef Plan 2013 has outlined water quality targets to address the decline in water quality. To meet these targets and achieve sustainable agricultural production there is a need to both quantify sources of constituent losses from the landscape and to identify strategies that minimise losses to receiving waters (Carroll et al., 2012). Quantifying constituent losses requires knowledge of generation and transport processes from the paddock to freshwater, estuarine, and marine ecosystems. Catchments can act as both source, and store for constituents, with the relative spatial and temporal contributions of each often framed within a constituent budget. Catchment modelling is an ideal tool to investigate constituent budgets and the potential impact of management strategies (Wilkinson et al., 2005). It follows that the better the model performs spatially and temporally the greater the confidence in targeted management actions. This presents the modeler with two common problems, the need to firstly assess and then improve model performance. However obtaining data to assess model performance in catchments is expensive and time consuming and this problem is extenuated in large catchments with variable rainfall, streamflow and catchment condition. Water quality datasets are often scarce, sampled well downstream of their source and represent specific periods that coincide with either droughts or floods. Given these constrains it is challenging to relate process and source to measured loads and therefore assess and improve model performance. Previously the SedNet Model (Wilkinson et al., 2005) has been used in the GBR catchments to determine average annual pollutant loads. More recently the CRC eWater Source Catchment modelling framework has been used to model constituent loads generated from GBR catchments (Waters and Carroll, 2012). One benefit in using Source Catchments is the ability to produce daily time-step outputs that can link with receiving water models. Such an assessment with knowledge on the location, timing and type of events exporting constituents can help assess the suitability of farm management practice, such as improved pasture management (McKeon et al., 2004). Another benefit of a daily time-step model with high spatial resolution is it provides an opportunity to utilise scarce and disparate water quality data sets to evaluate model performance at a range of timescales and specific locations; thereby maximising the often limited available water quality monitoring data. Importantly a Source Catchment model has been built for the second largest GBR catchment the Burdekin (Dougall et al., in review). The model identifies constituent sources, supply and losses; and explores the impact of a change in land management on loads discharged to the reef lagoon. The Burdekin, like many rivers has had the majority of its water quality sampling located at the end of system gauging station. To better utilise this data in model assessment, we defined and catalogued events by flow source at this site. Speculating; that the process may add to the limited information on the spatial sources of pollutants within the catchment An important feature of the Burdekin catchment is the large Burdekin Falls Dam, and the consensus is that the area below the dam is a major sediment source and an appropriate area for the targeting of ameliorative management action (Bainbridge et al. in review; Wilkinson et al. in press). However the analysis in this paper suggest that above the dam sources may generate greater loads then previously considered and should therefore be further investigated. Additionally the source catchment’s model was found to under predict above dam classified events and it appears that a lack of generation from the Upper Burdekin catchment is a likely source of error. Utilising downstream water quality, through event cataloguing of spatial source and daily timestep modelling may prove beneficial for other model users. 2.
METHOD 2.1.
Study Area
The Burdekin Catchment (~130,000km2) is approximately 33% of the total Great Barrier Reef (GBR) catchment area (423,122km2). The region experiences a typical sub-tropical climate with humid, wet summers and mild, dry winters. Average yearly rainfall in the catchment ranges from over 2000 mm in
3177
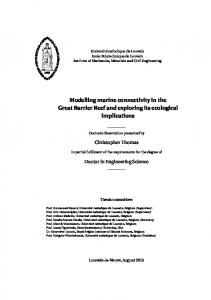
Dougall, C and Carroll C., Great Barrier Reef Source Catchment’s modelling: Enhanced simulation and water quality targeting through event based assessment north-eastern parts to less than 600 mm in south-western areas; however totals can be highly variable due to climatic drivers such as the El Niño Southern Oscillation (ENSO). Major landuses are Grazing (~90%), Conservation (~5%), Dryland Cropping (~1 %) and Sugarcane (~0.8%) Due to the size of the Burdekin Catchment, it is useful to further subdivide the Burdekin into smaller catchments, thus facilitating the calculation of flow and constituent load by sub-catchment source (Figure 1). Due to the considerable trapping of sediment (>60%) by the Burdekin Falls Dam (BFD) (Lewis et al., 2013) we have classified the catchments as either “above” or “below dam” (Figure 1). The Upper Burdekin (1), Cape (2), Belyando and Suttor (3) flow into the Burdekin Falls Dam (BFD) (5). The area below gauges (1,2,3) and immediately upstream of the Burdekin Falls Dam has been labeled the Un-gauged Area Before the Dam (UABD) (4). Mean annual discharge from this area is calculated through the subtraction of the upstream inflow (Sites -1,2,3) from dam overflow, plus the addition of dam evaporation. Flow below the dam is contributed to by the Bowen (6) and the area here referred to as Below the Dam And the Bowen (BDAB) (7). At end of valley (EOV) flow is recorded at the Burdekin River at Clare gauge (8). We note that 76% of the Burdekin (8) EOV discharge (1986-2009) is sourced from the area above the BFD (Figure 1). ID
Catchment
Gauge
Discharge (ML)
% of EOV Catchment Discharge Area (Ha)
Runoff (mm)
Above Dam Catchments
1 Upper Burdekin 120002c 2 Cape 120302b 3 Belyando and Suttor 120303a 4 UABD 5 Burdekin Falls Dam 120004a
4,431,501 662,835 1,359,446
51 8 16
3,584,971 1,576,640 5,029,100
124 42 27
500,979
6
1,147,817
44
6,568,590
76
11,338,528
58
888,613
10
706,335
126
1,148,259
13
812,520
141
100
12,857,383
67
Below Dam Catchments
6 Bowen
120205a
7 BDAB
Burdekin EOV
8 Burdekin
120006b
8,605,462
Figure 1. Burdekin study area and break up of sub-catchments, showing average annual (1986-2009) Discharge (ML), % of Burdekin EOV discharge, catchment area and catchment runoff 2.2.
Model description
Source Catchments is a water quantity and quality modelling framework that has been developed by the eWater CRC (eWater Cooperative Research Centre, 2010). The modelling framework allows users to simulate how catchment and climate variables (such as rainfall, land use, management practice and vegetation) affect runoff and contaminants, by integrating a range of component models, data and knowledge. Dougall et al., (in review) have built a specific Source Catchments Paddock to Reef Model (SCP2RM) for the Burdekin to report on Reef Plan 2009 water quality targets (Department of Premiers and Cabinet, 2009). Fit for purpose models were used to generate the daily pollutant loads for each individual land use. The paddock scale models HowLeaky and APSIM were used to generate loads and reduction in loads due to the adoption of improved land management practices for cropping and cane areas respectively. For grazing areas, the Universal Soil Loss Equation (USLE) was used to generate daily loads with the grazing systems model GRASP used to derive changes in ground cover (C-factor) to represent reductions in loads for different grazing management practice (Shaw et al. 2013). The hydrology calibration process (McCloskey et al., 2011) was developed building on previous work in the GBR (Ellis et al., 2009). The SIMHYD rainfall-runoff model was selected as the preferred model due to its previous application across the GBR. In addition through specific node models storage dynamics of dams and weirs were simulated, as well as irrigation extractions, channel losses, and inflows such as sewage treatment plant discharges. A fixed model run period was used (1986-2009) to report both flow and sediment load. The model was validated against a range water quality monitoring data sets.
3178
Dougall, C and Carroll C., Great Barrier Reef Source Catchment’s modelling: Enhanced simulation and water quality targeting through event based assessment 2.3.
Model Comparison data
For this paper modelled daily runoff and sediment load data was extracted from the SCP2RM for the 8 catchment locations (Figure 1). Monitored daily flow was obtained for the catchment sites from the Queensland Government Hydstra database. Daily total suspended sediment loads (TSS) for the Burdekin EOV site, were sourced from the Load Regression Estimator (LRE)(Kuhnert et al., 2012). Kuhnert et al., (2012) comprehensively outline confidence levels and use of monitored data where available in the load calculations. 2.4.
Event identification
All runoff events that occurred from 1986 to 2009 for the Burdekin River at EOV site (Figure 1 -Site 8) were uniquely identified and recorded in a database. Once the EOV “events” were categorised, the flow from the upstream sub-catchments (Figure 1) was assessed to identify their relative contribution to the total flow recorded at the EOV, according to the following criteria. EOV Event classification The Burdekin EOV flow events were defined by criteria outlined by (Lewis et al., 2006), where an event requires a peak daily discharge greater than 100,000 megalitres (ML) per day. This criteria captured ~75% of the total runoff at Burdekin EOV site, and incorporates flow and sediment sources from the sub-catchments throughout the catchment. To determine the duration of the flow event, an event start date began when flow discharges increased to >5,000 ML/D, generally above a base of 3,000 – 10,000 ML/D and ended when discharge fell below 10,000ML. When these criteria were satisfied hydrograph peaks were examined to classify the event by rainfall type, whether it was a distinct rainstorm or an event caused by depression rainfall. This provides some indication whether the rainfall is likely to be more erosive. A single EOV event peak was classified as originating from a rainstorm event (likely several days of intense rain concentrated in a localised area). In contrast a hydrograph with multiple peaks was classified as a rain depression over a wider area and possibly with less erosive rainfall. Additionally when rain depression peaks were distinct e.g. several days between peaks they were further split into events, thereby representing a later rainfall event. Although this is relatively subjective the majority of flow events were easily classified and many consisted of a single event hydrograph peak. Sub-catchment classification The origin of flow events were then further classified into catchment sources whether Above Dam, Below Dam, Mixed and Other flow using the following criteria: Above Dam –where 80% of the EOV event flows was sourced from above the dam. Below Dam - where 80% of the EOV event flows was sourced from below the dam Mixed – where flow between above and below dam criteria. Other – where flow did not fall into the above classification. (eg. Base flow, small events) In the case of “Above Dam” events it was possible to further delineate catchment source as several events had > 80% of EOV catchment flow sourced directly from the Upper Burdekin catchment and thus are here classified as discrete in nature. If this criterion was not met the “Above Dam” event was classified as “mixed in above dam origin” 3.
RESULTS AND DISCUSSION 3.1.
Event identification
The classification system identified 35 flow events (Table 1) between 1986 and 2009 at Burdekin EOV, of these events, 16 were classed as originating from “Above Dam”, 8“Below Dam”, and 11 were classed as “Mixed” in origin (Table 1). Of the 16 “Above Dam” events, 11 were classified as discrete flow events from the Upper Burdekin catchment. In contrast the classification system did not identify a discrete sub-catchment source for the “Below Dam” events. In terms of rainfall type, “Mixed” flow events were mainly generated by rainfall depressions, while “Below Dam” flow events were more likely generated by storm rainfall. “Above Dam” flow events had an even number of both storm and depression rainfall types. “Below Dam” classified events had the highest event mean sediment concentrations (EMC) 0.62 g/l, but since they only contributed 6% of the total discharge, these events contributed just 9% of the total sediment
3179
Dougall, C and Carroll C., Great Barrier Reef Source Catchment’s modelling: Enhanced simulation and water quality targeting through event based assessment load (Table 1). In contrast, the “Above Dam” events contributed the largest proportion of discharge (41%) and sediment load (42%), but had a lower EMC (0.40 g/l). “Mixed” events contributed 34% of the total discharge and 39% of the load, with a similar EMC (0.45 g/l) to the “Above Dam” events. The classification of “Other” had the lowest EMC (0.19 g/l) with 19% of the total discharge and contributing just 9% of the total sediment load. Table 1. Catalogue of Burdekin Events, showing event, rainfall type, source of catchment flow and load contribution to Burdekin EOV LRE load (1986-2009). Event Type
Catchment Source
“Mixed”
Mixed
Storm (2)
Mixed
Depression (9) 11
Total “Mixed” “Below Dam”
Total “Above Dam”
LRE TSS Load (% of total)
LRE (g/l)
5
9
0.70
28
30
0.41
34
39
0.45
Storm (5)
3
5
0.74
Mixed
Depression (3)
3
4
0.52
8
6
9
0.62
Mixed
Storm (1)
2
0
0.03
Mixed
Depression (4)
20
18
0.34
9
13
0.55
Upper Burdekin
Storm (7)
Upper Burdekin
Depression (4)
10
11
0.47
16
41
42
0.40
19
9
0.19
100
100
0.39
“Other ” Total / Mean
Discharge (% of total)
Mixed
Total “Below Dam” “Above Dam”
Rainfall Type
35
EMC
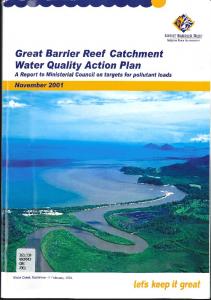
The analysis suggests that “Above Dam” and “Mixed” classified events contribute 42% and 39% respectively of the sediment discharged to the reef lagoon (Figure 2). However all events irrespective of classification have a proportion of flow and load sourced from above and below the BFD. Nonetheless, it is possible to estimate the above dam and below dam contribution to the total TSS load for the study period. To do this we calculated a below dam EMC by assuming that 95% of the load for “Below Dam” events is sourced from below the dam. This yields a below Dam EMC of 0.66 g/l, and thus allows a back calculation of contribution. The LRE load calculations suggests that 60% of the total load is sourced from “above the dam” and 40 % from “below the dam” This is an important finding given other have calculated a greater proportion of below dam contribution (Bainbridge et al. in review). While results indicate that there may be greater efficacy in targeting ameliorative works below the dam (given its smaller catchment area), we note there is some uncertainty, given that above dam contributions can dominate some events and these can be sourced to the Upper Burdekin catchment. In addition although the BFD traps considerable sediment, its efficacy drops with finer particle size (Lewis et al., 2013) and it’s this finer material that travels well into the GBR lagoon during large events (Bainbridge et al., 2012). Thus sediment sourced from above the dam, when sampled at Burdekin EOV is enriched in the finer particle size classes. For better targeting we recommend further investigation into event source identification for years that produce large inshore plumes. It is noted that a well calibrated source catchment’s model would assist this type of investigation.
Figure 2. Percentage of total flow and sediment loads from Above Dam, Below Dam, Mixed and Other sources of events.
3180
Dougall, C and Carroll C., Great Barrier Reef Source Catchment’s modelling: Enhanced simulation and water quality targeting through event based assessment 3.2.
Model Performance - Event Analysis
The total “event flow” from the Burdekin Source Catchment model is within 10% of the gauged stream flow. Likewise, “Above Dam” and “Mixed” modelled flows were respectively just 3 and 8% lower than the measured stream flow. However, the “Below Dam” event flows were underestimated by approximately 27%. “Below Dam” modelled flows tended to be underestimated in the large 07/08 and 08/09 water years and this may be caused by expected small errors in measured stream flow and the method used in this paper. For example, in this paper we have calculated the BDAB flow, through upstream and downstream gauge subtraction and given the large BFD discharges and relatively small below the dam area, differences in gauged stream flow can yield discrepancies. In respect to modelled and monitored sediment loads, “Below Dam” events showed a good fit with LRE sediment loads (R2=0.9). However “Above Dam” and “Mixed Event’s” under predicted sediment load by ~25%. This indicates that above dam sources are being unpredicted by ~25%, and the discharge and high sediment concentrations present in the Upper Burdekin catchment (Bainbridge et al., in review), highlight the area as a likely source of error. The above analysis suggests an underestimate of loads from the Upper Burdekin catchment by the Source Catchment model. 3.3.
Upper Burdekin - Event Performance Examples
The event classification system identifies 11 events that have >80% of EOV flow sourced from the Upper Burdekin. We identified the events that were well sampled, and thus have higher LRE confidence levels. The Burdekin EOV EMC for these events is ~0.6 g/l while the model is ~0.3 g/l, and this analysis adds further evidence to the case that the modelled event loads are under estimated from the Upper Burdekin catchment. The area is somewhat similar to the Bowen catchment with a high proportion of sodic gully systems and scalded areas that feed directly in to these systems. 4.
CONCLUSIONS AND RECOMMENDATIONS
The daily time step Source Catchments model provided the opportunity to examine discrete event data and this required a methodology to categorise events that allowed the identification of potential spatial sources of EOV sediments loads. The analysis suggests that the majority of the EOV sediment load is sourced from above the dam and this may challenge previous findings, however the results are preliminary in nature. Importantly the daily time step Source Catchment modelling framework provides opportunity to improve our confidence in model predictions by enabling the user to integrate a more extensive pool of discrete validation and calibration data. ACKNOWLEDGMENTS We thank Rob Ellis and Ross Searle for model coding and Petra Kuhnert for the supply of the LRE data. In addition we thank many reviewers for comments and suggestions REFERENCES Bainbridge, Z.T., Wolanski, E., Álvarez-Romero, J.G., Lewis, S.E., Brodie, J.E., 2012. Fine sediment and nutrient dynamics related to particle size and floc formation in a Burdekin River flood plume, Australia. Mar. Pollut. Bull. 65, 236-248. Bainbridge, Z., Lewis, S., Smithers, S., Kuhnert, P., Henderson, B., Brodie, J. In review. Suspended sediment sources, transport and export from a large, seasonally-dry tropical catchment: Burdekin River catchment, Queensland, Australia. Water Resources Research. Brodie, J., Waterhouse, J., Schaffelke, B., Kroon, F., Thorburn, P., Rolfe, J., Johnson, J., Fabricius, K., Lewis, S., Warne, M., Mckenzie, L., 2013. 2013 Reef Scientific Consensus Statement, Land use impact of GBR water quality. http://www.reefplan.qld.gov.au/about/assets/scientific-consensus-statement-2013.pdf. Carroll, C., Waters, D., Vardy, S., Silburn, D.M., Attard, S., Thorburn, P.J., Davis, A.M., Halpin, N., Schmidt, M., Wilson, B., Clark, A., 2012. A Paddock to reef monitoring and modelling framework for the Great Barrier Reef: Paddock and catchment component. Mar. Pollut. Bull. . Department of Premiers and Cabinet, 2009. Reef Water Quality Protection Plan, 2009, For the Great Barrier Reef World Heritage Area and adjacent catchments.
3181
Dougall, C and Carroll C., Great Barrier Reef Source Catchment’s modelling: Enhanced simulation and water quality targeting through event based assessment Dougall C. (2013).In Review. Modelling Reductions of pollutant Loads due to improved management practices in the Great Barrier Reef Catchments – Burdekin NRM Region, Volume 4. Department of Natural Resources and Mines. Technical Report October 2013 Ellis, R., Doherty, J., Searle, R., 2009. Applying parameter estimation and prediction uncertainty analysis to WaterCAST water quality models. MODSIM 2009 International Congress on Modelling and Simulation. Modelling and Simulation Society of Australia and New Zealand, Cairns. eWater Cooperative Research Centre, 2010. Source Catchments Scientific Reference Guide. Kuhnert, P.M., Henderson, B.L., Lewis, S.E., Bainbridge, Z.T., Wilkinson, S.N., Brodie, J.E., 2012. Quantifying total suspended sediment export from the Burdekin River catchment using the loads regression estimator tool. Water Resources Research. 48. Lewis, S.E., Bainbridge, Z.T., Kuhnert, P.M., Sherman, B.S., Henderson, B., Dougall, C., Cooper, M., Brodie, J.E., 2013. Calculating sediment trapping efficiencies for reservoirs in tropical settings: A case study from the Burdekin Falls Dam, NE Australia. Water Resources Research, 49, 1017. Lewis, S.E., Brodie, J.E., Ledee, E., Alewijnse, M., 2006. The Spatial Extent of Delivery of Terrestrial Materials from the Burdekin Region in the Great Barrier Reef Lagoon. ACTFR REPORT NUMBER 06/02. McCloskey, G.L., Ellis, R.J., Waters, D.K., Stewart, J., 2011. PEST hydrology calibration process for Source Catchments - Applied to the Great Barrier Reef, Queensland. MODSIM 2011 - 19th International Congress on Modelling and Simulation - Sustaining Our Future: Understanding and Living with Uncertainty, 23592366. McKeon, G.M., Hall, W.B., Henry, B.K., Stone, G.S., Watson, I.W., 2004. Pasture degradation and recovery in Australia's rangelands: Learning from History. . Shaw, M., Silburn, D.M., Biggs, J., Thorburn, P., Whish, G., Ellis, R., Searle, R., 2013. Paddock scale modelling to assess agricultural management practice effectiveness in improving water quality in the Great Barrier Reef Catchments. MODSIM2013, 20th International Congress on Modelling and Simulation. Modelling and Simulation Society of Australia and New Zealand, December 2013, Adelaide, South Australia. Piantadosi, J. and Anderssen, R.S. (eds). Waters, D., Carroll, C., 2012. Great Barrier Reef Paddock and Catchment Modelling Approach and Quality Assurance Framework. Wilkinson, S.N., Olley, J.M., Prosser, I.P., Read, A.M., 2005. Targeting erosion control in large river systems using spatially distributed sediment budgets. IAHS-AISH Publication, 56-64. Wilkinson, S.N., G.J. Hancock, R. Bartley, A.A. Hawdon and R.J. Keen (in press), Using sediment tracing to assess processes and spatial patterns of erosion in grazed rangelands, Burdekin River basin, Australia, Agriculture, Ecosystems and Environment, doi:10.1016/j.agee.2012.02.002.
3182