compute resources loaded with both Avaki and SAS\CONNECT software. (Fig 1). Fig. .... summarizing and processing using SAS analytics. Hein and Westfall ...
Grid Computing at Texas Tech University using SAS Ronald Bremer, Jerry Perez, Philip Smith, and Peter Westfall Texas Tech University
Introduction Grid computing creates a distributed computing environment that leverages unused computing resources to obtain information that would otherwise take weeks or months to process. The promise of extraordinary increases in computing ability for minimal additional investment in IT has made grid computing a hot topic in business, academic, and research environments worldwide. Additionally, making a network capable of grid computing can have significant side benefits in revealing system-wide network problems and enforcing good communications and security practices. On the other hand, our experience shows that implementation is not a cake-walk; there are substantial set-up costs, limitations on compute problems to which grid computing can be applied successfully, and security concerns. Texas Tech University (TTU) has recently embarked on a High Performance Computing Initiative to use grid computing to leverage resources campus-wide. Various commercial and in-house grid hardware and software products are used, including Avaki (both compute and data grid) and SAS/CONNECT; additional products being investigated and/or developed include Globus, Sorcer, and Altair Grid. Our SAS grid is comprised of 200+ high powered Windows machines in the computer labs of the Rawls College of Business Administration at TTU; only 100 of these machines are available at any given time because of limited SAS licenses. Available licenses are managed though a keyserver application. Thus, the computing environment can be conceptually viewed as a virtual 100 node (2.66 GHz per node) super computer with 100 Gigs of combined RAM. These computers are used during the day by students to complete their daily assignments; SAS grid jobs have been run while students are using them with no noticeable adverse performance. During the night these machines are unavailable to students, thus yielding a prime opportunity to use spare cycles. The SAS/CONNECT Multi-process connect (MP CONNECT) functionality provides an essential tool for distributing compute jobs. We currently use the %Distribute macro provided by SAS (Doninger and Tobias, 2001) to access this functionality and to solve complex computing tasks. Our experiences with distribution efficiency, simultaneous use, security issues, machine hangs, and file I/O are presented in this paper.
SAS Grid Configuration Issues Network Administration Concerns about general and advanced grid network configuration, including Domain
64
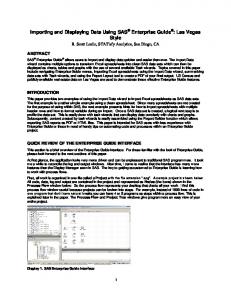
Name Services (DNS), resource naming, and routing became evident as initial tests of the SAS grid were implemented. One problem was that access to compute resources was not possible at the outset due to misconfigured DNS settings on the global TTU network; this problem has since been fixed. Another requirement is that the user management and access control mechanisms need to be standardized so that each compute resource can be accessed for successful job distribution. Through the use of a global domain user name and password schema, users of the SAS grid can use the resource if they are legitimately registered users of the university’s Windows Domain. Since users of the SAS grid use a domain login to secure access, securing distributed SAS grid systems, including implementing security policies and system auditing, can be transparently implemented without interruption of services for both SAS users or general domain users who utilize the compute resources for everyday tasks such as web surfing or paper editing. Troubleshooting and maintenance of the SAS grid requires special attention. Some resources are not always available due to unforeseen down time or simply caused by a system being turned off. As a result of this, there was a need to create a monitoring mechanism that can verify the functionality of a compute resource. Through TTU research efforts and a collaborative Master’s thesis project with computer science graduate students, a grid-based Grid Resource Monitoring Page (GRMP) was created using Avaki grid middleware to check the viability and availability of grid-based compute resources loaded with both Avaki and SAS\CONNECT software. (Fig 1).
Fig. 1 Grid-based Grid Resource Monitoring Page (GRMP). Network Hygiene The concept of asking organizations to conform to strict networking standards that allows the correct and secure functioning of the SAS grid is known as Network Hygiene.
65
Network Hygiene encompasses all aspects of network operations and secure computing such as threats to integrity, vulnerabilities related to system weakness, including privacy, and functionality. Deployment of SAS grid at TTU has resulted in an increased awareness and adherence to Network Hygiene that has contributed to the improvement of network security as well as the overall improved performance and reliability of network operations.
Applications Jobs that can be partitioned as essential replicates of a fundamental task can be handled with using %Distribute macro described above. Toy Example: Validity of Random Number Generator As a “toy” example, we consider validation of the SAS random number generator RANUNI. A common concern is that random number generator algorithms may produce successive values that are serially correlated. If successive calls U1, U2 to RANUNI produce uncorrelated values, then 6(U1-U2)2 should be =1.0 on average, and 1) in the case of positive (negative) serial correlation. Since deviations can be subtle, a very large simulation size is needed to test it. This is a perfect example for grid computing, because the problem (a large number of simulations) can be viewed as replicates of a fundamental task (simulations involving smaller sample sizes). The following code utilizes the %Distribute macro to run this job using our SAS grid. data _Hosts; input Host $19. Username $9. Password $10.; datalines; Bam120L.ba.ttu.edu ********* ********* Bam121L.ba.ttu.edu ********* ********* (… Remaining host machine list) ; %macro RInit; rsubmit remote=Host&iHost wait=yes macvar=Status&iHost; %macro FirstRSub; /* Initialize host machines */ options nonotes; data Sample; if (0); run; %mend; %macro TaskRSub; /* Define the basic fundamental task */ proc iml; check = 0; do i = 1 to &rem_Niter; check = check + 6*((ranuni(&rem_Seed)-ranuni(&rem_Seed))**2; end; check = check/&rem_Niter; create iSample var {check}; append from check; quit; data Sample; set Sample iSample; run; %mend; endrsubmit; %mend; %let NIter
=
100000; /* Size of fundamental task (the chunk) */
66
%let NIterAll = 5000000; /* Size of global task */ %SignOn; /* Sign on to the collection of hosts */ %Distribute; /* The Distribute macro distributes the job to hosts */ %RCollect(Sample,Sample); /* Collect results from hosts */ proc means data=Sample n mean stderr lclm uclm; /* Process results */ var check; run;
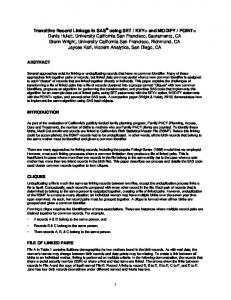
As “chunks” of the fundamental task are distributed to the hosts, a status line is printed to the SAS log on the client, displaying “.” for hosts that are currently working, “!” for hosts that are currently waiting to be assigned work, and “X” for hosts that are unable to do work for some reason. Additional status information includes the number of fundamental tasks submitted and completed so far. When the distribution is complete, the system will display a breakdown of how much work was done on each host, together with an over-all summary of the efficiency of the distribution. Experience with the process suggests efficiency is enhanced by making the “chunks” large enough so that the host machines take a minute or so to process the job. Wasted time due to network latency results from smaller “chunk” sizes. Figure 2 illustrates the increase in efficiency associated with larger chunk sizes in this example.
Figure 2: Efficiency increases with larger “chunks” of analysis performed by the individual hosts. The result of the “Toy example” is that no systematic deviations from independence were noted for the RANUNI random number generator, even with sample sizes in the billions. Confidence intervals for mean almost always included 1.0, with rare exceptions at the expected 5% rate. An Academic “Success Story” We had occasion to use the SAS grid to facilitate an academic publication. In Hein and Westfall (2004) statistical resampling methods are developed for testing whether
67
announcements and other historical events affect stock prices. Resampling is a computer-intensive method where the data are sampled repeatedly (say 10,000 times) with or without replacement; in the Hein-Westfall paper each resampled data set required costly matrix inversions. Adding to this computational complexity, the resampling procedure itself was studied using 10,000 simulations, for a total of 100,000,000 processed data sets. Adding to the complexity, there were some 10 parameter settings investigated, making the 1 billion data sets. Previous versions of this research relied on a “sneaker grid,” where parcels of code reflecting portions of the billion data sets were given to graduate students to run overnight on their machines. The so-called “sneaker grid” is thus named because the process can be viewed as a person running from office to office “in his sneakers,” handing out parcels of code. The results were then collated (essentially manually) from output files, and the “sneaker grid” process was repeated over multiple nights until the 1 billion runs were complete. The %Distribute macro offers a fantastic advantage over the sneaker grid in that the runs are all sent at the same time, and all data are sent back to the client machine for automatic summarizing and processing using SAS analytics. Hein and Westfall used 40 minutes of compute time on our SAS compute farm, and would have used 25 hours on a single machine. It should be noted that the savings (40 minutes versus 25 hours) is actually quite a bit more when considering the “false starts” and minor errors that always accompany job runs: there were approximately four false starts, so the total savings is really 5x40 minutes = 3.3 hours, vs. 5x25 hours = 125 hours. An Ongoing Project: Portfolio Selection and Analysis Portfolio selection and management is a staple of financial theory and application. An ongoing SAS grid project involves evaluation of portfolios. The study involves randomly forming 300 portfolios, each comprised of 50 securities taken from the CRSP daily database, and then randomly choosing a one year sequence of daily stock prices. There are over 20,000 securities in the CRSP database; a subsetted SAS data set with essential variables required 1.362 Gigabytes. On each portfolio, the current research project requires 127,500 models using PROC AUTOREG of SAS/ETS. On an 866 Megahertz PC, the computations for each portfolio take approximately 40 hours, and the entire analysis would require around 500 days of continuous compute time on a dedicated machine. We again use the %Distribute macro. The fundamental task for the financial simulation, taking about 15 hours of processing time per machine, is composed of the following steps: • • •
Randomly sample the 50 securities from the CRSP database. Fit a base model version of each of the fifteen models for each security. Fit each of the fifteen models to each security after each of 169 transformations.
68
The only feasible solution to this computation problem is to use grid computing. Advanced econometric analysis is an integral portion of the study, so the SAS grid is currently the only viable option (as opposed to, say, writing native C code and distributing the executables across the network using software such as Avaki or Globus). The next section addresses experiences learned in this project.
Issues, Difficulties and Workarounds While grid computing can result in great savings, there are barriers to entry into the world of grid computing (SAS or otherwise). In this section, we detail some experiences, frustrations, and workarounds that we have discovered in the process of implementing the SAS grid at TTU, with the aim of highlighting pitfalls likely to befall other potential grid users. Issue 1: Server Issues: Simultaneous Reads from a Large Database A number of server problems were encountered when this fundamental task was attempted as a grid run in the portfolio selection study described above. The server on which the CRSP database was stored could not handle multiple read requests that occurred when all machines attempted to perform the random sampling step. The CRSP database was originally stored on a disk drive used only for grid projects (the grid disk drive). The Rawls College uses a VAX/ALPHA server for this drive; the same server was also used as the main Email and print server. The grid run very quickly exceeded the capability of the server. Under ideal situations, 10 machines could perform the random sampling without experiencing I/O errors; however, the server was rarely operating under ideal situations. It was not uncommon that with 2 machines performing the random sampling step, an I/O error would occur in at least one of the two machines. A stall routine was written so that a specified average number of computers were performing the sampling at any given time. %MACRO stall(machines,numatonce,tasktime); DATA _NULL_; timebeg=TIME(); stall=FLOOR(UNIFORM(0)*(&machines/&numatonce))*&tasktime; timeend=INTNX('MINUTE',timebeg,stall,'END'); DO UNTIL (time()>timeend); END; %MEND:
In the stall macro, machines is the number of total hosts used in grid run, numatonce is the average number of machines performing the task at one time and tasktime is the length of time (in minutes) a single machines takes to complete the task. Some experiences with the stall macro are discussed in issue 5 below. Use of the grid caused slow Email and loss of print queues on the VAX/ALPHA server, disrupting IT service to the Rawls College. Thus it became quickly apparent that a separate dedicated server was needed; we used an 866 Megahertz PC.
69
Issue 2: Data Analytic Problems within Procedures In the portfolio selection and analysis project, one or more securities in about 5% of the portfolios resulted in numerical problems (e.g., failure to converge) in the AUTOREG procedure. A feasible screening rule to eliminate this problem was not found. Performing the second step of the fundamental task clearly indicated which portfolios had a problem of this type. It was decided to perform the initial sampling step, and the second step of the fundamental task was performed on a single machine. The resulting sample files and the files created in the second step of the fundamental task, which were needed in the third step, were saved on the grid disk drive. These steps resulted in four groups of 75 portfolios and the associated files produced by the second step of the fundamental task. This avoided the server problems in the grid runs which resulted from the initial sampling from the large database but spawned other problems which are discussed in Issues 3-5 below. Issue 3: Consequences of I/O Errors Experienced by a Host Limitations of the currently used version of the %Distribute macro caused no results to be reported back to the client machine if any of the host machines experienced an I/O error (we are working with SAS on this issue, and a fixed %Distribute macro will likely be available by the time this is printed) To work around this problem the output was compiled on the host machine and saved to the grid disk drive after the calculations for each of the transformations was performed. No output was sent back to the client. This resulted in issues 4 and 5 below. Issue 4: Read/Write Permissions Since the grid runs used the college's lab computers, a separate login account was set up with read and write permissions on the grid disk drive. The login used by the students using the lab had only read permissions. Issue 5: Server Issues: Multiple Read/Writes by each Host The modifications discussed in Issue 2 resulted in each machine needing to read a onehalf megabyte file in the first step and fairly quickly each machine would be saving a relatively large number of small files to the grid disk drive. This resulted in the server being overwhelmed. It was determined that the CPU was not adequate to handle the read and save request. Windows is not efficient at serving files. The configuration could handle less than 25 hosts in a grid run. The goal was to use 75 hosts. The next iteration was to upgrade the server to a 2.4 Gigahertz machine and to reduce the number of write requests made to the server by compiling the output resulting from the different transformations into bigger units. A grid run using 75 hosts was performed and of these 37 of the hosts successfully completed all calculation with no apparent I/O errors. When it was attempted to open the files produced by these 37 hosts, -1 page numbers were indicated in 15 of the produced files. Of the 38 which experienced I/O errors, 16 of the hosts experienced them in the initial data read, another 12 experienced write errors during the 2nd or 3rd portions of code, and the other 10 experienced write errors in a fairly uniformly distributed fashion during one of the remaining 8 portions of code.
70
The 38 which failed in the first grid run of 75 hosts was resubmitted to 38 hosts. Five of the hosts experienced I/O errors: 2 in the initial read, 2 in the next three portions, and one in the final portion of the run. When the produced files were opened, none were corrupted. A smaller number of hosts was then tried. Runs using 25 hosts were first attempted. Without the use of the stall routine 3-5 of 25 hosts experienced I/O errors in the initial data read. Approximately 5 hosts experienced I/O errors in later file writes. The stall macro was then added and runs of 38 hosts were attempted. With the stall macro none of 38 hosts experienced I/O errors in the initial data read and 3-5 hosts experienced I/O errors in later file writes. The final solution to this problem is yet to be found. One option being considered is to install an operating system on the server controlling the grid disk that is more efficient at managing read/write commands from multiple host, or install a data grid. The other option is to use a data grid to manage the read/write activities. Issue 6: Filled Buffers on Host Machine With over 100,000 procedure calls and over 500,000 data steps in each fundamental task of the portfolio selection and analysis project it was important to suppress all Log and Print files. All information to be compiled came from ESTOUT= options and OUTPUT statements. The system options NONOTES, NOSPOOL and CLEANUP, and the Output Delivery System commands "ODS LISTING CLOSE;" and "ODS NORESULTS;" helped prevent the buffers from filling up on the host machines. Obviously, clean code is also needed so that warnings or errors are not accumulated in the Log file.
Security Issues Telnet Network security in a campus-wide setting is of utmost importance. One of the challenges SAS/CONNECT presented was the use of Telnet and its corresponding ports to connect computers together to form the SAS/CONNECT Grid. When other system administrators around campus heard of the use of Telnet, the idea of using SAS/CONNECT became less compelling. Why is the use of Telnet a concern? There are three main problems with Telnet, making it a bad choice for modern Grid systems from the point of view of security: • •
•
Commonly used Telnet daemons have several vulnerabilities discovered over the years, and probably several more still exist. Telnet does not encrypt any data send over the connection (including passwords), and so it is trivial to eavesdrop on the communications and use the password later for malicious purposes. Telnet lacks an authentication scheme that makes it possible to ensure that communication is carried out between the two desired hosts, and not intercepted in the middle.
71
According to Cheryl Doninger of SAS, there are a couple of choices to solve the Telnet security concern - you can either run a connect spawner on each of the grid nodes and even get rid of scripts completely, or you could use ssh tunnelling. Further investigations of these options are ongoing.
Future Directions and Acknowledgment Starting Fall 2004, we will have a SAS farm comprised of 300 machines running SAS version 9.0 and the latest version of the %Distribute macro. It is hoped that many of the issues that we have encountered will be overcome. We are grateful to the SAS staff, particularly Randy Tobias, Cheryl Doninger, and Stephanie Tysinger, for providing timely support with regard to our grid computing issues. In many cases the problems are purely at the local level, having to due with network integrity and server efficiencies. Nevertheless, they cheerfully helped us work through these issues. For future development, we are hopeful to use Avaki Data Grid in conjunction with the SAS grid to access remotely stored data to serve distributed SAS grid compute resources to allow many resources to access a large dataset all at once, thus integrating the two grid systems to create what is known as “Grid-of-Grids”. As far as applications go, we plan to involve the statistical research faculty more in simulation projects. Additionally, there are several mathematicians at TTU interested in Stochastic ODEs. These are ordinary differential equations of the form Y’ = f(t,Y) + g(t,Y)W’, Y(0) = 0; where W’ denotes “White noise.” Typically one asks statistical questions of the ensemble of sample paths generated, such as the mean at Y(1), or the variance of Y(1), etc. (Kloeden and Eckhard, 1999). These problems can take days or weeks to compute on a single machine. There is also interest in the partial differential analogue of these problems. With SAS’ suite of built-in analytic and mathematical tools, the SAS grid is well suited to address these problems.
References Doninger, C. and Tobias R. (2001). The %Distribute System for Large-Scale Parallel Computation in the SAS® System. Data Analysis Papers and Presentations, SAS Institute Inc. Hein, S.E. and Westfall, P.H. (2004). Improving Tests of Abnormal Returns by Bootstrapping the Multivariate Regression Model with Event Parameters. Journal of Financial Econometrics 2, 451-471. Kloeden, P. E. and Platen, E. (1999). Numerical Solution of Stochastic Differential Equations. Springer-Verlag, New York.
72