Grid Enabling Applications Using Triana Ian Taylor1, Matthew Shields2, Ian Wang2 and Roger Philp3 Contact:
[email protected]
Abstract In this paper, we describe the Triana problem-solving environment and outline how a scientist might use it to modularize their applications into a set of cooperating components. We show that using this approach, applications can be distributed onto the Grid in a flexible and intuitive way using any of the distribution policies and mechanisms available within Triana. This is illustrated through the use of example by describing the implementation of a monolithic galaxy formation visualization code into a set of Triana units that can be deployed onto the Grid. We outline the middleware independent nature of Triana through the use of the GAT application-driven API and describe how a user would take advantage of this functionality through the use of the Triana GUI.
1. Introduction Recently, there has been significant interest in the field of Grid computing and the convergence of Grid Computing and Web Services in the form of the Open Grid Services Architecture (OGSA) [1]. This has given rise to an enormous drive in this direction by both industrial [2] and academic projects, such as Globus [3]. In parallel, peer to peer (P2P) technology has gained much interest through the popularity of services like Gnutella [4] and SETI@home [5]. One recent advance has been the emergence of architectures that support the programming of such networks e.g. project JXTA [6], which defines a set of protocols that can be used to create decentralized P2P networks. Grid Computing and P2P computing are both important emerging paradigms for seamless aggregation and utilization of the ever-increasing computing resources available today throughout the world. P2P is more focused on computing at the edges of the Internet i.e. transient devices that live behind NAT, firewalls etc whereas Gird computing is far more focused on connecting virtual organizations [7] that can cooperate in a collaborative fashion. Application developers however are often left confused about exactly which middleware/infrastructure to use when grid enabling their application. They are faced with a collection of differing APIs that claim to do similar things, but which have a rather steep learning and implementation curve for deployment of their applications onto the Grid. To this end, an important advancement has been achieved by defining the Grid Application Toolkit (GAT) API [8]. The GAT provides an application-driven API and implements key bindings to the various underlying mechanisms for the implementation of this functionality. Further, the GAT can be dynamically switched at run time to utilize the functionality that exists on a particular platform or environment. Current GAT implementations include Web Services (OGSA to follow shortly), JXTA and local services for prototyping applications.
1
Department Of Computer Science, Cardiff University Department of Computer Science and Physics and Astronomy, Cardiff University 3 Cardiff Centre for Computational Science and Engineering, Cardiff University 2
In this paper, we describe Triana, an application that takes advantage of the GAT interface. We then give an overview of how Triana has recently been used to grid enable an existing galaxy formation visualization application and how this can be distributed across the Grid using the Triana distribution mechanism. The next section gives a brief overview of Triana, followed by a description of how one would use Triana to implement a distributed application. We then discuss the mechanism of how Triana distributes its units, the role of the GAT and how a user would specify this using the Triana GUI.
2. Triana Triana [9] is a visual programming environment that allows users to compose applications from programming units (or components) by dragging and dropping them into a workspace, and connecting them together to build a workflow graph. Triana was initially developed by scientists in GEO6004 to help in the flexible quick-look analysis of data sets. It therefore contains much of the core tools that are needed to support the analysis of one-dimensional data sets. For example, we have: flexible data importers/exporters; numerous signal processing algorithms; mathematical functions; and visualization tools based on the integration of commonly used packages, such as SGT [10] and XMGrace [11].
Figure 1: Image processing using Triana. This network extracts the edges from an image. Triana can be used by applications in a variety of ways through the use of its ‘pluggable software architecture’. For example, it can be used as a: graphical workflow composition system for grid applications; a data analysis environment for image, signal or text processing; and it can be used as 4
GEO 600 Home Page: http://www.geo600.uni-hannover.de/
an application designer tool, creating stand-alone applications from a composition of components. The Triana user interface consists of a collection of toolboxes (see left panel on Figure 1) containing the set of Triana components and a work surface, for composition (see right panel). Within Triana you program graphically rather than writing source code to implement the behaviour you require. It has many of the key programming constructs e.g. looping e.g. do, while, repeat until, and logic units e.g. if, then etc that can be used to graphically control the data-flow, just as a programmer would control the flow within a conventional program using specific instructions. In this sense, Triana is a graphical programming environment. Programming units (i.e. tools) include information about which data-type objects they can receive and which ones they output and Triana performs dynamic run-time type checking on requested connections to ensure data compatibility between components serving the same purpose as the compilation of a program for compatibility of function calls.
Triana Controlling Service (TCS)
Other Engine
Triana Engine
Figure 2: The Triana pluggable architecture. Applications can plug into any of the insert points (indicated by the white circles). Triana is divided into a set of modularized pluggable interacting components. Briefly, the Triana GUI is a thin-client that connects to the Triana engine either locally or via the network (see Figure 2). Clients can log into a Triana Controlling Service (TCS) remotely build and run a Triana network and then visualize the result on their device even though the visualization unit itself is run remotely. Clients can log off without stopping the execution of the network and then log on at a later stage to view the progress (perhaps using a different device e.g. mobile phone, handheld). In this context, Triana can be used as a workflow monitoring system for Grid applications. Further, since any Triana network can be run with or without using the Triana GUI, Triana networks can be run as executables in a standalone mode. This architecture supports multiple usage scenarios. Programmers can use Triana at various levels by being able to plug in their own code at any of the insertion points within the system (indicated in figure 2 by the white circles). At these points, Triana reader and writer interfaces allow the integration of tools, task-graphs (e.g. BPEL4WS, WSFL) and GUI commands. There are 3 main ways of using Triana, by: 1. Using the Triana GUI directly on top of an existing application. The reader/writer interfaces can be used to connect Triana easily with existing applications. There are command writers (exporting the commands from the GUI) and workflow writers (exporting the taskgraph of the composed components). 2. Using the remote control facility to an existing application. Programmers can use Triana in the same way as above but take advantage of the remote control facility for logging on and
off to the TCS. Existing applications can then be inserted behind the TCS on the remote machine. Here, the scheduling will implemented by a third party system e.g. Condor 3. Modularizing their application into a collection of cooperating Triana units. This is by far the most advanced form of usage as the application becomes far easy to prototype and extend (by adding extra components) and can be seamlessly distributed using the Triana distribution mechanisms (see next section). In the next section, we describe how we used this mechanism to implement a distributed version of a galaxy formation visualization code.
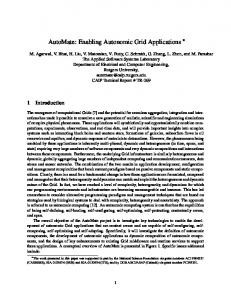
3. Creating Distributed Applications Using Triana 3.1. Galaxy Formation Visualization Background Galaxy and star formation using smooth particle hydrodynamics generates large data files containing snapshots of an evolving system stored in 16 dimensions. These dimensions are things like particle positions, velocities, and masses, type of particle, and a smooth particle hydrodynamic radius of influence. After calculation each snapshot is entirely independent of the others allowing distribution over the Grid for independent data processing and graphic generation. Processing may involve simple view port reorientation or more complex line of sight mass density calculations. A simple small graphic can then be returned to the client chronologically for animation.
Figure 3: Typical Images as the result of a Galaxy Simulation. This particular calculation is the result of evolving 120000 sample points: 40000 gas, 40000 Baryonic matter, 40000 star forming particles, courtesy A. Nelson, P. Williams and R. Philp, Cardiff University. The user of the code would like to visualize this data as an animation in two dimensions with the ability to vary the point of view, project that particular two dimensional slice and re-run the animation (see Figure 4). Due to the nature of the data, each frame or snap shot is a representation at a particular point in time of the total data set, it is possible to distribute each time slice or frame over a number of processes and recalculate the different frame view based on the projection point, in parallel. One of the main reasons for distributing the processing of these frames is their shear size. Currently a simplistic simulation with say a million particles may have a raw data frame size of 60 Mbytes, with an overall data set size of the order of 6GBytes, hence making the overall computation of the graphics themselves very intensive and difficult to do in real time on a sequential computer. However, the frames are independent once they are produced and can be processed individually, although at viewing they do have to be put into the correct chronological order.
z Viewpoint
y
Projection Plane
x Figure 4: The user changes the view port and the 3-D simulation is projected onto a 2-D plain for viewing. The original visualization application was written in Java as a standalone application. The Triana team worked to modularize this code into a set of Triana units. Triana then enables the composed application to be distributed across the Grid. The next section describes the modularization process in more detail. 3.2. Modularizing the Galaxy Formation Code The process consists of three distinct phases, first the data files are parsed according to their format and the data loaded into data structures. Each data segment represents a distinct time frame or snap shot within the animation. The 3D data sets are then projected down onto a 2D plane from a viewpoint using a calculation. Finally the 2D frames are run together to form an animation. The inherently modular nature of the process together with the discrete nature of the data in the data sets make this a good candidate for splitting into components. The first component in the implementation (see Figure 5) encapsulates the first phase of the process. The simulation data file loader (DataFrameReader) takes the file and generates a series of data structures representing the time frames in the data set and outputs them. The second phase is the calculation of the two dimensional projection and generation of an image this is the functionality of the ViewPointProjection unit. As Triana already contains an image viewer unit (ImageView) that will animate if it receives consecutive images the third phase of the process is simple as long as the calculation component can generate a pixel map image. The whole original process can be modeled using the three components and connecting them together. We only have to create two components because of Triana’s extensive library of components. The two new components were built using Triana’s built in tool builder to generate code skeletons and then edited to take the appropriate code with very little modification from the original application. It is possible to extend the process and buffer the data for future calculations based on a new view point using the Sequence unit, this is a simple data player component that saves us having to run the DataFrameReader component multiple times, which depending on data size can be expensive.
Figure 5: The Galaxy Formation Code implemented as a set of Triana units. The upper workspace containing three components is an unbuffered player: it reads data from the data file every time the player is activated. The lower workspaces stores the data frames in a sequence buffer for reuse. 3.3. Distributing the Galaxy Formation Data The loaded data is divided into frames, distributed amongst the various Triana servers on the available network and processed to calculate whichever analysis is required, for instance this might be a simple viewing of the morphology of the Galaxy or it might be a much more numerically intensive analysis of calculating the column density using smooth particle hydrodynamics: essentially how much mass there is along a line of sight assuming an optically thin Galaxy. Currently the distribution of the data amongst the Triana servers is simple: the local thin client locates a data file, and then read the data from each frame and then distributes the data to a Triana server for processing. This is inefficient in two respects. First, there is a high startup cost in distributing the data: given the discussions above. Secondly, there is no inherent resiliency in the network: if a node dies what happens then? In the longer term we propose to overcome these problems as follows. First to take advantage of the nature of P2P computing we intend to distribute the data at the outset (at creation time) to a number of data repositories that will act as a data service provider. Then we intend to modify the paradigm for the data creation to include a metadata layer. The metadata will contain information relating not only to the internal structure of the data and the data frame offsets but also to the repository locations. The user at the thin client will then access the metadata file instead of the actual data. The thin client will then issue repository locations and data frame offset references to the remote Triana servers. The servers then locate the data repositories
and only load those frames with the given frame offsets. The advantage of this is that not all servers will access the same repository thus reducing disk access and network bottlenecks. It is also intended to provide a robustness to the system by issuing instructions to the remote server to not only load their data frames but to load some of the data frames assigned to other servers. It is envisaged that the thin client will be able to determine the failure of any server and reassign its frames if need be: if a server is lost then there is automatic redundancy built into the network. The ability to distribute the data, particularly in the cases of Galaxy and Star Formation, is due to the fact that runtimes currently are measured in months of CPU time and so the time average load on the network is in fact kept to a minimum. The instructions as to what the remote Triana servers then do with the data are handled by the remote application steering in the next section. 3.4. Remote Application Steering There are two separate user interfaces that allow the remote steering of the Galaxy Formation test case. One is the generic SequenceBuffer tool and the other is the user interface from the ViewPointProjection unit. Every Triana unit that implements a user interface can be viewed remotely. In this case by setting the new X, Y and Z parameters in ViewPointProjection, the user can simultaneously update these values on all nodes. Similarly, for the Sequence Buffer, the animation can be remotely started simultaneously by triggering each node i.e. by pressing the start button. The ViewPointProjection unit’s user interface on the user’s local machine is used to steer the entire process. The user can select the precise view point using the given coordinates. If the user wants a different view of the data he changes these coordinates and presses the start button. Messages are then sent to all the distributed servers so that the new data slice through each time frame can be calculated and returned. Each distributed Triana service returns it' s processed data in order and the frames are animated. A Triana visualization unit (ImageView) then displays the resultant animation as a sequence of GIF files. The result is that the user can visualize the galaxy formation in a fraction of the time it would if the simulation was performed in a single machine. Opposite, a snapshot showing one time step of the projected data set is shown.
4. Triana Distributed Implementation and the Role of The GAT 4.1. Distribution Using Triana Each Triana Controlling Service (TCS) has a corresponding Triana engine (or a 3rd party engine) that are implemented as a Triana service that are capable of executing complete or partial taskgraphs. Triana engines can choose to execute the task-graph locally distribute it to other Triana servers according to the desired distribution policy and can communicate with each other to offer pipelined work-flow distributions. The Triana distributed implementation is based around Triana Group units, that is, aggregate tools containing a number of interconnected units. They have the same properties as normal tools e.g. they have input/output nodes, properties etc, and therefore, they can be connected to other Triana units using the standard mechanism. Tools have to be grouped in order to be distributed and have an associated distribution policy. A distribution policy describes the particular way in which the units in this group are distributed. There are two distribution policies currently implemented in Triana: • •
Parallel: Parallel is a ‘farming out’ mechanism (see figure 3) and generally involves no communication between hosts. Pipeline. Pipeline involves distributing the group vertically i.e. each unit in the group is distributed onto a separate resource and data is passed between them in a pipelined fashion.
Groups can contain groups and each group can have its own distribution policy. This means that complex hierarchical distribution mechanism can be specified. For example, figure 3 illustrates this: Here, one Triana Service distributes its group to three other Triana services using the task farming distribution policy then each of these Triana services act as a gateway and distribute their task graph (implemented by a subgroup) to two other services using the pipeline distribution policy. Triana Service Triana Service
Triana Service
Triana Service Triana Service
Triana Service
Figure 6: Example Triana distribution: a service distributes a task-graph to three other Triana services using task-farming then each of these distributes their task graphs to another two services using a pipelined approach.
4.2. The GAT The Triana distribution mechanisms are based upon the concept of a GAT (Grid Application Toolkit). The purpose of a GAT is to shield applications from the implementation details and complexities of underlying Grid middleware through providing a standard application programmer’s interface (GAT-API) and a set of common Grid services for tasks such as resource management and information management. From Triana’s perspective a GAT should provide simple API calls for discovering and communicating with Triana services running on remote machines, and these calls should be independent of the current GAT middleware binding, enabling Triana to be distributed on different Grid middleware without modifying the core Triana code. The Triana project is a partner in the E.U. funded GridLab project [8], a pan European project developing the GridLab GAT. The GridLab project is split into 14 work packages developing the GAT-API and Grid services in areas such as security, logging and data visualization. The role of Triana is as a test application and to specify and develop application requirements from the GridLab GAT. To enable the distribution of Triana in preparation for the GridLab GAT, a prototype GAT API called the GAP Interface (Grid Application Prototype Interface) was created. The GAP interface provides a simple set of calls required for locating and communicating with remote services, a subset of the functionality expected in the GridLab GAT. There are currently GAP Interface bindings for JXTA and also for a lightweight socket based peer-to-peer implementation (P2PS). For the galaxy formation demo we chose to use JXTA binding as the distribution mechanism. The JXTA GAP binding implements the basic GAT functionality for locating and communicating with JXTA services. A JXTAServe service has one or more input nodes (one is needed for control at least) and has zero, one or more output nodes. It advertises its input and output nodes as JXTA pipes and connects between pipes using the virtual communication channel that adapts to the particular communication protocol depending on the current operating environment. 4.3. Using Triana to Task Farm Once the particular data flow has been created, sections of this data flow can be distributed to running Triana servers using any of the distribution policies described in section 4.1. For our galaxy formation example, we used the Parallel distribution policy to task farm the data sets across all available nodes in order to speed up the recalculation of the visualization of data set. To achieve this, first we selected the section of the task-graph that we wanted to distribute. As shown in Figure 5, we distributed the SequenceBuffer unit (a node buffering mechanism) and the ViewPointProjection unit that performs the recalculation of the data set for the new viewing angle. We then made a Group Unit out of the selected units and called this ViewPoint. Right clicking on the group then brings up a menu where you can select the enabling of the distribution for a group unit. Once this is selected, the window to the right appears prompting you to enter the distribution policy you wish to select for this group. We selected HTCParallel: the High Throughput computing Parallel distribution implementation within Triana. Triana dynamically
discovers distribution policies and new policies can be added easily by creating new Control units that specify the specific policy. We expect to implement more as we apply Triana to new problem domains. We then click OK and the Window to the left is displayed, which shows all available services (in this example we just ran one on a laptop for demonstration purposes) along with a number of options. Users can select Auto Distribution allowing Triana to automatically utilize the available services itself or Custom Distribution to apply a custom distribution on a specific subset of the servers listed. A Sequence Policy must then be selected. This specifies how Triana will reassemble the packets when they return to the client. For example, in our galaxy formation example, it is imperative that the GIF files for the animation are returned in the same order than they were distributed although in practice this will almost certainly not be the case. Specifying Sequence by Sequence Number ensures that the packets are output in the same order that they were received by buffering results that appear out of sequence. Alternatively, one can choose not to sequence the packets.
5. Open Source Triana Release On May 30th 2003 Triana was released as an open source software package. This version includes the code described in this paper, both for the galaxy formation visualization and for the distributed Triana prototype. At the time of writing Triana includes two GAT bindings, one is implemented in JXTA and the other is a lightweight native Java socket based on P2P mechanism (P2PS). The user is prompted at start up to choose how to run Triana i.e. stand alone, as a JXTA peer or a P2PS peer.
6. Conclusion In this paper, we presented an overview of how application scientists would use the Triana software environment to componentize their application and how they might use the Triana distribution mechanisms to distribute this onto the Grid. Further, since Triana uses the GAT interface to insulate it from the underlying middleware, the application developer does not have to commit to any underlying middleware when they are developing the Grid version of their application. At the time of writing, Triana is just about to be released as an open source project and we currently have a number of varied application groups that we are working with to use Triana for their Grid solutions. This integration will feed back directly into the Triana source tree for future releases (currently, we have around 500 tools implemented) and therefore enable wider applicability into new areas of research.
References 1. The Physiology of the Grid: An Open Grid Services Architecture for Distributed Systems Integration. I. Foster, C. Kesselman, J. Nick, S. Tuecke, Open Grid Service Infrastructure WG, Global Grid Forum, June 22, 2002. 2. IBM and Globus Announce Open Grid Services for Commercial Computing, http://www.ibm.com/news/be/en/2002/02/211.html 3. The Globus Project: http://www.globus.org/ 4. Gnutella : http://gnutella.wego.com/ 5. SETI@Home : http://setiathome.ssl.berkeley.edu/ 6. JXTA: http://www.jxta.org/ 7. In The Grid: Blueprint for a New Computing Infrastructure, I. Foster and C Kesselman, in Computational grids, Eds. Morgan Kaufmann Publishers, July 1998, ch. 2. 8. GridLab : http://www.gridlab.org 9. GridOneD project home page and the Triana Software Environment web site: http://www.gridoned.org/ and http://www.trianacode.org/ 10. SGT Toolkit: http://www.epic.noaa.gov/java/sgt/index.html 11. XMGrace: http://plasma-gate.weizmann.ac.il/Grace/ 12. Distributed P2P Computing within Triana: A Galaxy Visualization Test Case, Dr Ian Taylor, Matthew Shields, Dr Ian Wang, Dr Roger Philp, in proceedings IPDPS 2003, 22-26 April 2003, IEEE CD-ROM