reaching into a new domain of astronomy: systematic searching of the sky for .... can express that remote data may not be available after a certain time (expires). .... Thus we could restate one of the names from the Strasbourg Ontology in a ...
Grids and the Virtual Observatory Roy Williams Center for Advanced Computing Research California Institute of Technology, USA Abstract We consider several projects from astronomy that benefit from the Grid paradigm and associated technology, many of which involve either massive datasets or the federation of multiple datasets. We cover image computation (mosaicking, multi-wavelength images, and synoptic surveys); database computation (representation through XML, data mining, and visualization); and semantic interoperability (publishing, ontologies, directories, and service descriptions).
1. The Virtual Observatory Astronomers have always been early adopters of technology, and information technology has been no exception. There is a vast amount of astronomical data available on the Internet, ranging from spectacular processed images of planets to huge amounts of raw, processed and private data. Much of the data is well documented with citation, instrumental settings, and what processing has been applied. In general, astronomical data has few copyright, privacy or other intellectual property restrictions by comparison with other fields of science, although fresh data is generally sequestered for a year or so while the observers have a chance to reap knowledge from it. As anyone with a digital camera can attest, there is a vast requirement for storage. Breakthroughs in telescope, detector, and computer technology allow astronomical surveys to produce terabytes of images and catalogs. These datasets will cover the sky in different wavebands, from gamma - and X-rays, optical, infrared, through to radio. With the advent of inexpensive storage technologies and the availability of high-speed networks, the concept of multi-terabyte online databases interoperating seamlessly is no longer outlandish [1] [2] More and more catalogs will be interlinked, query engines will become more and more sophisticated, and the research results from on-line data will be just as rich as that from “real” observatories. In addition to the quantity of data increasing exponentially, its Figure 1: The total area of astronomical heterogeneity -- the number of data publishers -- is also rapidly telescopes in m2 , and CCDs measured in increasing. It is becoming easier and easier to put data on the web, and Gigapixels, over the last 25 years. The number of every scientist builds the service and the table attributes and the pixels and the data double every year. keywords in a slightly different way. Standardizing this diversity without destroying it is as challenging as it is critical. It is also critical that the community recognize the value of these standards, and agree to spend time on implementing them. Recognizing these trends and opportunities, the National Academy of Sciences Astronomy and Astrophysics Survey Committee, in its decadal survey [3] recommends, as a first priority, the establishment of a National Virtual Observatory, leading to US funding through NSF. Similar programs have begun in Europe and Britain, as well as other national efforts, now unified by the International Virtual Observatory Alliance (IVOA). The VO will be a “Rosetta Stone”: linking the archival data sets of space- and ground-based observatories, the catalogs of multiwavelength surveys, and the computational resources necessary to support comparison and cross-correlation among these resources. While this project is mostly about the US effort, the emerging International VO will benefit the entire astronomical community, from students and amateurs to professionals. We hope and expect that the fusion of multiple data sources will also herald a sociological fusion. Astronomers have traditionally specialized by wavelength, based on the instrument with which they observe, rather than by the physical processes actually occurring in the Universe: having data in other wavelengths available by the same tools, through the same kinds of services will soften these artificial barriers. 1
1.1. Data Federation Science, like any deductive endeavor, often progresses through federation of information: bringing information from different sources into the same frame of reference. The police detective investigating a crime might see a set of suspects with the motive to commit the crime, another group with the opportunity, and another group with the means. By federating this information, the detective realizes there is only one suspect in all three groups -- this federation of information has produced knowledge. In astronomy, there is great interest in objects between large planet and small star -- the so-called brown dwarf stars. These very cool stars can be found because they are visible in the infrared range of wavelengths, but not at optical wavelengths. A search can be done by federating an infrared and an optical catalog, asking for sources in the former, but not in the latter. The objective of the Virtual Observatory is to enable the federation of much of the digital astronomical data. A major component of the program is about efficient processing of large amounts of data, and we shall discuss projects that need Grid computing, first those projects that use images and then projects that use databases. Another big part of the Virtual Observatory concerns standardization and translation of data resources that have been built by many different people in many different ways. Part of the work is to build enough metadata structure so that data and computing resources can be automatically connected in a scientifically valid fashion. The major challenge with this approach, as with any standards effort, is to encourage adoption of the standard in the community. We can then hope that those in control of data resources can find it within them to expose it to close scrutiny, including all its errors and inconsistencies.
2. What is a Grid? People often talk about The Grid, as if there is only one, but in fact Grid is a concept. In this paper, we shall think of a Grid in terms of the following criteria: •
Powerful Resources: There are many websites where clients can ask for computing to be done or for customized data to be fetched, but a true Grid offers sufficiently powerful resources that their owner does not want arbitrary access from the public Internet. Supercomputer centers will become delocalized, just as digital libraries are already.
•
Federated Computing: The Grid concept carries the idea of geographical distribution of computing and data resources. Perhaps a more important kind of distribution is human: that the resources in the Grid are managed and owned by different organizations, and have agreed to federate themselves for mutual benefit. Indeed, the challenge resembles the famous example of the federation of states which is the USA.
•
Security structure: The essential ingredient that glues a Grid together is security. A federation of powerful resources requires a superstructure of control and trust to limit uncontrolled, public use, but to put no barriers in the way of the valid users.
In the Virtual Observatory context, the most important Grid resources are data collections rather than processing engines. The Grid allows federation of collections without worry about differences in storage systems, security environments, or access mechanisms. There may be directory services to find datasets more effectively than the Internet search engines that work best on free text. There may be replication services that find the nearest copy of a given dataset. Processing and computing resources can be used through allocation services based on the batch queue model, on scheduling multiple resources for a given time, or on finding otherwise idle resources.
2.1. Virtual Observatory Middleware The architecture is based on the idea of services: internet-accessible information resources with well-defined requests and consequent responses. There are already a large number of astronomical information services, but in general each is hand-made, with arbitrary request and response formats, and little formal directory structure. Most current services are designed with the idea that a human, not a computer, is the client, so that output comes back as HTML or an idiosyncratic text format. Furthermore, services are not designed with scaling in mind to gigabyte or terabyte result sets, with a consequent lack of authentication mechanisms that are necessary when resources become significant.
2
To solve the scalability problem, we are borrowing heavily from progress by information technologists in the Grid world, using GSI authentication[4] , Storage Resource Broker[5] , and GridFTP[6] for moving large datasets. In sections 3 and 4, we discuss some of the applications in astronomy of this kind of powerful distributed computing framework, first for image computing, then for database computing. In section 5, we discuss approaches to the semantic challenge in linking heterogeneous resources.
3. Image Computing Imaging is a deep part of astronomy, from pencil sketches, through photographic plates, to the 16 gigapixel camera recently installed on the Hubble Telescope. In this section, we consider three applications of Grid technology to federating and understanding image data.
3.1. Virtual Sky: Multi-wavelength Imaging The Virtual Sky project[7] provides seamless, federated images of the night sky; not just an album of popular places, but the entire sky at multiple resolutions and multiple wavelengths. Virtual Sky has ingested the complete DPOSS survey (Digital Palomar Observatory Sky Survey[8] ), with an easy-to-use, intuitive interface that anyone can use. Users can zoom out so the entire sky is on the screen, or zoom in, to a maximum resolution of 1.4 arcseconds per pixel, a magnification of 2000. Another theme is the Hubble Deep Field [9] , a further magnification factor of 32.
Figure 2: Two views from the Virtual Sky image federation portal. On the left is the view of the galaxy M51 seen with the DPOSS optical survey from Palomar. Overset is an image from the Hubble space telescope. At the right is the galactic center of M51 at eight times the spatial resolution. The panel at the left allows zooming and panning, as well as changing theme. There is also a gallery of interesting places, and a blog (bulletin board) where users can record comments. Virtual Sky is a collaboration between the Caltech Center for Advanced Computing Research, Johns Hopkins University, the Sloan Sky Survey[10] , and Microsoft Research. The image storage and display is based on the popular Terraserver[11] . Virtual Sky federates many different image sources into a unified interface. Like most federation of heterogeneous data sources, there is a loss of information -- in this case because of resampling the original images -- but we hope that the federation itself will provide a new insight to make up for the loss. The architecture is based on a hierarchy of pre-computed image tiles, so that response is fast. Multiple "themes" are possible, each one being a different representation of the night sky. Some of the themes are: •
Digital Palomar Observatory Sky Survey
•
Sloan Digital Sky Survey 3
•
A multi-scale star map from John Walker, based on the Yoursky server;
•
The Hubble Deep Field.
•
The "Uranometria", a set of etchings from 1603 that was the first true star atlas;
•
The ROSAT All Sky Survey in soft and hard X-rays;
•
The NRAO VLA Sky Survey at radio wavelengths (1.4 GHz);
•
The 100 micron Dust Map from Finkbeiner et. al.
•
The NOAO Deep Wide Field survey.
All the themes are resampled to the same standard projection, so that the same part of the sky can be seen in its different representations, yet perfectly aligned. The Virtual Sky is connected to other astronomical data services, such as NASA's extragalactic catalog, NED[12] and the Simbad star catalog at CDS Strasbourg[13] . These can be invoked simply by clicking on a star or galaxy, and a new browser window shows the deep detail and citations available from those sources. Besides the education and outreach possibilities of this “hyper-atlas” of the sky, another purpose is as an index to image surveys, so that a user can directly obtain the pixels of the original survey from a Virtual Sky page. A cutout service can be installed over the original data, so that Virtual Sky is used as a visual index to the survey, from which fully calibrated and verified FITS files can be obtained. Virtual Sky Implementation When a telescope makes an image, or when a map of the sky is drawn, the celestial sphere is projected to the flat picture plane, and there are many possible mappings to achieve this. Images from different surveys may also be rotated or stretched with respect to each other. The Virtual Sky federates images by computationally stretching each one to a standard projection. Because all the images are on the same pixel grid, they can be used for searches in multi-wavelength space (see next section for scientific motivation). For the purposes of a responsive web-site, however, the images are reduced in dynamic range and JPEG compressed before being loaded into a database. The sky is represented as 20 pages (like a star atlas), which has the advantage of providing large, flat pages that can easily be zoomed and panned. The disadvantage, of course, is distortion far from the center. Thus the chief computational demand of Virtual Sky is resampling the raw images. For each pixel of the image, several projections from pixel to sky are required, and the same number of inverse projections. There is a large amount of I/O, with random access either on the input or output side. Once the resampled images are made at the highest resolution, a hierarchy is built, halving the resolution at each stage. There is a large amount of data associated with a sky survey: the DPOSS survey is 3 Terabytes, the 2MASS (Two Micron All Sky Survey [14] ) raw imagery is Input plane Input plane 10 Terabytes. The images were taken at different times, and may overlap. The resampled images built for Virtual Sky form a continuous mosaic, with little overlap, they may be fraction of these sizes, with the compressed tiles even smaller. The bulk of the backend processing has been done on an HP Superdome machine, and the code is now being ported to Teragrid [15] Linux clusters. The web site is run on a dual-Pentium Dell Poweredge, at 750 MHz, with 250 Gbyte of disks controlled by Microsoft SQL Server. Output plane
Parallel Computing The image stretching (resampling) that is the computational backbone of Virtual Sky implies a mapping between the position of a point in the input image and the position of
Output plane
Figure 3: Parallelizing the process of image resampling. Left: the input plane is split among the processors, and data drops arbitrarily on the output plane. Right, the output plane is split among processors, and the arbitrary access is on the input plane. 4
that point in the output. The resampling can be done in two ways: •
Order by Input: Each pixel of the input is projected to the output plane, and its flux distributed there. This method has the advantage that each input pixel can be spread over the output such that total flux is preserved; therefore the brightness of a star can be accurately measured from the resampled dataset
•
Order by Output: For each pixel of the output image, its position on the input plane is determined by inverting the mapping, and the color computed by sampling the input image. This method has the advantage of minimizing loss of spatial resolution. Virtual Sky uses this method.
If we order the computation by the input pixels, there will be random write access into the output dataset, and if we order by the output pixels, there will be random read access into the input images. This direction of projection also determines how the problem parallelizes. If we split the input files among the processors, then each processor opens one file at a time for reading, but must open and close output files arbitarily, possibly leading to contention. If we split the data on the output, then processors are arbitrarily opening files from the input plane depending on where the output pixel is.
3.2. MONTAGE: On-demand Mosaics Virtual Sky has been designed primarily as a delivery system for precomputed images in a fixed projection, with a resampling method that emphasizes spatial accuracy over flux conservation. The background model is a quadratic polynomial, with a contrast mapping that brings out fine detail, even though that mapping may be nonlinear. The NASA-funded MONTA GE project [16] builds on this progress with a comprehensive mosaicking system that allows broad choice in the resampling and photometric algorithms, and is intended to be operated on a Grid architecture such as Teragrid. MONTAGE will operate as an on-demand system for small requests, up to a massive, wide-area data-computing system for large jobs. The services will offer simultaneous, parallel processing of multiple images to enable fast, deep, robust source detection in multi-wavelength image space. These services have been identified as cornerstones of the National Virtual Observatory. We intend to work with both massive and diverse image archives: the 10 Tbyte 2MASS (infrared []), the 3 Tbyte DPOSS (optical[]), and the much larger SDSS[] optical survey as it becomes available. There are many other surveys of interest. MONTAGE is a joint project of the NASA Infrared Processing and Analysis Center (IPAC), the NASA Jet Propulsion Laboratory (JPL), and Caltech’s Center for Advanced Computing Research (CACR).
3.3. Science with Federated Images Modern sky surveys, such as 2MASS and Sloan provide small images (~1000 pixels on a side), so that it is difficult to study of large objects and diffuse areas, for example the Galactic Center. Another reason for mosaicking is to bring several image products from different instruments to the same projection, and thereby federate the data. This makes possible such studies as: •
Stacking: Extending source detection methods to detect objects an order of magnitude fainter than currently possible. A group of faint pixels may register in a single wavelength at the two-sigma level (meaning there may be something there, but it may also be noise). However, if the same pixels are at two -sigma in other surveys, then the overall significance may be boosted to five sigma – indicating an almost certainty of the existence of signal rather than just noise. We can go fainter in image space because we have more photons from the combined images and because the multiple detections can be used to enhance the reliability of sources at a given threshold.
•
Spectrophotometry : characterizing the spectral energy distribution of the source through "bandmerge" detections from the different wavelengths.
•
Extended Sources: Robust detection and flux measurement of complex, extended sources over a range of size scales. Larger objects in the sky (eg. M31, M51) may have both extended structure (requiring image mosaicking) and a much smaller active center, or diffuse structure entirely. Finding the relationship between these attributes remains a scientific challenge. It will be possible to combine multiple instrument imagery to build a multi-scale, multi-wavelength picture of such extended objects. It is also interesting to make statistical studies of less spectacular, but extended, complex sources that vary in shape with wavelength. 5
•
Image Differencing: Differences between images taken with different filters can be used to detect certain types of sources. For example, planetary nebulae (PNe) emit strongly in the narrow Hα band. By subtracting out a much wider band that includes this wavelength, the broad emitters are less visible and the PNe is highlighted.
•
Time Federation: A trend in astronomy is the synoptic survey, where the sky is imaged repeatedly to look for time-varying objects. MONTAGE will be well-placed for mining the massive data from such surveys. For more detrails see the next section on the Quest project.
•
Essentially Multi-wavelength Objects. Multi-wavelength images can be used to specifically look for objects that are not obvious in one wavelength alone. Quasars were discovered in this way by federating optical and radio data. There can be sophisticated, self-training, pattern recognition sweeps through the entire image data set. An example is a distant quasar so well aligned with a foreground galaxy to be perfectly gravitationally lensed, but where the galaxy and the lens are only detectable in images at different wavelengths.
3.4. MONTAGE Architecture The architecture will be based on the Grid paradigm, where data is fetched from the most convenient place, and computing is done at any available platform, with single sign-on authentication to make the process practical. We will also rely on the concept of ‘virtual data’, the idea that data requests can be satisfied transparently whether the data is available on some storage system or whether is needs to be computed in some way. With these architectural drivers, we will be able to provide customized, high-quality data, with great efficiency, to a wide spectrum of usage patterns. At one end of the usage spectrum is the scientist developing a detailed, quantitative data pipeline to squeeze all possible statistical significance from the federation of multiple image archives, while maintaining parentage, rights, calibration, and error information. Everything is custom: the background estimation -- with its own fitting function and masking, as well as cross-image correlation; custom projection from sky to pixel grid, the details of the resampling and flux preservation is custom, and so on. In this case, the scientist would have enough authorization User
Request Creation
Survey Metadata Services
request for Image projection does it exist? Request Management
no: compute
DAG cache & replicate Planner & Scheduler execute
Project Project Images Project Images Project Images Images
Image Metadata yes: fetch from replicas Replica Catalog
Figure 4: MONTAGE Architecture. After a user request has been created and sent to the Request Manager, part of the request may be satisfied from existing (cached) data. The Image Metadata (IM) system looks for a suitable file, and if found, gets it from the distributed Replica Catalog (RC). If not found, a suitable computational graph (DAG) is assembled and sent to be executed on Grid resources. Resulting products may be registered with the IM and stored in RC. The user is notified that the requested data is available until a specified expiry time.
select
Replicas of Replicas of Projected Replicas of Projected Images Projected Images Images
that powerful computational resources can be brought to bear, each processor finding the nearest replica of its input data requirements, and the output being hierarchically collected to a final composite. Such a product will require 6
deep resources from the Teragrid[15] , and the result will be published in a peer-reviewed journal as a scientifically authenticated, multi-wavelength representation of the sky. Other users will have less stringent requirements for the way in which image mosaics are generated. They will build on a derived data product such as described above, perhaps using the same background model, but with the resampling different, or perhaps just using the derived product directly. When providing users with the desired data, we want to be able to take advantage of the existing data products and produce only the necessary missing pieces. It is also possible, that it may take longer to access the existing data rather than performing the processing. These situations need to be analyzed in our system and appropriate decisions need to be made. Replica Management Management of replicas in a data pipeline means that intermediate products are cached for reuse: for example in a pipeline of filters ABC, if the nature of the C filter is changed, then we need not recompute AB, but can use a cached result. Replica management can be smarter than a simple file cache: if we already have a mosaic of a certain part of the sky, then we can generate all subsets easily by selection. Simple transformations (like selection) can extend the power and reach of the replica software. If the desired result comes from a series of transformations, it may be possible to change the order of the transformations, and thereby make better use of existing replicas. Virtual Data Further gains in efficiency are possible by leveraging the concept of ‘virtual data’ from the GriPhyN project[17] . The user specifies the desired data using domain specific attributes and not by specifying how to derive the data, and the system can determine how to efficiently build the desired result. Replica management is one strategy, choosing the appropriate computational platforms and input data locations is another. The interface between an application programmer and the Virtual Data management systems (VDMS) now being deployed, is the definition of what is to be computed, which is called a Virtual Data Request (VDR). The VDR specifies what data is to be fetched -- but not the physical location of the data, since there may be several copies and the VDMS should have the liberty to choose which copy to use. Similarly the VDR specifies the set of objects to compute, but not the locations of where the computations will take place.
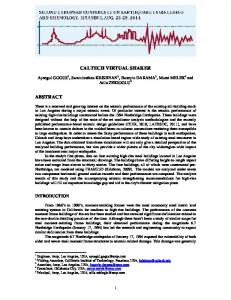
3.5. Quest: Multi-temporal Imaging A powerful digital camera is installed on the 48” Ochsin telescope of the Palomar observatory in California, and time is shared between the Quest [18] and the NEAT (Near Earth Asteroid Tracking [19] ) projects. Each of these is reaching into a new domain of astronomy: systematic searching of the sky for transients and variability. Images of the same part of the sky are taken repeatedly, and computationally compared to pick out transient changes. A serendipitous example is shown in the image below, where a transient of unknown origin was caught in the process of making a sky survey. The NEAT project is searching for asteroids that may impact the Earth, while Quest is directed to detect more distant events, for example: •
Transient Gravitational Lensing: As an object in our Galaxy passes between us and a distant star, it will focus and amplify the light of the background star over a period of days. Several events of this type have been observed by the MACHO project in the 1990’s. These objects are thought to be brown dwarfs (stars not massive enough to ignite), or white dwarfs (stars already ignited and burned out). This will lead to a better understanding of the nature of the non-luminous mass of the Galaxy.
•
Quasar Gravitational Lensing: At much larger scales than our Galaxy, the Quest team hopes to detect strong lensing of very remote objects such as quasars.
•
Supernovae: The Quest system will be able to detect large numbers of very distant supernovae, leading to prompt follow-up observations, and a better understanding of supernova classification, as well as their role as standard candles for understanding the early Universe.
•
Gamma -Ray Burst (GRB) afterglows: GRBs represent the most energetic processes in the Universe, and their nature is not clear. The gamma -ray burst lasts for seconds, and may be detected by an orbiting observatory, but the optical afterglow may last much longer. Quest will search for these fading sources, and try to correlate them with known GRBs. 7
Figure 5: These images from the DPOSS survey were taken at different times, s indicated, and in three different color filters (J, F, N). The image at the bottom left, taken in 1990, is much brighter than the 1988 or 1991 images. The reason for this brightening is not known.
Data Challenges from Quest The Quest camera produces about 2 Mbyte per second, which is stored on DLT tapes at the observatory. A night of observing can can produce about 50 Gbyte of data, corresponding to 500 square degrees of sky in four filters. The tapes are streamed by microwave link from Palomar Mountain to SDSC. Depending on whether the data is from NEAT or Quest, it may be sent to Berkeley(LBNL) and JPL, or to Caltech and Yale. The objective of the Caltech team is prompt comparison processing with the previous coverage of that sky, and also with an average view of that sky. The comparison may be done directly with images, stretching the images to fit precisely over each other, correcting the sky background, then comparing new and old pixel values directly. Another way to do the comparison is through a database. Stars and galaxies are extracted from the images with sourcefinding software, and the resulting star catalog stored in the database. Then entries from different times can be compared with a fuzzy join, followed by picking out sources where the brightness has changed. The QUEST team will be making use of Grid-computing and database technology to extract the astronomical knowledge from the data stream.
Caltech
Tonight is: NEAT
Yale
ü QUEST Palomar 48” 50 Gbyte per clear night
QUEST data
LBNL
Microwave link SDSC
NEAT data
8
JPL
Figure 6: The telescope is switched between the Quest and NEAT projects. If it is Quest, the 50 Gbyte result is transmitted by microwave to San Diego Supercomputer Center (SDSC), then by land line to Caltech and to Yale.
3.6. A Galaxy Morphology Study The classic Hubble classification relied on a few bright, nearby galaxies. It looks like a fork, with spiral galaxies, possibly barred, on the branches, and ellipticals on the “handle” of the fork, plus a class of so-called “irregulars”. But as our vision moves further out, and further back in time, there are more and more irregulars and the Hubble classification is no longer valid. A significant problem is that light is red-shifted with distance, so that optical output (in the rest frame of the galaxy) is shifted to infrared light as received on Earth. Since we want to compare images in the rest frame of the galaxies, it is necessary to federate infrared and optical imagery and then draw conclusions from differences between the younger (further, infrared) population and the older (nearer, optical) population. It is always difficult to compare results from different instruments, made by different groups of people. Several investigators have attempted automatic classification[20] , by computing numbers from galaxy images that measure morphology (shape), then using data-mining methods such as neural nets and unsupervised clustering to build a classification. These morphology coefficients include, for example the concentration of light at the center, an asymmetry index, or the radial Fourier modes of the light distribution. The objective of this study, one of the Key Science projects of the National Virtual Observatory, is to correlate galaxy morphology and x-ray surface brightness in clusters of galaxies. In particular, we will look for disturbed morphologies indicative of mergers or tidal perturbations. From a catalog of clusters of galaxies, we select clusters, then use a catalog of galaxies to identify galaxies that are probably members of that cluster, and find both optical and Xray images of each galaxy. A morphology program analyzes the pixels of each galaxy image, extracting morphology parameters. We run the morphology program on the optical images, and create a new galaxy catalog that combines cluster membership, Xray flux, and morphological parameters. The major initial problem is the federation of these databases and image libraries, building the data pipeline to read in these catalogs, correlate positions, contrast adjustment of images, a model of error propagation, and so on. Eventually, the pipeline will utilize powerful computing facilities for the image analysis. When it is time to prove a scientific hypothesis, there may be a comparison of the observed features of the galaxies to “null hypothesis” models, meaning a lot of computing of the statistical features of synthetic galaxies.
4. Database Computing Scientific data analysis is often called data mining because of its similarity to mining for precious metals or diamonds. The initial stages work coarsely with large quantities, and in the final stages we carefully separate small quantities of dross from small quantities of product. Often the initial stages of scientific data mining consist of pattern-matching of some kind: searching for signals in the data. In astronomy, the raw data is often images, and the patterns are the stars and galaxies. There may be dozens of attributes for each such source: magnitudes in several wavebands, some shape and morphology parameters such as those discussed above, error estimates, classification into different types of source, and so on. Such catalogs of sources are generally stored in a relational database management system (RDBMS), where they are available for studies in statistical astronomy. However, the source catalog may involve a large amount of data just by itself. When complete, the Sloan Digital Sky Survey will have about 15 Terabytes of image data, and this is reduced to about two terabytes in the RDBMS. With datasets of this size, the Grid community must pay serious attention to bulk database records as they do for large file-based data. In this section, we consider some projects that involve large quantities of catalog (RDBMS) data. Often we hear the advice that the computing should be close to the data --which maximizes computing efficiency. However, in these days of cheap computers and fat data pipes, the efficiency may come by keeping code close to its developer: to minimize the amount of time spent re-installing code from one machine to another, minimizing the maintenance of a rapidly developing code base on multiple platforms. Just as in the business world, we are moving from the old model of software installation on the desktop to a net-based model of services on demand. Scientifically, this architecture could delivering a significant part of the promise of the NVO: data from the big sky surveys (SDSS, 2MASS, DPOSS, etc) can be crossmatched and cached, run through statistical engines to build clusters and find outliers, and piped to visualization with flexible, innovative software on high-performance or
9
desktop platforms. Outliers can be piped back to the original databases for further information, perhaps image cutouts. Much of what is needed is already in place -- the collaboration of astronomers and statisticians, the commitment to standards that is the NVO, the recognition that big data is a gold mine and not a pile of dusty tapes. The format for transmitting these database records could be the VOTable standard, developed internationally under the VO umbrella, enabling separation of metadata from data, and high-performance binary transfer. One component that is missing is the "driver" programs that effect the transfer, mediating between the applications and the grid. Such a program implements the GSI (Globus) security model[4] , and it can also package many database records into big files for transport over the grid. Even though large files are being moved, perhaps asynchronously, each end of the pipe sees a continuous stream of records.
4.1. The VOTable XML Proposal The VOTable format[21] is a proposed XML standard for representing a table. In this context, a table is an unordered set of rows, each of a uniform format, as specified in the table metadata. Each row is a sequence of table cells, and each of these is either primitive data types, or an array of such primitives. The format is derived from the FITS Binary Table format[22] The VOTable standard represents an initial sucess of the International VO community, with the initial effort spearheaded by F. Ochsenbein of Strasbourg and this author, joined by many colleagues from many counties, and sharpened and extended by an intensive online discussion group. Astronomers have always been at the forefront of developments in information technology, and funding agencies across the world have recognized this by supporting the Virtual Observatory movement, in the hopes that other sciences and business can follow their lead in making online data both interoperable and scalable. VOTable is designed as a flexible storage and exchange format for tabular data, with particular emphasis on astronomical tables. Interoperability is encouraged through the use of standards (XML); There are many compelling arguments for this which will not be repeated here. However, another standard propagated by VOTable is about semantic labelling of data objects: physical quantities are tagged not only with units, but also through a common descriptive ontology that expresses the nature of the quantity (eg. Gunn J magnitude, declination). For more on semantic interoperability, see Section 5. VOTable has built-in features for big-data and Grid computing. It allows metadata and data to be stored separately, with the remote data linked according to the Xlink model. Processes can then use metadata to 'get ready' for their full-sized input data, or to organize third-party or parallel transfers of the data. Remote data allow the metadata to be sent in email and referenced in documents without pulling the whole dataset with it: just as we are used to the idea of sending a pointer to a document (URL) in place of the document, so we can now send metadata-rich pointers to data tables in place of the data itself. The remote data is referenced with the URL syntax protocol://location, meaning that arbitrarily complex protocols are allowed. When we are working with very large tables in a distributed-computing environment (``the Grid"), the data streams between processors, with flows being filtered, joined, and cached in different geographic locations. It would be very difficult if the number of rows of the table were required in the header - we would need to stream in the whole table into a cache, compute the number of rows, then stream it again for the computation. In the Grid-data environment, the component in short supply is not the computers, but rather these very large caches! Furthermore, these remote data streams may be created dynamically by another process or cached in temporary storage: for this reason VOTable can express that remote data may not be available after a certain time (expires). Data on the net may require authentication for access, so VOTable allows expression of password or other identity information (the 'rights' attribute). Data Storage: Flexible and Efficient The data part in a VOTable may be represented using one of three different formats: •
TABLEDATA is a pure XML format so that small tables can be easily handled in their entirety by XML tools.
•
The FITS binary table format is well-known to astronomers, and VOTable can be used either to encapsulate such a file, or to re-encode the metadata; unfortunately it is difficult to stream FITS, since the dataset size is
10
required in the header (NAXIS2 keyword), and FITS requires a specification up front of the maximum size of its variable -length arrays. •
The BINARY format is supported for efficiency and ease of programming: no FITS library is required, and the streaming paradigm is supported.
We expect that VOTable can be used in different ways, as a data storage and transport format, and also as a way to store metadata alone (table structure only). In the latter case, we can imagine a VOTable structure being sent to a server, which can then open a high-bandwidth connection to receive the actual data, using the previously-digested structure as a way to interpret the stream of bytes from the data socket. VOTable can be used for small numbers of small records (pure XML tables), or for large numbers of simple records (streaming data), or it can be used for small numbers of larger objects. In the latter case, there will be software to spread large data blocks among multiple processors on the Grid. Currently the most complex structure that can be in a VOTable Cell is a multidimensional array. Future In future versions of the VOTable format, we expect to benefit from both experience and tool-building. Such tools include presentation and transformations of the metadata (and data too, when it is in XML), using XML transformation language and software: XSL and XSLT. We would like to migrate to the more powerful document validation provided by XSchema rather than the current DTD. We also expect XSchema to allow better modularization of the document schema, so that, for example, users might put whatever serialized objects they wish into the table cells. In this way, we expect to use VOTable for handling the flow of large data objects through Grid resources, objects such as FITS files or XDF [23] documents. Also, it would also mean, for example, that an XML definition of non-standard astronomical coordinate systems could be seamlessly integrated. We expect to add features for efficiency in the future also: to specify that the data stream has a particular sort order, to specify that a column in one table is a key in to another table; to specify that one table is an index into another. The binary format will be extended to facilitate large-scale streaming.
4.2. Database Mining and Visualization Databases accept queries, and produce a set of records as output. In the Grid era, we naturally think of combining data and applications in a distributed graph of modules and pipes. Moving along the pipes is a stream of database records. Objects that will be passed between modules are relational tables, meaning a combination of real-valued r ecords and metadata. Specifically, we intend to exchange a Table object, which defined as a combination of a metadata record and a collection of data records. The metadata defines the nature of the columns of the table, where each column is defined by a short-name, with optional elements such as units, column type, min/max values, and description. The paradigm is quite similar to the discussion of VOTable above. Modules acting on the data stream can do such tasks as: •
Database modules advertise their tables and data dictionaries, and allow a user to put in a query. The single output pipe contains the results of this query.
•
Storage modules for reading or writing tables into a file system.
•
Joining modules have two input streams, and do database join. For astronomers, a fuzzy join is also necessary, so that a star at a particular position in one catalog is correctly matched with a star from another catalog if the positions are within astrometric error.
11
•
Statistical and data-mining procedures such as unsupervised clustering, creation of a Bayes net, removal of columns that contain little information, principle component analysis, density estimation, outlier detection, and so on.
•
Visualization modules that allow a diversity of geometric renderings of this high-dimensional space, include 3D scatter plots, parallel coordinates, etc. Figure 7: An example visualization session with a Grid-based multiparameter analysis suite. The image shows a 3D scatter plot of magnitude vs. two measures of fuzziness: two populations are visible: stars and galaxies. Such a toolbox can be used to build an effective discriminator, or to find clusters or outliers.
When a Table is modified or transformed in structure, it is expected that its metadata is also transformed appropriately. For example, if the module takes in a Table with Columns Mg, Mr, and Mi, (magnitudes of a star in three wavebands) and the module output is the differences of these, it could output the metadata stream to read MgMr, Mr-Mi, and Mi-Mg. Thus there is processing not only of floating-point data, but also the attributes, elements, and properties of metadata processing.
5. A Semantic Web of Astronomical Data The National Virtual Observatory is about interoperability and federation of astronomical data resources. There are two major thrusts: Grid and Semantics. The Grid thrust is the main focus of this paper, and it is concerned with moving large amounts of data between machines, about high-performance computing, about parallelism in processing and data movement, and about security and authentication. At the Grid level, a data object has the semantics of a file, or of a storage silo, or of a database. Semantic interoperability, however, requires that a data object not be viewed as just bytes or records, but as scientific observations and all that is entailed: with physical units, data parentage, error estimates, bibliography. The aim is to document data objects and the applications that manipulate them sufficiently well that a computer can connect them. The key concept for achieving this is an ontology, which is a shared vocabulary. Astronomy already has several ontologies. The Library of Congress classification, for example, lists QB6 as star catalogs, and QB349-QB480 as “Theoretical astronomy and astrophysics”, or the American Physical Society PACS system lists 98.20.-d as “Stellar clusters and associations”. These are ways of classifying books, articles, and other library materials, and were derived from analyzing a large number of such instances. The ontology for the Virtual Observatory, by contrast, is about attributes of data, not books. Suppose a table has been published that contains stars, with position in the sky and brightness. Suppose further that there is a program which can draw charts of star positions as dots on the paper, and the brightness shown by the size of the dot. 12
Right Ascension (degrees)
Declination (degrees)
Magnitude (mags)
Figure 8: A human can see that the data from the Producer can be used by the Consumer. How can the computer understand this?
Producer
189.594
23.654
12.3
84.342
8.938
11.7
204.637
45.837
13.1
Consumer
?
Right Ascension Declination
Drawing Program
result
Magnitude
Explained in English, it is clear that the table can be consumed by the program. How can we represent this knowledge formally so that the computer can also reach this conclusion? The solution is some kind of standard ontology, and the difficult part is to decide how the ontology is to be used, created, published, and extended.
5.1. The Strasbourg Ontology In the NVO, we have decided to begin our ontology work with one that was generated at the astronomical data center at Strasbourg by F. Ochsenbein and colleagues, called UCD (Unified Content Descriptor [24] ). It was created by analyzing the attributes of each of the 5,000 astronomical tables that are available at the Strasbourg center. Some examples from the UCD ontology are: •
PHOT_INT-MAG_B
Integrated total blue magnitude
•
ORBIT_ECCENTRICITY
Orbital eccentricity
•
POS_EQ_RA_MAIN
Right ascension (main)
•
INST_QE
Detector's Quantum Efficiency
In a UCD, the underscores represent hierachy, so that POS_EQ (position – Equatorial coordinates) is a subclass of POS (position). We can think of these in the same way that we think of physical units. In elementary science, students are told that they should not say “the length is 42”, but rather they should specify units: “the length is 42 inches”. In a similar fashion, physical quantities should be augmented with the metadata expressing what sort of measurement does the number represent. The VOTable format, discussed above, supports labeling of parameters and table columns with UCD information. We have defined a new class of tables that have a certain type of positional information as those whose columns exhibit specific UCDs, and several data providers have provided services which return this type of table [25] . Referring back to the figure above, a solution is to add UCD information to the table: the Right Ascension column has a UCD which is POS_EQ_RA_MAIN and the Declination column has a UCD which is POS_EQ_DEC_MAIN, and similarly for the magnitude column. The drawing application, specifies its requirement that suitable input tables must have these UCDs attached to columns. In this way, the data and the application can be made to “plug and play”. Thus we have a first step towards the idea of publishing data in a NVO-compliant fashion. Tables with positional information can be published by using VOTable, and by making sure that the coordinates are identified with labels selected from the standard ontology. We are in the process of building higher-level services with these positional tables, for crossmatching of tables (fuzzy join), for source density mapping, and others.
13
We can imaging other types of tables that are distinguished by the occurrence of certain UCDs, and applications that are able to detect these in the table metadata, and thereby process the dataset. There could be names for these different types of tables, and directories of services that list the UCD content of the results. In this way we could use the VOTable format and the Strasbourg Ontology to create an interoperable matrix of services.
5.2. I Want My Own Ontology The Strasbourg Ontology is an excellent way to describe the meaning of data that comes from the Strasbourg holdings. But it would be naive to expect a fixed collection of descriptors to be capable of representing an expanding science. Suppose a new concept or a new type of instrument appears with its own vocabulary; how can the resulting data be described within the existing infrastructure? The answer is to recognize that an ontology is another namespace, and the descriptors in the ontology are names in the namespace. A namespace is a collection of unique descriptors together with a syntax for expressing them. Consider the following sentence: •
“We took the table and chair dimensions, and wrote them in a table”.
As a human, you probably realize the different meanings of the word “table”, but it might be a lot clearer to a machine if ambiguous terms were prefixed by their namespace: •
“We took the (furniture) table and chair dimensions, and wrote them in a (word-processing) table”.
This kind of mechanism enables us to mix ontologies. In the networked world, a suitable way to ensure that namespaces are unique is to use URIs (Universal Resource Identifiers). The scheme relies on the uniqueness of internet domain names. Thus we could restate one of the names from the Strasbourg Ontology in a more general way: •
Namespace called CDS is shorthand for the URI which is http://astro.u-strasbg.fr/
•
The UCD is then combined with the namespace as CDS:PHOT_INT-MAG_B
Thus anyone can define their own ontology, and produce data objects that are described in terms of such an
Right Ascension
Declination
Magnitude
CDS:POS_EQ_RA_MAIN
CDS:POS_EQ_DEC_MAIN
CDS:PHOT_MAG
189.594
23.654
12.3
84.342
8.938
11.7
204.637
45.837
13.1
CDS⇔DRAW mapping
Producer Figure 9: An ontology mapping.
Consumer DRAW:X DRAW:Y
Drawing Program
result
DRAW:SIZE
ontology. We have intoduced flexibility and extensibility in to the semantic framework, but unfortunately we have removed most of the interoperability! If everyone creates their own ontology, then nobody can understand anyone else’s language!
14
5.3. Ontology Mapping The interoperability can be restored by mapping one ontology to another. Referring back to the figure with the data producer and data consumer, let us suppose that the data requirements for the consuming application have been written with a different ontology, let us suppose there is one called DRAW with descriptors X and Y for position and SIZE to indicate symbol size. In order to make these resources interoperate, we need a mapping between the two ontologies. Such a mapping may simply say that a name in one ontology is identical to a name in another, or it may say that one is an approximation of another, or that one name is an instance of the other. There may be a mathematical relationship -- a sky projection in this case, or the conversion for the astronomical magnitude scale to a symbol size on the paper. Representation of relationships between semantic entities is a subject of research in the computer science and digital library communities, through projects and protocols such as RDF (Resource Description Framework [26] ), or Topic Maps[27] .
6. Conclusion The approaching tsunami of data and servers in the astronomical sciences will change the way astronomers discover knowledge about the Universe. It is not just the huge quantity of data that will forge the revolution, but also the large number of data collections that were built by different people, but now must operate seamlessly. Work on the new methods is well underway in the US National Virtual Observatory, as well European, British, Canadian, Indian, and Australian VO projects. Close collaboration with the emerging standards of the Grid community will serve astronomers well in the emerging data-rich environment. The author is grateful to the US National Science Foundation for funding under the National Virtual Observatory (Cooperative Agreement No. AST-0122449).
7. References [1] Framework for the National Virtual Observatory, National Science Foundation http://us-vo.org/ [2] Proceedings of the European-United States joint workshop on Large Scientific Databases http://www.cacr.caltech.edu/euus [3] Astronomy and Astrophysics in the New Millennium (Decadal Survey), National Academy of Science, Astronomy and Astrophysics Survey Committee, http://www.nap.edu/books/0309070317/html/ [4] Grid Security Infrastructure (GSI) http://www.globus.org/security/ [5] Storage Resource Broker, San Diego Supercomputer Center http://www.sdsc.edu/DICE/SRB/ [6] The GridFTP Protocol and Software http://www.globus.org/datagrid/gridftp.html [7] Virtual Sky: Multi-resolution, Multi-wavelength astronomical images http://VirtualSky.org [8] Digital Palomar Observatory Sky Survey http://www.astro.caltech.edu/~george/dposs/ [9] The Hubble Deep Field http://www.stsci.edu/ftp/science/hdf/hdf.html [10]
The Sloan Digital Sky Survey http://www.sdss.org
[11]
Microsoft Terraserver, the original at http://terraserver.microsoft.com, and the commercial version at http://www.terraserver.com 15
[12]
NASA Extragalactic Database (NED) http://ned.ipac.caltech.edu
[13]
SIMBAD Astronomical Database http://simbad.u-strasbg.fr
[14]
Two-Micron All-Sky Survey http://www.ipac.caltech.edu/2mass
[15]
Teragrid, a supercomputing grid comprising Argonned National Laboratory, California Institute of Technology, National Center for Supercomputing Applications, and San Diego Supercomputing Center, http://www.teragrid.org
[16]
Montage, an astronomical image mosaic service for the National Virtual Observatory
[17]
GriPhyN, Grid Physics Network http://www.griphyn.org
[18]
QUEST: Synoptic astronomical imaging http://hepwww.physics.yale.edu/www_info/astro/quest.html
[19]
NEAT: Near Earth Asteroid Tracking http://neat.jpl.nasa.gov/
[20]
Abraham, R. G. & van den Bergh, S., 2001, The Morphological Evolution of Galaxies, Science, 293 (2001) 1273-1278 http://xxx.lanl.gov/abs/astro-ph/0109358
[21]
VOTable: A Proposed XML Format for Astronomical Tables, http://us-vo.org/VOTable and http://cdsweb.u-strasbg.fr/doc/VOTable/
[22]
FITS: Flexible Image Transport Specification, specifically the Binary Tables Extension http://fits.gsfc.nasa.gov/
[23]
XDF: Extensible Data format, http://xml.gsfc.nasa.gov/XDF/XDF_home.html
[24]
F. Ochsenbein et. al., Unified Content Descriptors, CDS Strasbourg, http://vizier.u-strasbg.fr/doc/UCD.htx
[25]
Simple Cone Search: A first guide for data Curators NVO publishing http://www.us-vo.org/metadata/conesearch/
[26]
Resource Description Framework, see for example T. Bray, What is RDF? http://www.xml.com/lpt/a/2001/01/24/rdf.html
[27]
Topic Maps, see for example S. Pepper, The TAO of Topic Maps http://www.ontopia.net/topicmaps/materials/tao.html
16