Chan-Soo Park, Doik Kim, Bum-Jae You, and Sang-Rok Oh. AbstractâThis paper proposes a method to measure an accurate ground height map for a ...
Ground Height Map Generation for a Humanoid Robot in an Unstructured Environment Chan-Soo Park, Doik Kim, Bum-Jae You, and Sang-Rok Oh Abstract— This paper proposes a method to measure an accurate ground height map for a humanoid robot by using a laser scanner in an unstructured environment. To measure accurate dimensions of a surface or an obstacle, a 2D laser scanner is installed on the head of a humanoid robot, called MAHRU-1. By moving the head up and down, 3D depth map around a robot is obtained from the 2D range data. After obtaining the 3D depth map around a robot, a plane segmentation method is applied to the 3D data. At first, all the horizontal and vertical planes in the 3D point map are extracted, and the outliers are removed from the plane. After segmenting the plane from the 3D data, the dimensions and the area of the planes are calculated. The accuracy of the extracted surface is evaluated with experimental results, which show the effectiveness of proposed method to extract the surfaces in the unstructured environment.
I. INTRODUCTION Although many researchers have studied the walking motion of a humanoid robot until now, the biped walking on an unstructured ground is still a difficult challenge. As far as a humanoid robot wants to walk on an unstructured ground, it is necessary to measure accurate ground height and obstacle dimensions on the unstructured ground to generate the stable walking trajectory of a humanoid robot. Including one of the authors, many researchers for a humanoid robot have tried to generate the walking motion on the structured ground, such as the staircases whose dimensions are given [7]. When accurate stair dimensions are given, it is possible to generate walking trajectories for a biped robot on the stairs. However, the stability of a robot is very sensitive to the accuracy of given stair height. In addition to the stairs, a humanoid robot should be able to walk on or avoid many obstacles, such as a door threshold or a table. Therefore, we propose a method to measure the accurate ground height map by using the laser scanner in an unstructured environment which includes the staircases, the table, the door threshold and so on. We focus on the accuracy of the obstacle dimensions to increase the stability of the biped walking on the unstructured ground. The performance of the proposed method is also evaluated in this paper. To measure dimensions of obstacles around a humanoid robot, the 3D point depth map is generated by tilting the 2D laser scanner on the head of the robot. Among the commercial laser scanner, Hokuyo UBG-04LX-F01 (UBG) is selected in this paper. The UBG laser scanner provides an accurate range with high angular resolution over long Chan-Soo Park, Doik Kim, Bum-Jae You, and Sang-Rok Oh are with Korea Institute of Science and Technology (KIST), 39-1, Hawolgok-dong, Seongbuk-Gu, Seoul, Korea.
{polar97,doikkim,ybj,sroh}@kist.re.kr
distances at the fast scan frequency. Compared with the stereo camera, the laser scanner has some advantages to measure the distance to a target. The laser scanner is less sensitive to a lighting and needs less computation load to measure the distance. Motion blurring of the stereo camera is also a critical problem when the camera or the measurement target moves. Although the laser scanner cannot read the texture or the color of the surface, laser scanner-based distance measurement is also a good selection for a humanoid robot. After generating the 3D point depth map using the laser scanner, a planar surface extraction method is applied to the 3D point depth map for extracting the surface of obstacles and the ground. By using the extracted surface, the surface area and the surface dimension of obstacles can be derived. While the laser scanner is used in this paper, almost previous research for a humanoid robot used a stereo camera to extract surface dimensions of an object. K. Okada et al. [6] proposed a method to measure the height of one stair in front of a humanoid robot. They apply the 3D hough transformation to extract surface parameters.They also found that the required measurement error of the stair height should be less than 1cm to guarantee the stability of the biped walking on one stair. However, their method cannot simultaneously detect more than three different planes and, in addition, they applied the rough probabilistic approach so that their method sometimes extracts inaccurate surface dimensions in their experiments. M. Heracles et al. [4] proposed a method to detect a surface from the unreliable 3D data for a humanoid robot. They applied the RANSAC plane fitting algorithm to remove large amount of outliers. However, RANSAC needs many iterations to remove outliers on the extracted surface. Therefore, RANSAC does not efficiently derive surface parameters when a few outliers are included in the surface data (e.g. laser scan data). Note that in case of the line extraction using the laser scan data, it is already known that the overall performance of the RANSAC algorithm is not so good [5]. J. Gutmann et al. [3] proposed a method to extract a surface of an obstacle around a humanoid robot by using the stereo camera. Their method detects lines from the 3D data, and grows surface regions by adding the nearest neighbor line until the RMS residual is more than the threshold value. However, their line extraction method is so simple and insufficient to extract lines from the unreliable data and their method cannot remove the outliers, which increase the wrong extraction of lines from the 3D range data. The range image segmentation is categorized into two cases: region-based range segmentation and edge-based
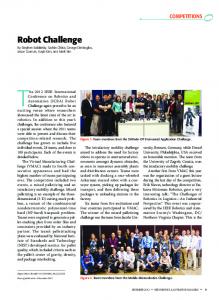
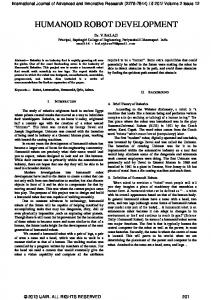
range segmentation. Between the two categories of the range segmentation, the region-based range segmentation is more useful than the edge-based range segmentation for the laser scanner-based surface extraction. The edge-based segmentation is to measure dimensions of an obstacle by extracting the edge of the obstacle. While the stereo camera is more useful to measure the distance to the edge or the texture of the object, a laser scanner is more useful to measure the distance to the surface of the object rather than the edge of the object. When a laser beam hits the most edge of an object, the measurement error of a laser scanner occurs. This phenomenon is called as mixed pixel [9]. Therefore, we proposed a surface extraction method which is based on the region-based segmentation. The proposed method can also remove the outliers such as the mixed pixels from the extracted surface to increase the surface extraction performance. This paper is organized as follows. In Section II, we presents the laser scanner installation and the 3D depth map derivation by using the laser scan data. Section III describes the proposed method and explains our approach. In Section IV, some experiments are performed to evaluate the proposed method and the results are discussed. Finally, the conclusions and the suggestions for future works are presented in Section V. II. 3D D EPTH M AP G ENERATION A. Laser Scanner Installation In this paper, the UBG laser scanner is installed on the head to measure the 3D point depth map around a humanoid robot. The UBG can measure the distances up to 5600mm within 1mm resolution and 10mm tolerance. The scan frequency and the angular resolution of the UBG is 36Hz and 0.352◦ , respectively. Detail characteristics of the UBG are provided in [8]. The coordinate axis of a robot is shown in Fig. 1. The origin O is located at the center of both feet with the x-axis going forward, the y-axis going left, and the z-axis going up. The point, Pi j =[xi j , yi j , zi j ]T , is the j-th measured point by ith scan with respect to the frame {O}, S is the point on the head where a laser scanner is installed, and H is the point on the tilting joint of the neck. There are two reasons why the laser scanner is installed on the head. Among the known characteristics of the laser scanner, the accuracy of the measured distance di j in Fig. 1 is increased when the incident angle of a laser beam to the surface is decreased. Since we want to extract the accurate horizontal surface, the laser scanner should be installed on the highest position of a robot in order to looks down the horizontal surface and minimize the incidence angle. Another reason is to generate the 3D map with 2D laser scanner by using the existing pan/tilt actuators of the neck without installing additional actuators inside the robot. Note that the pan motion of the neck is fixed to a constant angle in this paper.
Laser Scanner
φi
Zˆ S
θij
S
l
YˆS Xˆ S
d ij
H h
Pij
Zˆo
Yˆo Xˆ o
O Fig. 1.
The origin and the coordinate axis of a robot
B. 3D Depth Map in the Cartesian Coordinate The 3D point depth map in this paper denotes the 3D depth map composed of the points measured by laser scanner. The method to generate the 3D point depth map around a robot is derived in this subsection. The space in Fig. 1 is expressed in two frames, {O} and {S}. Then, the transformation mapping of a vector from the frame {S} to the frame {O} is described as follows [2]. −→ O− OPi j = Pi j
−→ O S− =O S R · SPi j + PSORG
(1)
In (1), the notation O PSORG denotes the origin vector of the frame {S} with respect to the frame {O}. In Fig. 1, the frame {S} is rotated with respect to the frame {O}, and is −→ S− described by O S R. SPi j is the distance measured by the laser scanner in cylindrical coordinates with respect to the frame {S} and it is transformed into cartesian coordinates in (2). −→ S− SPi j
= (di j , θi j , 0) = [di j cos(θi j ), di j sin(θi j ), 0]T
(2)
Note that θi j denotes the j-th firing angle of the laser beam in the i-th scan. The vector O PSORG and the rotation matrix O R are derived in (3) and (4), respectively. S OP SORG
= [lsin(φi ), 0, h + lcos(φi )]T
(3)
⎡
⎤ 0 sin(φi ) cos(φi ) OR = ⎣ 0 1 0 ⎦, S −sin(φi ), 0, cos(φi )
(4)
where φi is the pitch angle of the neck joint at the i-th scan. Therefore, Pi j in (5) is derived by using (1), (2), (3), and (4).
⎤ ⎡ ⎤ di j cos(θi j ) 0 sin(φi ) cos(φi ) 0 1 0 ⎦ · ⎣ di j sin(θi j ) ⎦ =⎣ φ ), 0, cos( 0 −sin( i ⎡ ⎤ φi ) lsin(φi ) ⎦ 0 +⎣ φ ) h + lcos( i ⎡ ⎤ cos(φi ) · di j cos(θi j ) + lsin(φi ) ⎦ di j sin(θi j ) =⎣ −sin(φi ) · di j cos(θi j ) + h + lcos(φi )
5
⎡
Pi j
P
=⎡ [P11 , P12 , · · · , Pi j , · · · , Pm(n−1) , Pmn ], ⎤ x11 , x12 , · · · , xi j , · · · , xmn = ⎣y11 , y12 , · · · , yi j , · · · , ymn ⎦ z11 , z12 , · · · , zi j , · · · , zmn = [X,Y, Z]T i = 1, · · · , m, j = 1, · · · , n
a 4 3 b
d
2 1 e
(5) c
f
(a) Clustering with six elements
Distance
5
h1 (6)
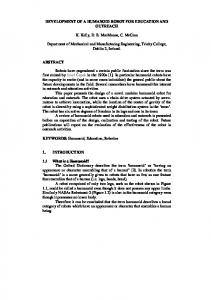
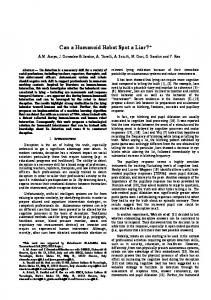
Note that P in (6) is the matrix whose dimension is 3 by (m × n) and it denotes all the points measured by the laser scanner with respect to the frame {O}. III. P LANE S EGMENTATION This section shows the plane segmentation method using 3D points P in (6). The proposed method extracts surfaces for a humanoid robot to walk on an unstructured ground. Therefore, the accuracy of the horizontal plane segmentation is more important than the accuracy of the vertical plane segmentation. To achieve this purpose, we simplify the matter by assuming that 3D points are classified as one of the following three cases: the points in the horizontal plane, the points in the vertical plane, and the points that do not belong to both the horizontal and vertical plane. Note that the horizontal plane includes the ground surface, the surface parallel to the ground, and a little sloping surface. A. Hierarchical Clustering The hierarchical clustering analysis is used in this paper to extract a plane from 3D point data. Hierarchical clustering groups the data over a variety of scales by creating a cluster tree structure called as dendrogram. In Fig. 2, there is an example to explain the hierarchical clustering analysis and the dendrogram. There are six elements, [a, b, c, d, e, f] in the example. The first step is to calculate all the distances between every pair of the elements. The key idea of the hierarchical clustering is to determine the distance calculation method so that the distance between the points on the same plane should be minimized. In this paper, two different methods for calculating the distance are used according to the type of the segmented planes, e.g. the horizontal plane and the vertical plane. The second step is to create the cluster tree in Fig. 2(b) from the distance between every pair of the elements. The number in the square in Fig. 2 denotes the index of the cluster consisting of the elements. The number in the square denotes the order of the clustering procedure. As the clusters are paired into the new clusters, the clusters become larger
4
h2
3
h3
2 1 a
b
c
d
e
f
(b) Dendrogram of the clustering Fig. 2.
Hierarchical clustering algorithm
until the root cluster 5 is formed. Note that the distance of the cluster along the vertical axis in Fig. 2(b) denotes the minimum distance between the two leaf clusters, e.g. the distance of the cluster 4 denotes the minimum distance between [b, c] and [d, e, f]. The third step is to determine the cutoff distance to cut the hierarchical trees into clusters. When h1 in Fig. 2(b) is determined as the cutoff distance, the cluster tree is divided into two clusters, [a] and [b, c, d, e, f]. In the same way, h2 and h3 divide the cluster tree into three and four clusters, respectively. At the last step, each cluster is determined whether it consists of the points on the plane or not. Since the unknown environment is used to measure the 3D point depth map, it is almost impossible to predict all the shape of the 3D points. Therefore, the proposed method finds the clusters, which consist of the points on the plane. Note that the points which are not on the horizontal plane and the vertical plane is determined as the outliers or the arbitrary-shaped obstacles around the robot. B. Surface Extraction The flowchart of the surface extraction method is shown in Fig. 3. The hierarchical clustering method is mainly used in the proposed method. At the first step, the 3D point depth map around a robot is generated and the systematic sampling from the 3D data is applied to reduce the computation load of the clustering algorithm. Note that in the systematic sampling method, every n-th element from the data is selected as a sample. Thus, Ps in Fig. 3 denotes the sampled points
3D Depth Map Generation Data Sampling Hierarchical Clustering Calculate all the distances between the points Ps
Calculate all the distances between the points Pf
Create the Hierarchical Cluster Tree
Create the Hierarchical Cluster Tree
Construct Candidate Clusters for Vertical Surface
Construct Candidate Clusters for Horizontal Surface
δ > δv i v
No
δ
j h
> δh
800
600
600
400
400
200
200
0
0
−200 1000
−200 1000 1500
500
800
600
600
400
400
200
200
0
0
−200 1000
−200 1000 1500
500
1000
The points on the cluster are determined as the points on the horizontal surface
Divide the Surfaces Whose Height is same Finalize the Surface Extraction Fig. 3.
The flowchart of the surface extraction
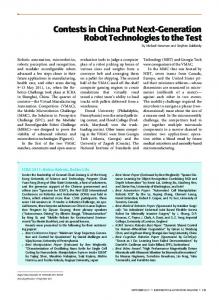
from the 3D data P in (6). At the second step, the distance between pairs of the sampled 3D data Ps is calculated and the hierarchical cluster tree is created. Note that two kinds of distance calculation methods according to the cases of the segmented plane are explained in the subsection III-C and III-D, respectively. At the third step, the hierarchical cluster tree is divided into the candidate clusters to extract the vertical surface. By comparing the i-th cluster’s density δvi with the cutoff threshold δv , the points in the candidate clusters are determined whether they are on the vertical surfaces or not. Note that the i-th cluster’s density δvi is derived in the next subsection. After finding all the vertical surface from the candidate clusters, Pf is derived by removing the points on the vertical surface from the sampled point Ps . The similar procedure is repeated to extract the horizontal surface from the points Pf . Figure 4 shows the clustering procedure from the raw 3D data to the range segmentation. The 3D data in Fig. 4 shows three stairs and one wall on the ground. One wall is extracted at the first clustering procedure, and the three stairs and the ground are simultaneously extracted at the second clustering procedure. Note that there are a few points on the vertical surface of the stairs in Fig. 4. Some of them are the measured points on the vertical surface of the stairs and the others are the mixed pixels, which is the outliers due to the measurement error. In the procedure to construct the candidate clusters for the plane segmentation, outliers are automatically removed from the clusters without additional calculation, which is one of the advantages of the clustering-
1000
0
500 −500
0
(c) Finding the vertical plane Fig. 4.
1500
500
500 −500
Yes
Yes The points on the cluster are determined as the points on the vertical surface
0
(b) Candidate clusters for the vertical plane
800
0
500 −500
0
(a) Original 3D point data
No
1000
0
500 −500
1500
500
1000
0
Finding the Horizontal Surface
Finding the Vertical Surface
800
0
(d) Horizontal plane segmentation
The Procedure of the hierarchical clustering algorithm
based segmentation approach. C. Vertical Surface Extraction This subsection explains how to calculate li, j , the distance between the i-th point and the j-th point in Ps , and the density of the i-th cluster δvi when extracting the vertical surface from Ps . If the i-th point and the j-th point in Ps are existed in the same plane, the distance li, j should be defined to be minimized. If not, the distance li, j should be maximized. To derive the minimum distance li, j between the pairs of the points on the wall, the characteristics of the 3D point data in Fig. 4 is observed at first. While the points on the horizontal planes are distributed in large area of the x-y plane as shown in Fig. 4, the points on the vertical plane are concentrated in small area of the x-y plane. Therefore, to minimize the distance between the points on the vertical plane and maximize the distance between the points on the horizontal plane, the distance along the z axis is neglected and the distance in the x-y plane is considered to calculate the distance li, j : li, j =
�
(xi − x j )2 + (yi − y j )2 .
(7)
By using (7) to calculate the distances between the pairs of the point in Ps , the candidate clusters in Fig. 4(b) is obtained. Note that the different colors are used to distinguish the clusters in Fig. 4(b). The next step is to find the vertical plane among the candidate clusters in Fig. 4(b). By calculating the cluster’s density on the x-y plane, the vertical plane among the candidate clusters can be extracted. The density of the i-th cluster, δvi , is defined as:
δvi = n(ci )/lmax (ci ),
(8)
where n(ci ) is the number of the points in the i-th cluster ci , and lmax (ci ) is the maximum distance li, j among the pairs of the point in the i-th cluster ci . Comparing δvi with the cutoff threshold δv , one vertical plane in Fig. 4(c) is obtained from the candidate clusters in Fig. 4(b). Note that the cutoff threshold, δv , is a design parameter, which has enough margin to determine the proper threshold value. This subsection explains how to calculate the distance li, j to extract horizontal surfaces from Pf . Note that Pf is shown as the blue dots in Fig. 4(c). The procedure of the horizontal surface extraction is same as the procedure of the vertical surface extraction, except the calculation of li, j . Difference between the horizontal planes in Fig. 4(c) is the height of the planes. Therefore, the points in Pf should be divided according to the height along the z-axis, and li, j for extracting the horizontal surfaces can be defined as:
500 0
h2 500 2000
0 1000 500
(a) Desired shape of the stairs
a2
(b) Extracted shape of the stairs
1500
h2
1000 500 0
2000
−500 1000
1500 500
h1
1000 0
500
−500
a1 (10)
1500
−500
a1
(9)
The density of the i-th cluster, δhi , is defined as:
δhi = n(ci )/lmax (ci ).
h3
a2
h1
D. Horizontal Surface Extraction
li, j = zi − z j .
1000
a3
−1000
(c) Desired shape of the stairs
0
(d) Extracted shape of the stairs
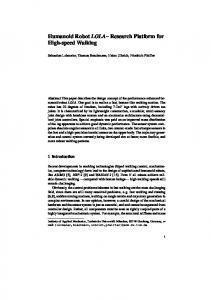
The result of the horizontal surface extraction using (9) and (10) is shown in Fig. 4(d). IV. E XPERIMENTAL R ESULT In order to evaluate the proposed method, several experiments are performed using the humanoid robot, Mahru1, which was developed by Korea Institute of Science and Technology (KIST) [1]. Mahru-1 has 27 degrees of freedom except 8 DOF for both hands and it stands 150cm tall and weighs 67kg. Six-axis force/torque sensors installed on each wrist and ankle are used to keep the balance of the robot. In every 5 milliseconds, the joint DC motors are controlled by a computer, which is installed with RT-linux (Fedora core 5, Xenomai 2.2.6). To analyze the 3D depth map and extract the surfaces, we use the statistics toolbox in Matlab. Figure 5 shows the results of extracted surfaces from the three kinds of the stairs. The desired shapes of the stairs are shown in Fig. 5(a)(c)(e) and the corresponding results are shown in in Fig. 5(b)(d)(f), respectively. The first staircase in Fig. 5(a) includes three stairs whose height is different from each other. The second staircase in Fig. 5(c) includes stairs whose shape of the surface is not rectangle. In Fig. 5(e) there are two staircases whose heights are same. Note that the measured points on the vertical plane of the stairs are regarded as the outliers and removed in Fig. 5. The proposed method in this paper can extract any shapes of the planar surfaces, and there is no limitation to the extracted surface number, which are useful characteristics to segment planes from the 3D data of unstructured surfaces. The calculation load is decreased by applying the systematic sampling method. Therefore, the proposed method costs less than one second to extract various surfaces with the amount
1000
a2
h2
500 0
2000
500
h1
1500
0 −500
a1 (e) Desired shape of the stairs Fig. 5.
1000 500
(f) Extracted shape of the stairs Various stair surfaces extraction
of 20538 points around a robot. The proposed method is based on the hierarchical clustering algorithm so that the outliers are easily removed. Since hierarchical clustering algorithm calculates all the distances between the pairs of the points measured by laser scanner, far points such as outliers cannot be included in the extracted surface. Figure 6 shows the results when the bookshelf and two books on the table are scanned by the laser scanner. Note that the side surface of the bookshelf is thin, therefore the points on the side surface of the bookshelf are not detected in Fig. 6(b). Although there are a few measured points on the side surface of the bookshelf in the raw laser data, the points are regarded as the outliers and removed in Fig. 6(b). The blue dots in Fig. 6(b) denote the surface on the background by using the extraction method of the vertical surface. In Fig. 6(c), there are two books on the table. The desired
TABLE II T HE ACCURACY OF THE SURFACE AREA [cm2 ] Fig.
1400
a4 h4
1000
5(b)
800
a3
h3
600
5(d)
400 200
a2
h2
a1
cases
1200
2000
0 1500
−200
h1
500
(a) Desired shape of the bookshelf
5(f)
1000 0
6(b)
500
−500
6(d)
(b) Extracted shape of the bookshelf
desired measured desired measured desired measured desired measured desired measured
1 713 684 713 692 357 314 792 762 414 408
surface no. 2 3 770 644 712 604 644 612 322 298 792 792 771 769 494 2700 456 2538
4
792 728
V. C ONCLUSIONS h2
a2
h1 1000
a1 a3
500
h3
2000 1500
0
1000 500
(c) Desired shape of two books on the table Fig. 6.
0
500
−500
(d) Extracted shape of two books on the table
The bookshelf and the table extraction TABLE I
T HE ACCURACY OF THE SURFACE HEIGHTS [cm] Fig. 5(b) 5(d) 5(f) 6(b) 6(d)
cases desired measured desired measured desired measured desired measured desired measured
1 8.4 8.3 8.4 8.2 8.4 7.9 15 14.5 2.4 2.6
surface 2 24.4 22.9 29.6 28.8 29.6 28.9 28.5 27.5 5.1 5.9
no. 3 38.0 37.0
4
This paper presented a method to detect and estimate planar surfaces around a humanoid robot in unstructured environment. By using the laser scanner and tilting motion of the neck, we generated the 3D depth map and extracted the surfaces around the robot. The experiments show that the proposed method can remove the outliers and extract accurate dimensions of the stairs, tables, books and so on. When the proposed method extracts the planar surface dimensions, there is no limitations of the surface number and the shape. By using the dimensions of the extracted surface, the robot can generate walking trajectory on an unstructured ground. The extracted surfaces of objects on a table are also used to generate the hand grasping motion and arm motion. The proposed method measures the distance to surfaces of obstacle when the robot stands on the ground. In the future, we will minimize the measurement error when the robot is walking, and we will realize the humanoid robot walking on unstructured ground by using the proposed method and generate more efficient footstep planner. R EFERENCES
28.5 27.0 78.5 81.7
30 28
heights of the two books are 2.4cm and 5.1cm, respectively. As can be seen in Fig. 6(d), the surface such as the cover of the thin book can be extracted by using the proposed method. Table I and II show the accuracy of the extracted surface height and area. Note that height denotes the average height of points in the same plane. To calculate the area of points in the same plane, we project all the points into the xy plane and calculate the area of the convex hull of the points in the same plane to derive the surface area in the experiment. The extracted surface height is more accurate than the extracted surface area. In most cases of table I and II, the error is small enough for a humanoid robot to generate footprint trajectories in unstructured surfaces.
[1] D. Choi, Y. Kang, H. Lim, and B. You, “Knowledge-based control of a humanoid robot,” IEEE/RSJ International Conference on Intelligent Robots and Systems, pp. 3949–3954, 2009. [2] J. Craig, Introduction to robotics. Addison-Wesley, 1989, vol. 7. [3] J. Gutmann, M. Fukuchi, and M. Fujita, “3d perception and environment map generation for humanoid robot navigation,” The International Journal of Robotics Research, vol. 27, no. 10, pp. 1117–1134, 2008. [4] M. Heracles, B. Bolder, and C. Goerick, “Fast detection of arbitrary planar surfaces from unreliable 3D data,” IEEE/RSJ International Conference on Intelligent Robots and Systems, pp. 5717–5724, 2009. [5] V. Nguyen, S. Gachter, A. Martinelli, N. Tomatis, and R. Siegwart, “A comparison of line extraction algorithms using 2D range data for indoor mobile robotics,” Autonomous Robots, vol. 23, no. 2, pp. 97–111, 2007. [6] K. Okada, T. Ogura, A. Haneda, and M. Inaba, “Autonomous 3d walking system for a humanoid robot based on visual step recognition and 3D foot step planner,” Proceedings of the IEEE International Conference on Robotics and Automation, pp. 623–628, 2005. [7] C. Park, T. Ha, J. Kim, and C. Choi, “Trajectory generation and control for a biped robot walking upstairs,” International Journal of Control, Automation and Systems, vol. 8, no. 2, pp. 339–351, 2010. [8] C. Park, D. Kim, B. You, and S. Oh, “Characterization of the Hokuyo UBG-04LX-F01 2D laser rangefinder,” IEEE International Symposium on Robot and Human Interactive Communication, pp. 385–390, 2010. [9] C. Ye and J. Borenstein, “Characterization of a 2D laser scanner for mobile robot obstacle negotiation,” Proceedings of the IEEE International Conference on Robotics and Automation, vol. 3, pp. 2512–2518, 2002.