www.nature.com/scientificreports
OPEN
Received: 21 February 2017 Accepted: 6 July 2017 Published: xx xx xxxx
Group Augmentation in Realistic Visual-Search Decisions via a Hybrid Brain-Computer Interface Davide Valeriani , Caterina Cinel & Riccardo Poli Groups have increased sensing and cognition capabilities that typically allow them to make better decisions. However, factors such as communication biases and time constraints can lead to less-thanoptimal group decisions. In this study, we use a hybrid Brain-Computer Interface (hBCI) to improve the performance of groups undertaking a realistic visual-search task. Our hBCI extracts neural information from EEG signals and combines it with response times to build an estimate of the decision confidence. This is used to weigh individual responses, resulting in improved group decisions. We compare the performance of hBCI-assisted groups with the performance of non-BCI groups using standard majority voting, and non-BCI groups using weighted voting based on reported decision confidence. We also investigate the impact on group performance of a computer-mediated form of communication between members. Results across three experiments suggest that the hBCI provides significant advantages over non-BCI decision methods in all cases. We also found that our form of communication increases individual error rates by almost 50% compared to non-communicating observers, which also results in worse group performance. Communication also makes reported confidence uncorrelated with the decision correctness, thereby nullifying its value in weighing votes. In summary, best decisions are achieved by hBCI-assisted, non-communicating groups. Several decades of research in decision-making have shown that groups usually make better decisions than individuals (wisdom of crowds). This applies to both when groups face complex decisions requiring evaluation of information of different nature, from different sources and, possibly, acquired over an extended period of time1, 2, to circumstances in which rapid perceptual judgements have to be made, for example, when estimating uncertain quantities3, finding the correct mapping between letters and numbers4, or performing memory tasks5. In these cases, the augmented capabilities and intelligence achieved by groups are the result of integrating different views and percepts through the interaction of group members. The advantages of groups, however, can be limited, if not nullified, this depending on a large number of factors, including coordination of resources and communication6, sharing of information7, group style8, judgement biases and leadership6, 9. For example, in the presence of a leader who is too dominant, collegial decisions may end up being unilateral decisions. Also, sometimes group decisions made by freely-communicating individuals may be worse than the decisions made by the best individual10, 11. This is particularly true when there are time constraints on the decisions. Given the negative impact that the interaction of group members can have on decisions in some circumstances, one may wonder whether we could use technology to obtain the advantages of groups without member interactions. It is plausible to think, in fact, that group decisions could be partly based on the integration of neural activity of the group’s members, particularly in circumstances that require rapid decisions. This idea has recently been explored with collaborative Brain-Computer Interfaces (cBCIs) by Eckstein et al.12, where the brain activity of up to 20 group members asked to discriminate between rapidly presented pictures of cars and faces was aggregated to obtain group decisions. A cBCI with 8 or more observers was more accurate and faster than a single non-BCI user in this visual discrimination task. Similar results were obtained with a Go/NoGo version of the same task13. However, cBCI-assisted groups were always inferior to corresponding non-BCI groups. To address this limitation, we recently developed a hybrid BCI (hBCI) that used a combination of EEG neural signals and response times (RTs) to estimate the decision confidence of group members14, and, ultimately, the accuracy of each response. The relationship between RTs and decision confidence (or certainty) has been widely Brain Computer Interfaces and Neural Engineering Laboratory, School of Computer Science and Electronic Engineering, University of Essex, Wivenhoe Park, Colchester, CO4 3SQ, UK. Correspondence and requests for materials should be addressed to D.V. (email:
[email protected])
SCIENtIfIC REPOrTS | 7: 7772 | DOI:10.1038/s41598-017-08265-7
1
www.nature.com/scientificreports/ described in the literature15–19, and while the mechanisms behind this relationship are still not fully understood, it is well known that lower decision confidence and accuracy are associated with longer decision times. In our hBCI14, participants performed a visual-matching task where they had to decide, as rapidly as possible, whether or not two sets of shapes presented in rapid succession were identical. To perform feature selection and parameter identification, we used information on whether each observer’s response was correct or incorrect, on the assumption that observers are on average less confident in erroneous decisions than in correct ones. Indeed, an observer is more likely to give an incorrect response when the perceptual processes leading to the decision do not provide all the necessary information to take the correct decision, hence making the user uncertain. On the other hand, it is reasonable to assume that the confidence with which an observer makes a decision would be high for most of the correct trials. Decision confidence was, therefore, interpreted as the probability of a decision being correct20. The hBCI used a trained machine-learning component to build correlates of decision confidence. These were used to weigh the decisions of each group member, which were then combined to obtain a final group decision. Tests conducted on the visual-matching task showed that our hBCI was able to achieve, for the first time, more accurate decisions than those obtained by traditional non-BCI groups using standard majority rule. Similar results were later achieved with a more demanding visual-search task21. While these results are very encouraging, they are not surprising given that the hBCI estimates and uses the decision confidence to weigh individual decisions. In principle, one could more easily and, perhaps, more accurately ask participants themselves to report their decision confidence. This may have both advantages and disadvantages. On the one hand, due to the noise and unreliability of EEG, it would not be surprising if reported confidence was more reliable than the estimates from the hBCI. On the other hand, research has shown that humans do not always report high values of confidence where their decisions are more likely to be correct and vice versa22, e.g., overconfident people may report high values of confidence when they are likely to be wrong23, 24. In our previous work, we did not explore the relative benefits and drawbacks of using the confidence reported by the users instead of the confidence estimated by the hBCI as a mechanism to improve group decision making. Moreover, we did not examine whether our findings would only apply to decisions associated with the simple shapes and colours used previously or would also extend to decision tasks with realistic stimuli. Finally, we did not study whether introducing some form of communication within groups would be an advantage or a hindrance. The aims of this study were to start addressing these three issues and to investigate the conditions in which hBCI-based group decisions are advantageous or deleterious and why. We carried out three visual-search experiments, where EEG data and RTs were recorded. As in our previous experiments, the neural and behavioral features related to each decision were used to estimate the level of confidence of each observer making that decision. In Experiment 1a, we asked participants to perform a visual-search task using realistic stimuli instead of simple shapes, with the aim of testing our hBCI in realistic domains, as well as corroborating (or otherwise) our previous findings. On each trial, participants were briefly presented with a display showing a variable number of penguins and where also a polar bear might be present. Participants’ task was to decide, as rapidly as possible, whether or not they saw the polar bear (which was presented on 25% of trials). In Experiment 1b, stimuli and task were identical to those of Experiment 1a. However, participants were also asked to report their confidence after each decision, which allowed us to compare reported and hBCI-estimated confidence values head-to-head as weights for individual decisions. While we are aware that providing the level of confidence after a decision has been made might be less informative compared to when this is done concurrently with the decision17, in Experiment 1b we followed the former approach. This allowed us to keep the procedure used in Experiments 1a and 1b — and presumably also the neural correlates of perceptual and decision processes — identical in the two experiments up until the response. Finally, in Experiment 2 we explored the impact of a controlled form of communication on both group decisions and confidence estimation. In both Experiments 1a and 1b, as in our previous research, participants were isolated while making decisions and, so, there was no form of interaction. In Experiment 2, pairs of volunteers undertook the same task as for other two experiments and were allowed to exchange information via a computer-mediated form of communication.
Methods
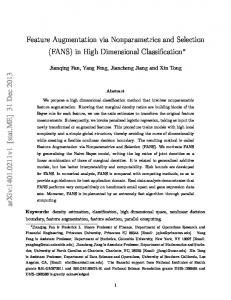
Participants. Three experiments were performed for this study: in Experiments 1a and 1b participants were isolated, while in Experiment 2 participants were randomly paired and were allowed to use a constrained form of communication. Ten healthy volunteers took part in Experiments 1a (4 females, mean age = 28.5 years, SD = 6.0) and 1b (5 females, mean age = 27.4 years, SD = 5.5). Eight pairs of healthy participants (7 females, mean age = 28.1 years, SD = 7.2) participated in Experiment 2. The data of one pair, however, had to be discarded, as the neural data recorded from one member of the pair become very noisy half-way through the experiment due to poor electrode contact. Therefore, we only considered the data recorded from the remaining seven pairs in the analysis of Experiment 2. All participants had normal or corrected-to-normal vision and signed an informed consent form before taking part in the study. The research received ethical approval by UK’s MoD and University of Essex in July 2014. All experiments were performed in accordance with relevant guidelines and regulations. Stimuli and Procedure. Each experiment consisted of 8 blocks of 40 trials. In each trial, participants had to decide whether a “target” was present amongst a number of non-targets or “distractors”. Figure 1 shows the timeline of a single trial. In all experiments, trials started with a fixation cross, displayed for one second. Then an image of an arctic environment was shown for 250 ms. Each picture contained a variable number of penguins (distractors) and possibly a polar bear (target), and was presented fullscreen, subtending approximately 30.3 degrees horizontally and 19.2 degrees vertically. This display was immediately followed by a mask (a black and white 24 × 14 checkerboard) for 250 ms. Participants had to decide, as quickly as possible, whether or not the target was presented, by clicking the left or the right mouse buttons, respectively (1st response). RTs were recorded. While this ended a trial SCIENtIfIC REPOrTS | 7: 7772 | DOI:10.1038/s41598-017-08265-7
2
www.nature.com/scientificreports/
Figure 1. Timeline of a trial. The first four displays were common for all experiments, the fifth display was presented in Experiments 1b and 2, and the last two displays were only presented in Experiment 2.
of Experiment 1a25, the participants of Experiments 1b and 2 were then asked to indicate, within four seconds, the degree of confidence of their decision (0–100%) using the mouse wheel (which varied confidence in 10% steps) – see fifth display in Fig. 1. In Experiment 2, to synchronise participants, a display containing the text “Please wait” was shown to the fastest member of the pair after indicating his/her confidence, until the other member had also indicated his/her confidence. Pair members were then shown a display containing the decisions and the degrees of confidence indicated by each of them for two seconds. This was the only form of communication allowed between the participants. Finally, both pair members were individually asked once again to indicate whether or not the target was present (2nd response). In Experiment 1a, the stimulus set included five images without target and 40 images with the target. The target images were prepared by superimposing to non-target pictures a polar bear chosen from a set of two. Polar bears were positioned in four possible locations. Experiments 1b and 2 used the same images, except that: (1) we discarded six pictures where the average error rate across participants in Experiment 1a was below 10% (too easy) or above 90% (too difficult), and (2) we increased the number of stimuli by including horizontally-flipped versions of the remaining images, resulting in a stimulus set of 68 target images and 10 non-target images. In each experiment, the same randomly generated sequence of displays was used for all participants. This sequence was identical in Experiments 1b and 2, while in Experiment 1a 17 trials out of 320 were different from those used in the other experiments. Target images occurred in 25% of the trials of each block. Before an experiment, participants were briefed and familiarised with the task by doing two training blocks of 10 trials each. Preparation and practice took roughly 45 minutes. Then, Experiments 1a, 1b and 2 lasted about 25, 30 and 40 minutes, respectively. Participants controlled the mouse with the preferred hand and were comfortably seated at about 80 cm from an LCD screen. In Experiment 2, participants were randomly paired and tested in different rooms to avoid direct communication.
Data Recording and Preprocessing. Neural data were acquired from 64 electrode locations according to the international 10–20 system using a BioSemi ActiveTwo EEG system. Each channel was referenced to the average of the electrodes placed on each earlobe. The data were originally sampled at 2048 Hz and then band-pass filtered between 0.15 and 40 Hz with a 14677-tap FIR filter14. Artefacts caused by ocular movements were removed by using a standard subtraction algorithm based on correlations to the average of the differences between channels Fp1-F1 and Fp2-F2. For each trial, stimulus- and response-locked epochs lasting 1900 ms were extracted from the EEG data. The former started 200 ms before the stimulus onset, while the latter started 1200 ms before the participant’s response. The epochs were then detrended and low-pass filtered (pass band of 0–14 Hz and stop band of 16–1024 Hz) with an optimal FIR filter designed with the Remez exchange algorithm. Finally, the data were downsampled to 32 Hz. The first and last 200 ms of each epoch were then trimmed to obtain epochs lasting 1.5 seconds. Each epoch was therefore represented by 48 samples for each channel (i.e., a total of 3,072 values). RTs were measured by time-stamping the clicks of an ordinary USB mouse. Training the hBCI. The main idea behind our hBCI approach to group decision making is assigning higher weights to individual decisions where a participant was confident (i.e., that are likely to be correct) than to those where the participant was not sure. This scenario represents a well-calibrated system22. In order to achieve so, we trained our hBCI system using the correctness of individual decisions, as this information is available to the hBCI in the training set. Specifically, the training trials where the decision made by a participant was correct were labelled as “confident” (i.e., label −1), while the trials associated to incorrect decisions were labelled as “nonconfident” (i.e., label +1). With this approach, our hBCI learns to predict whether a user made a correct (confident) or an incorrect (non-confident) decision, instead of predicting whether the response of the user was target or non-target. A 10-fold cross-validation procedure was used to ensure that the results were not affected by overfitting. In each fold, 288 trials were used as training set and the remaining 32 as test set, to evaluate a group’s performance.
SCIENtIfIC REPOrTS | 7: 7772 | DOI:10.1038/s41598-017-08265-7
3
www.nature.com/scientificreports/ Confidence Estimation. Common Spatial Pattern (CSP) filtering was used to extract correlates of the decision confidence from the neural data. CSP is a supervised technique which projects the data in a subspace where the variance between two different classes is maximum26. Hence, for each participant the trials in the training set were used to compute two transformation matrices, one for stimulus-locked and one for response-locked epochs. These matrices have then been used to transform the neural data collected in each epoch for each trial. The first row of each resulting transformation represented the pattern having the maximum variance. The logarithm of the variance of those was computed and used as neural feature (nf). Each trial was therefore represented by two neural features, one extracted from stimulus-locked epochs and one extracted from response-locked epochs. The RT of the participant in each decision has also been used as an additional behavioural feature, as it correlates with the confidence of the user in that decision14. Logistic regression was then used to predict the confidence weight wp,i (i.e., probability of “correct” class) of the participant p in the trial i given the feature vector. The logistic regression model was fit using L2 normalisation and a regularisation strength C chosen from the set {10−4 , 10−3 , … , 103 , 104 } via stratified cross-validation over the 288 trials of the training set (i.e., in each fold, 192 trials were used for fitting the model and the remaining 96 for validating it with a given C value). Logistic loss was used as scoring function for cross-validation.
( )
n groups of size m = 1, … , 10 Group Decisions. In Experiments 1a and 1b, we formed off-line all possible m
with the n = 10 participants available. Hence, we had 45 groups of size 2, 120 groups of size 3, etc. For Experiment 2, due to the limited number of identical EEG acquisition devices available in our lab we could not test the effects of concurrent communication on groups larger than pairs. However, we hoped that this experiment could still cast some light on whether the interaction between observers could lead to more accurate second responses and, thus, better group decisions. To gain some insight on the performance achievable by larger groups of communicating observers, we combined the available 7 pairs in all possible ways to form groups of size 4, 6, 8 and 10. We chose this way of proceeding instead of the method used in Experiments 1a and 1b to avoid splitting communicating pairs, thereby retaining some of the dynamics observed in such pairs. Hence, we had 7 = 21 groups of 2 size 4, 7 = 35 groups of size 6, and so on. We stopped at groups of size 10 to make results more easily compa3 rable with Experiments 1a and 1b. For each trial i, the decision Gi of a group of m observers was obtained by using a weighted majority rule as follows:
()
()
m Gi = sign ∑ wp , i ⋅ d p , i , p =1
(1)
where dp,i is the decision of participant p in trial i and sign is the sign operator. So, Gi = +1 if the weighted sum in Equation 1 is positive and Gi = −1 if it is negative. In case of ties (which would produce Gi = 0), a random decision was made between +1 and −1. In all experiments, we tested the group performance obtained when using traditional groups based on standard majority (i.e., ∀ p, ∀ i, wp,i = 1) as well as the performance obtained by groups when the confidence weights were estimated using: (a) only the RTs, (b) only the two neural features, or (c) the RTs and the neural features. Hereafter, we will use the term RTCI to refer to the first and the term nf-BCI to represent the second. We will reserve the acronym hBCI to refer to the third type of system, as this is the form of hybrid BCI the article mostly focuses on, albeit also the nf-BCI is a hybrid BCI. In Experiments 1b and 2 we also tested the use of the subjective confidence indicated by the user in each trial to weigh individual decisions when making group decisions (“Confidence Majority”). For simplicity, we decided to use the reported confidences directly as weights in Equation 1. Naturally, subjective confidence values are likely to include individual biases22. However, when we tested (in results not reported) different forms of normalisation for these confidence values (e.g., min-max scaling or division by the median training-set confidence), we found that they did not result in significant improvements of group performance w.r.t. the simpler approach tested here. Finally, in Experiment 2 we also computed group decisions obtained with standard majority when using the 2nd responses provided by participants after seeing the decision and the confidence reported by the other group member. We expected these to be more similar to those obtained in traditional interacting groups and, hence, to be more accurate.
Results
Confidence-based group decisions are more accurate than traditional ones. The decision errors of participants of Experiment 1a are shown in Fig. 2 (top left). The average performance of groups of different sizes using each method is shown in Fig. 2 (bottom left). From these results it is clear that all confidence-assisted, even-sized groups performed significantly better than majority-based, equally-sized groups — p