Eurographics/ IEEE-VGTC Symposium on Visualization (2007) Ken Museth, Torsten Möller, and Anders Ynnerman (Editors)
Grouse: Feature-Based, Steerable Graph Hierarchy Exploration Daniel Archambault†1 , Tamara Munzner† 1 and David Auber‡2 1 University
of British Columbia, Canada. of Bordeaux, France.
2 University
Abstract Grouse is a feature-based approach to steerable exploration of a graph and an associated hierarchy. Steerability allows exploration to begin immediately, rather than requiring a costly layout of the entire graph as an initial step. In a feature-based approach, the subgraph inside a metanode of the graph hierarchy is laid out with a wellchosen algorithm appropriate for its topological structure. Grouse preserves the input hierarchy, which provides meaningful information to the user when its metanodes correspond to features of interest. When a metanode in the hierarchy is opened, a limited number of metanodes are laid out again along the path between the opened node and the root. We demonstrate the effectiveness of Grouse on datasets from IMDB, the Internet Movie Database, where nodes are actors and cliques represent movies. The combination of feature-based layout and limited relayout computation does not fragment features in the hierarchy and improves the number of levels in the hierarchy that can be seen at once over previous approaches. Categories and Subject Descriptors (according to ACM CCS): H.5.0 [Information Systems]: Information Interfaces and Presentation: General; G.2.2 [Discrete Mathematics]: Graph Theory: Graph Algorithms
1. Introduction Grouse is a tool for the interactive exploration of a graph and an associated hierarchy. It is an acronym for Graph hierarchy On-line User Steered Exploration and is named after a mountain near Vancouver. A hierarchy is defined as a recursive grouping placed on the nodes in this graph. For example, in a social network, where nodes represent people and edges represent relationships between them, a graph hierarchy may group these people into departments on the small scale and into universities on a larger scale. Metanodes are the interior nodes of this hierarchy that contain a grouping of nodes in the graph. In our social network example, metanodes are nodes representing universities and departments. The leaves in the hierarchy are the nodes of the input graph. In our social network example, these are the people. For large graphs, a detailed layout of the entire graph may not provide a useful level of abstraction † Email: {archam,tmm}@cs.ubc.ca ‡ Email:
[email protected] c The Eurographics Association 2007.
for users, and can be visually overwhelming. In interactive systems used to explore this data, users open or close metanodes to adjust the complexity of the view. This interaction specifies a cut of the graph hierarchy, namely the boundary between the visible and hidden metanodes and leaves. Multilevel graph drawing algorithms compute graph hierarchies automatically to accelerate and improve the layout process. These hierarchies can also provide meaningful information to the user. For instance, subsets of the Internet Movie Database (IMDB) where nodes are actors and two actors in the same movie are linked by an edge. A decomposition that finds cliques, or complete subgraphs, shows useful information because each movie is itself a clique [AMA07]. Many of the interactive systems used to explore these hierarchies require a precomputed layout of the entire graph as input. Computing the layout of a large graph is an expensive proposition, and the time needed can range from minutes to hours. In a steerable interactive system, the layout is computed progressively, on demand, as the user explores the graph hierarchy. We distinguish between progressive layout and progressive rendering, as provided by several previ-
D. Archambault, T. Munzner & D. Auber / Grouse: Feature-Based Steerable Graph Hierarchy Exploration
ous systems [Mun98, JKM03, Aub03], where precomputed layouts are drawn in order of importance so that the rendering is interruptible in response to user action. In contrast, steerable layout provides an abstraction of the graph hierarchy to users so that computational effort can be directed to regions of interest. Very few existing systems provide this benefit [EH00, AvHK06]. The principal contribution of Grouse is to combine steerable exploration with feature-based layout, where the algorithm used to lay out each metanode is tuned to its topological structure. For example, we use specialized approaches for drawing trees, cliques, and meshes that are faster than and provide more understandable layouts than force-directed placement. We preserve the input hierarchy, which provides meaningful information to the user when its metanodes correspond to features of interest. When a metanode in the hierarchy is opened, we perform a relayout calculation whose complexity depends only on the limited number of visible metanodes on the path between the opened node and the root of the hierarchy. One of the major challenges in showing multi-level graphs is providing adequate information density so that structure at multiple levels of the hierarchy are simultaneously visible. The combination of feature-based layout and limited relayout computation leads to improved information density over previous approaches.
2. Previous Work Graph and hierarchy visualization is a very active research area [HMM00]. We focus our discussion of previous work on the two most related categories of multilevel algorithms and interactive exploration systems.
to simply using force-directed layout for all metanodes, so Grouse is built on that software infrastructure. 2.2. Interactive Hierarchy Exploration Many of the systems developed to explore a graph and its associated hierarchy require precomputed layouts, while only a few are steerable. 2.2.1. Precomputed Layout Required Several techniques have been developed to visualize graphs and their associated hierarchies when a layout of the graph is given as input. Eades and Feng [EF96] display the entire graph hierarchy across all levels at once by placing hierarchy levels onto parallel planes in three-dimensional space. Schaffer et al. [S∗ 96] have a multifocal fisheye approach where metanodes can be expanded and viewed in the context of the entire graph using fisheye techniques. Gansner et al. [GKN05] provide a topological fisheye view of a graph hierarchy, where coarser approximations of graph structure are shown at increasing Euclidean distances from a focus point. Abello et al. [AKY04] also define a compound fisheye view for large graphs that shows cuts, with the addition of a linked treemap view showing the graph hierarchy. Strongly connected clusters of nodes are visualized by van Ham and van Wijk [vHvW04], using a hierarchy computed from Euclidean and graph theoretic distance between nodes. All of these approaches require the full layout of the entire graph to be computed before exploration can begin, whereas with steerable approaches it can begin immediately. 2.2.2. Steerable Exploration
Multilevel graph drawing algorithms automatically compute graph hierarchies that are used to accelerate or improve the layout process. The hierarchy construction algorithms of these approaches have been based on an estimates of maximal matching [Wal03], graph filtration based on shortest path distance in GRIP [GK02], local graph connectivity in FM3 [HJ04], and topological features in TopoLayout [AMA05, AMA07].
Two previous systems do provide steerable exploration. The DA-TU system [EH00] uses force-directed placement on a clustered graph drawn in two dimensions. Metanodes of the graph can be opened and closed and the graph hierarchy can be modified interactively. After any of these operations, a specialized force-directed algorithm, which has forces to keep child subgraphs of the hierarchy together, is run on the entire cut. However, since every operation causes forcedirected placement to be run on the entire cut, this approach does not scale past small cut sizes.
None of these systems address interactive hierarchy exploration. They use the hierarchy to accelerate lay out of the graph and present a final layout. With Grouse, we propose separating the problem of hierarchy construction from that of hierarchy layout, considering the former as a preprocessing step and focusing on the latter. We use feature-based hierarchies constructed by TopoLayout as input to Grouse, and the cost of that preprocessing step is usually O(N log N) where N is the number of leaves in the graph hierarchy. As TopoLayout is the only previous system that provides feature-based layout based on the metanode type, as opposed
ASK-GraphView [AvHK06] is a powerful steerable system that addresses both hierarchy creation and exploration through multiple linked views. One notable feature of ASKGraphView is handling out-of-core computations on huge graphs with a client/server architecture, but Grouse only addresses the common case where the graph fits into main memory. It computes hierarchies using a feature-based decomposition, detecting trees, biconnected components, and clusters, but uses force-directed placement for all metanodes rather than supporting feature-based layout as we do with Grouse. After the base decomposition, it modifies the
2.1. Multilevel Algorithms
c The Eurographics Association 2007.
D. Archambault, T. Munzner & D. Auber / Grouse: Feature-Based Steerable Graph Hierarchy Exploration
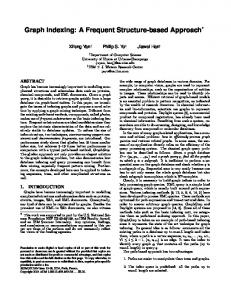
Figure 1: The Grouse interface has two linked views, showing the selected node in both in red. On the left, all metanodes and leaves in the graph hierarchy in the tree view. On the right, the graph view shows closed metanodes on the cut with hexagons, and the open metanodes above them in the hierarchy as circles. The hierarchy structure is shown in the graph view by containment within nested circles, while graph structure is shown with connecting edges and metaedges. Metanodes are colored by the feature they contain, with leaves shown as grey boxes.
feature-based hierarchy by imposing thresholds on hierarchy depth and the number of children in each metanode. While these modifications make force-directed placement tractable, they can mask interesting topological structures. In contrast, Grouse preserves the given input hierarchy because it may provide meaningful information such as the IMDB cliques described above. In ASK-GraphView, subgraphs are shrunk down to fit inside their parent metanode when it is opened, whereas in Grouse we achieve a more informationdense layout by performing a relayout calculation for the metanodes on the path up to the hierarchy root. 3. Interface The Grouse interface consists of two linked views, as shown in Figure 1. On the left is the tree view window showing all metanodes and leaves in the graph hierarchy. It supports tree browsing with standard interaction of expanding or collapsing items and vertical scrolling. On the right is the graph c The Eurographics Association 2007.
view window, showing the current graph cut with a nodelink diagram. It supports standard pan and zoom through the two-dimensional view. Metanodes can be in one of three states: open, where they show the subgraph beneath the metanode in the hierarchy contained within its enclosing circle; on the cut, visible and drawn as an opaque hexagon without further detail; or hidden, not visible in the graph view. Containment is used to show the structure of the graph hierarchy. We show the graph relationships by drawing edges from leaf nodes in the usual way, and drawing metaedges between two cut metanodes or a cut metanode and a leaf node if there is an edge between any leaves beneath the metanodes in the graph hierarchy. Leaf nodes are drawn as grey boxes in the graph view. We color metanodes by the feature type they contain, inspired by Stone’s Tableau Software color scheme [Sto06]. Nodes which contain biconnected components trees are brown, trees are blue, sets of clusters are yellow, cliques
D. Archambault, T. Munzner & D. Auber / Grouse: Feature-Based Steerable Graph Hierarchy Exploration
are cyan, meshes are purple, and all other components are green. The saturation of the base color represents the depth in the hierarchy, so that the large disks are less saturated and the smaller ones are more brightly colored. Grouse supports linked highlighting between views. In the tree view, the current cut of the graph is shown within the context of the entire hierarchy by coloring the label backgrounds of open metanodes according to their feature type. Nodes are selectable in either view, and are highlighted with a red perimeter in the graph view and a red background label in the tree view. The main interaction operation is the opening of a metanode. The subgraph beneath it appears at the location of the metanode, and the nodes of the subgraph move in a smooth transition to their locations in the new layout. Their enclosing metanode appears at a depth proportional to its depth in the hierarchy. A cut metanode can be opened by clicking within its hexagon in the graph view or by clicking on its name in the tree view. A hidden metanode can be opened by clicking in the tree view, which triggers a multi-stage animation of successively opening up all enclosing metanodes on the path from its ancestor in the cut down to the desired node. All the metanodes present in a subtree below a metanode in the graph view can be opened by holding down the shift key and clicking a closed metanode.
4. Algorithms Grouse is built on the Tulip framework libraries [Aub03]. We use many of its data structures, graph drawing algorithms, and rendering capabilities for our steerable exploration system. In this section, we first describe feature-based layout and how the crossing minimization phase is generalized to work with hierarchy cuts. We then present the core algorithm used to support the animated metanode opening operation. We also discuss two other algorithmic issues: minimizing change during relayout and morphing node locations and sizes during animated transitions.
and their complexity. N is the number of nodes in a subgraph and E is the number of edges at a level in the hierarchy. Cliques are drawn with the nodes arranged in a circular layout, at a low O(N) cost. A hub-and-spoke glyph replaces the clutter of drawing all pairs of edges where a central purple triangle is connected to each node of the clique. Trees are drawn with the O(N) Buchheim-Walker algorithm [BJL02] for deep trees and the O(N log N) Bubble Tree algorithm [GADM04] for bushy trees. Decomposing a graph into biconnected components always yields a tree in the enclosing metanode, and we again distinguish between bushy and deep trees. Components that perform well when the fast High Dimensional Embedder algorithm [KH02] is used. These graphs are often mesh-like, and they are drawn with an area-aware version of HDE that requires O(m(N log N + E)) where m is set to fifty. For clusters, and all other subgraphs where a specific feature is not specified, we use an area-aware version of the O(N 3 ) GEM force-directed approach [FLM95]. Finally, the complexity of the overlap elimination pass [DMS05] is O(N log N + k) for layouts with k overlaps. Typically, k is subquadratic. In TopoLayout, the final crossing reduction pass reduces, but does not completely eliminate, edge-edge and edgemetanode crossings by rotating metanodes according to a computed torque value. The generalization of this approach to steerable exploration is straightforward: we simply determine the forces using the cut metanodes rather than the leaves of the hierarchy. The complexity of the generalized crossing reduction is O(NEv ), where Ev is the number of visible edges in the current cut. We also introduce a small improvement in the torque computation to better avoid the local minimum where equal and opposite torques average out to zero torsional force. We now also compute the average absolute value of the torque. If this average is larger than 90◦ , we try rotating the node by 180◦ . If the average torque decreases, we keep the node flipped; otherwise we leave it unchanged.
4.1. Layout and Crossing Reduction
4.2. Changing the Cut
In Grouse, we adapt the feature-based layout originally introduced in TopoLayout [AMA05,AMA07] to make it steerable. As discussed in that paper, providing good drawing density that allows structure at as many levels as possible to be seen simultaneously is a difficult challenge. To obtain high visual quality, we must have some idea of the size of the graph layout at each level and set a corresponding size for each metanode in the hierarchy. Thus, the best results come from generalizing algorithms to be area-aware; that is, to take varying node size into account. After this initial layout step, we execute passes to eliminate overlaps between metanodes, and then a final post-processing pass reduces edge-edge and edge-metanode crossings.
In Grouse, when the user opens a metanode, the cut through the hierarchy changes and we need to update the graph view. The selected node changes type, moving above the cut to become an open metanode. All formerly hidden nodes in the subgraph of the metanode are added to the cut. In Figure 2, we show how metanodes are updated with a change in the cut and we provide pseudocode for the algorithm in Figure 3.
We briefly summarize the TopoLayout layout algorithms
In our incremental layout approach, the size of all the metanodes in the graph hierarchy start with a diameter of √ N, where N is the number of leaves in the subtree beneath the metanode. This default value causes the area of the metanode be roughly proportional to its number of leaves. When the user opens a metanode for the first time, the subgraph contained within the metanode is laid out, leading to c The Eurographics Association 2007.
D. Archambault, T. Munzner & D. Auber / Grouse: Feature-Based Steerable Graph Hierarchy Exploration
A
A
B
B
B
A E
E
C
B
D
F
E
C
G
(a)
(b)
(c)
F
(d)
C
B
C G
F
A
A
E D
C G
F
B
A
D
D
C
G
F
G
D
(e)
E
F
G
(f)
Figure 2: Example of the computations made when changing the cut by opening a metanode. Open nodes are white, cut nodes are grey, and hidden nodes are black. (a) The initial cut shown in the context of the whole hierarchy. It has open metanodes A, C, and F. Metanodes B and G are in the cut, as are the leaves below F. The metanodes D and E are hidden, as are their leaves. (b) The initial cut as shown in the graph view. (c) After the selection, metanode B changes from cut to open and the two formerly hidden metanodes D and E become cut metanodes. The subgraph containing D and E is laid out and the size of B is updated. (d) The subgraph inside A is laid out, and the size of A is updated. (e) The metaedge to B is deleted and two edges to D and E are added. (f) The final cut, as a tree. The animated transition seen by the user is a linear interpolation between views (b) and (e). The intermediate stages of computation are not visible to the user.
proc ChangeCut (openedMetaNode) metanode = openedMetaNode while metanode != NULL InitialLayout(metanode) RemoveOverlaps(metanode) MinimizeCrossings(metanode) RecalcBoundingCircle(metanode) metanode ← metanode.parent RecomputeMetaEdges() Figure 3: Pseudocode for the ChangeCut algorithm.
a change in the size of its open metanode. We have more information about the space requirements at each level because this size estimate is further refined as metanodes inside are opened. At a leaf node, we have perfect information about the size required. After a layout event, the size of a metanode is changed, and the layout of each subgraph along the path between the metanode and the root is updated. This cascading relayout does not require recomputing layouts for any of the other nodes in the cut. The worst-case number of relayouts is thus O(d), where d is the maximum depth of the cut. When the hierarchy is close to balanced, this depth is logarithmic in the number of nodes. Moreover, the cut depth is small when exploration begins. The complexity of the entire relayout cascade depends on which features are present in the metanodes on the path, since the layout complexity for each metanode ranges from linear to cubic. After all nodes on the path up to the root are relaid out, we must delete the metaedges leaving from the parent metanode that is removed from the cut, and add new metaedges for the newly laid out nodes in the child subgraph that have been added to the cut. A metaedge exists between cut metanodes c The Eurographics Association 2007.
if there is an edge between leaves which they contain. We use an interactive refinement approach [AJ05] to compute these metaedges on the fly in linear time.
4.3. Minimizing Change During Relayout The relayout phase discussed above is one example of the dynamic or incremental layout problem, where we would like a new layout of a graph to be as close as possible to the old layout of a similar graph with node size and connectivity changes. For most of the algorithms, we can eliminate unnecessary change by preserving the order in which the nodes and edges of each child subgraph are processed. However, simply preserving order does not solve this problem with GEM force-directed placement. We seed the algorithm by using the old layout as a initial guess for the new one. This approach works well when the size change of the opened metanode is small, but the new layout might be quite different from the old when the sizes differ significantly, which is currently a limitation of our system.
4.4. Animating Transitions Opening a metanode can lead to size and position changes in many metanodes. It would be difficult to understand those changes if they were made abruptly. Grouse linearly interpolates the positions of the changed nodes from old to new locations while preserving containment relationships. During this transition, the sizes of the open metanodes are morphed as well. In the Figure 2 example, the animated transition changes the graph view from Figure 2(b) to Figure 2(e). The intermediate stages between these views are not shown in the animation.
D. Archambault, T. Munzner & D. Auber / Grouse: Feature-Based Steerable Graph Hierarchy Exploration
5. Results and Discussion We present several layouts showing stages in the steerable exploration process. The datasets are subsets of the Internet Movie Database (IMDB) in Figures 4, 5, and 6. We discuss the benefits of preserving the input hierarchy. We validate the Grouse approach by analyzing the information density of the resulting layouts, comparing scaling to relayout and force-directed layout to feature-based layout.
shows the feature-based layout of Grouse where appropriate algorithms are chosen for the type of topology present in the subgraph. With Grouse, it is easier to see the tree at the center of the drawing. We know that the cliques are actually complete graphs because the circular layout indicates it. In the force-directed drawing, the spatial layout does not provide such explicit cues. 6. Conclusion and Future Work
5.1. Steerable Exploration The input graph for Figure 5 is all the reachable movies in 1999 from the actor Sharon Stone. It has 7,640 nodes and 277,029 edges. In the left two columns, we show a sequence of snapshots of the graph view as metanodes are opened. In the final image on the right, the cut includes a large highlevel tree, containing a clique representing a movie in cyan near the bottom. The inset shows a close-up view of the clique with node labels. 5.2. Preserving Hierarchy Features In the IMDB datasets shown in Figures 4 and 5, cliques represent movies. If we allowed hierarchy modifications in the style of ASK-GraphView [AvHK06], movies with many actors would be split up between multiple metanodes, and thus difficult to recognize. In Grouse, these features are preserved and laid out in contiguous regions and depicted using a glyph. We can do this effectively since appropriate layout algorithms are used depending on the topological feature present in the subgraph. Our system shows the hierarchical structure above the cut explicitly by using containment. The bounding circles drawn below open metanodes help users to understand the hierarchical structure above the cut. 5.3. Scaling vs. Relayout Along Path In Grouse, we recompute part of the layout during exploration, at most d metanodes where d is the depth of the graph hierarchy. As the user steers the layout, our metanode size estimates improve and the cascading relayout propagates this information up toward the hierarchy root. This approach represents a quality-for-time tradeoff compared to the ASK-GraphView method, where layout of any subgraph only occurs once and it is scaled so that it fits into the open metanode on the previous level. Although the scaling approach is fast, major features can be difficult to perceive. Figure 4 compares these two approaches. In the scaling example of Figure 4(a), the cyan clique is much smaller than in the relayout example of Figure 4(b). Additionally, more levels are visible at a single scale in the drawing using our relayout technique. 5.4. Force-Directed vs. Feature-Based Layout Figure 6(a) shows a layout using only force-directed placement, as in previous work, compared to Figure 6(b) that
We have presented Grouse, a system for steerable, featurebased exploration of graph with associated hierarchies. As the user opens metanodes in the hierarchy to see an arbitrary cut, we only perform relayout computations for the metanodes on the path between the chosen one and the hierarchy root. The old layout morphs into the new with a smooth transition of metanode positions and sizes. Although this limited relayout requires additional computation than do previous approaches that simply rescale a fixed layout, it allows for more levels of the hierarchy to be seen at once. Moreover, the choice of using feature-based layouts means that in many cases the cost to lay out a metanode is low because we can avoid an expensive force-directed placement. Also, feature based layouts allow topological structures to be easily identified. Finally, we preserve the input hierarchy, which can be meaningful if the subgraphs contained within the metanodes correspond to features of interest for a user. An interesting direction for future work would be to incorporate a broader range of domain-specific features based on attributes associated with nodes and edges, beyond the topological features that we currently compute from the graph structure alone. We would also like to minimize change during our relayout process. One way would be to compute tighter estimates for metanode size. We could possibly exploit theoretical size bounds of the layout algorithm for the chosen feature. Another way would be to integrate a dynamic force-directed placement algorithm, such as that of Frishman and Tal, into our feature-based framework [FT07]. References [AJ05] AUBER D., J OURDAN F.: Interactive refinement of multiscale network clusterings. In Proc. 9th Int. Conf. on Information Visualisation (IV’05) (2005), pp. 703–709. [AKY04] A BELLO J., K OBOUROV S. G., Y USUFOV R.: Visualizing large graphs with compound-fisheye views and treemaps. In Proc. Graph Drawing (GD’04) (2004), vol. 3383 of LNCS, Springer-Verlag, pp. 431–441. [AMA05] A RCHAMBAULT D., M UNZNER T., AUBER D.: TopoLayout: Graph layout by topological features. In IEEE Information Visualization Posters Compendium (InfoVis’05) (2005), pp. 3–4. [AMA07] A RCHAMBAULT D., M UNZNER T., AUBER D.: TopoLayout: Graph layout by topological features. IEEE Trans. on Visualization and Computer Graphics 13, 2 (2007), 305–317. c The Eurographics Association 2007.
D. Archambault, T. Munzner & D. Auber / Grouse: Feature-Based Steerable Graph Hierarchy Exploration [DMS05] D WYER T., M ARRIOTT K., S TUCKEY P. J.: Fast node overlap removal. In Proc. Graph Drawing (GD’05) (2005), vol. 3843 of LNCS, Springer-Verlag, pp. 153–164. [EF96] E ADES P., F ENG Q.: Multilevel visualization of clustered graphs. In Proc. Graph Drawing (GD’96) (1996), vol. 1190 of LNCS, Springer-Verlag, pp. 101–112. [EH00] E ADES P., H UANG M. L.: Navigating clustered graphs using force-directed methods. Journal of Graph Algorithms and Applications 4, 3 (2000), 157–181. [FLM95] F RICK A., L UDWIG A., M EHLDAU H.: A fast adaptive layout algorithm for undirected graphs. In Proc. Graph Drawing (GD’94) (1995), vol. 894 of LNCS, pp. 388–403. [FT07] F RISHMAN Y., TAL A.: Online dynamic graph drawing. In Proc. Eurographics/IEEE VGTC Symp. on Visualization (EuroVis’07) (2007). To appear. (a) scale
[GADM04] G RIVET S., AUBER D., D OMENGER J., M ELAN CON G.: Bubble tree drawing algorithm. In International Conference on Computer Vision and Graphics (2004), pp. 633–641. [GK02] G AJER P., K OBOUROV S. G.: GRIP: Graph drawing with intelligent placement. Journal of Graph Algorithms and Applications 6, 3 (2002), 203–224. [GKN05] G ANSNER E., K OREN Y., N ORTH S.: Topological fisheye views for visualizing large graphs. IEEE Trans. on Visualization and Computer Graphics 11, 4 (2005), 457–468. [HJ04] H ACHUL S., J ÜNGER M.: Drawing large graphs with a potential-field-based multilevel algorithm. In Proc. Graph Drawing (GD’04) (2004), vol. 3383 of LNCS, Springer-Verlag, pp. 285–295. [HMM00] H ERMAN I., M ELANÇON G., M ARSHALL M. S.: Graph visualization and navigation in information visualization: A survey. IEEE Trans. on Visualization and Computer Graphics 6, 1 (2000), 24–43.
(b) relayout
Figure 4: We compare the number of levels of the hierarchy that can be seen at once. With scaling (a), it is difficult to see deep into the hierarchy. Using relayout (b), more levels are distinguishable. The dataset is a subset of IMDB of 1,181 nodes and 31,527 edges centered around Jake Gyllenhaal.
[Aub03] AUBER D.: Tulip : A huge graph visualization framework. In Graph Drawing Software, Mutzel P., Jünger M., (Eds.), Mathematics and Visualization. Springer-Verlag, 2003, pp. 105– 126. [AvHK06] A BELLO J., VAN H AM F., K RISHNAN N.: ASKGraphView: A large scale graph visualization system. IEEE Trans. on Visualization and Computer Graphics (Proc. Vis/InfoVis ’06) 12, 5 (2006), 669–676. [BJL02] B UCHHEIM C., J ÜNGER M., L EIPERT S.: Improving Walker’s algorithm to run in linear time. In Proc. Graph Drawing (GD’02) (2002), vol. 2528 of LNCS, Springer-Verlag, pp. 344– 353. c The Eurographics Association 2007.
[JKM03] JANKUN -K ELLY T. J., M A K.-L.: MoireGraphs: Radial focus+context visualization and interaction for graphs with visual nodes. In Proc. IEEE Symposium on Information Visualization (InfoVis’03) (2003), pp. 59–66. [KH02] K OREN Y., H AREL D.: Graph drawing by highdimensional embedding. In Proc. Graph Drawing (GD’02) (2002), vol. 2528 of LNCS, Springer-Verlag, pp. 207–219. [Mun98] M UNZNER T.: Drawing large graphs with H3Viewer and Site Manager. In Proc. Graph Drawing (GD’98) (1998), vol. 1547 of LNCS, Springer-Verlag, pp. 384–393. [S∗ 96] S CHAFFER D., ET AL .: Navigating hierarchically clustered networks through fisheye and full-zoom methods. ACM Trans. on Computer-Human Interaction (TOCHI) 3, 2 (1996), 162–188. [Sto06] S TONE M.: Color in information display. IEEE Visualization 2006 Course Notes. Available as http://www.stonesc.com/Vis06, Oct 2006. [vHvW04] VAN H AM F., VAN W IJK J.: Interactive visualization of small world graphs. In Proc. IEEE Symposium on Information Visualization (InfoVis’04) (2004), pp. 199–206. [Wal03] WALSHAW C.: A multilevel algorithm for force-directed graph drawing. Journal of Graph Algorithms 7, 3 (2003), 253– 285.
D. Archambault, T. Munzner & D. Auber / Grouse: Feature-Based Steerable Graph Hierarchy Exploration
(a)
(c)
(b)
(d)
Figure 5: Exploring an IMDB dataset of Sharon Stone movies from 1999, where the full input graph is 7,640 nodes and 277,029 edges. The left column shows snapshots of the graph view as the user explores by opening metanodes. On the right, the final cut includes one small and one large tree. The cyan clique of actors in the movie Anywhere but Here is shown in the inset. Labels have been turned on in the inset view, showing actor names.
(a)
(b)
Figure 6: A comparison of information density using force-directed layout with feature-based layout. (a) In the force-directed case, the leaf nodes in the cyan clique are so spread apart that they are tiny. (b) With feature-based layout, the clique leaves are far larger, as are the blue cut metanodes representing trees in the open metanode at the center.
c The Eurographics Association 2007.