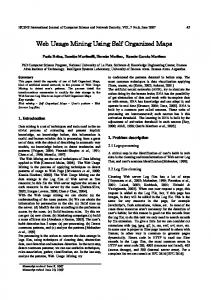
the top-most hierarchy level, A1 would contain exactly one. SOM. .... W3,10,2. W3,10,3. Fig. 2. The SOM hierarchy for the Online News Site. Fig. 3. The process flow of ... to many areas, such as global news, politics, technology, etc. In order to ...
Growing Hierarchical Self-Organizing Maps for Web Mining Joseph P. Herbert, JingTao Yao Department of Computer Science University of Regina, Regina, Canada, S4S 0A2 {herbertj, jtyao}@cs.uregina.ca
Abstract— Many information retrieval and machine learning methods have not evolved in order to be applied to the Web. Two main problems in applying some machine learning techniques for Web mining are the dynamic and ever-changing nature of Web data and the sheer size of possible dimensions that this data could portray. One such technique, self-organizing maps (SOMs), have been enhanced to deal with these two problems individually. The growing hierarchical self-organizing map can adapt to the dynamic data present on the Web by changing its topology according to the amount of change in input size. In addition, it reduces local dimensionality by splitting features into levels. We extend this model by including bidirectional update propagation over the levels of the hierarchy. We demonstrate the effectiveness of the new approach with a Web-based news coverage example.
I. I NTRODUCTION Knowledge discovery over the Web, or Web mining, is divided into three domains of study: Web content mining, Web usage mining, and Web structure mining [7]. These areas utilize many traditional information retrieval (IR) and data mining techniques [5], [9], [14] in the Web domain. Self-organizing maps (SOMs) [6] are an approach to discovering similar patterns found within vector data [4]. Used to cluster attribute data for pattern recognition, the SOM model has many configurable aspects to suit different applications. The self-organizing map is somewhat capable of performing knowledge discovery on the Web. Some SOM applications to Web content mining (deriving useful information from Web pages) include Web page and document clustering and document retrieval [2], [8]. A recommendation system using SOM clusters [15] is an application to Web usage mining (deriving information regarding a set of Web users’ characteristics). Although the above research has had some exposure, there are still problems that should be solved in order for the full potential of SOMs is realized. The first problem is the dynamic nature of Web data. In order to adequately classify data and give a low dimensional view of high dimensional data, the SOM must be trained on a finite data set that represents future data to be used. The growing self-organizing map, proposed by Villmann et al [13], analyzes the current collection of neurons and determines if dimensions are needed to be added or subtracted in order to improve the entire network’s ability to classify data.
The second problem facing SOMs is that of high dimensionality of features. The Web is a vastly immense collection of documents. It is near impossible to have input vectors that contain all possible features. Hierarchical self-organizing maps [12] is a different approach to reducing the search space. Classification is performed on a level-by-level basis. Seeing a need for an integrated approach, the growing hierarchical self-organizing map [1], [10] was proposed to take advantage of the benefits that the individual growing and hierarchical methods offered. However, it is unable to reflect changes to preserve the hierarchical relationships between levels. We extend this method by introducing bidirectional propagation of neuron updates over multiple hierarchy levels. This ensures that new information is correctly represented throughout the entire system. We look at how this approach is suitable for Web mining by looking at a Web-based news coverage example. II. W EB M INING M ODEL FOR S ELF -O RGANIZING M APS This section introduces new extensions to the growing hierarchical self-organizing map. The extensions incorporates previous ideas of growing SOMs and integrates them with a level-wise updatable hierarchical SOM model, or bidirectional propagation of updates. A. Feature Map Specification There are four total layers in the model, shown visually in Figure 1. Once input has been presented to the network through the Input Layer, a suitable level in the hierarchy of SOMs is found. That is, a level whose neurons have a collectively maximum similarity to the input. This SOM is then passed on to the Growth Layer which determines whether additional neurons need to be added or existing neurons need to be removed. Once a suitable neuron has been chosen, it is passed on to the Update Layer updates the corresponding neuron and its neighbourhood, as well as level-wise updates to parents and children within the hierarchy. A growing hierarchical SOM is formally defined as a set of hierarchy levels A = {A1 , . . . , At }, where Ai = {Wi,1 , . . . , Wi,m } is a set of SOMs. Let Wi,j = {w1 , . . . , wn } be a SOM with n neurons. For each wk ∈ Wi,j , it contains a storage unit sk and a weight vector vk . Therefore, each neuron has the structure wk = {vk , sk }. There are also three functions
B. Learning of Features through Bidirectional Propagation
Fig. 1. The growing hierarchical self-organizing map model for Web mining.
that are introduced. The Lev( ) function returns the hierarchy level that a SOM currently resides on. The functions Par( ) and Chd( ) take neurons as arguments are return the parent SOM and set of children SOMs respectively. Each hierarchy level A contains at least one SOM W . At the top-most hierarchy level, A1 would contain exactly one SOM. This map contains the absolute highest concept view of the entire hierarchical structure. The second hierarchy level, denoted A2 , potentially contains multiple SOMs. For example, let A2 = {W2,1 , W2,2 , W2,3 , W2,4 } be the second level in the hierarchy with four individual SOMs. Additional SOMs on subsequently lower hierarchies are denoted by the sequence of parent SOMs, i.e. W2,6,4 denotes that this map is the fourth such map on the third level of the hierarchy (A2 ) derived from the sixth map on the previous level. The hierarchical structure of the growing hierarchical SOM allows it to determine which feature map would best describe a relationship between a subset of inputs. Starting at the highest level in the hierarchy (root), we descend the structure to find a neuron whose weight vector is closest to the input vector. If the error rate is sufficient between the neurons and input at this level, we update the neuron and its neighborhood. We propagate the updates downwards and upwards in the hierarchy. However, if there exists a neuron a subsequent level that has a better error value, we should proceed to that level and start the process over again, finding a new neuron. We continue this process until we find the neuron whose weight vector has the lowest error between itself and the input. The growing methods allow the topology of a single feature map to change according to new information. The error rate ε is accumulated for a particular winning neuron. If it is above an upper-bound error threshold εu , there is an insufficient amount of neurons representing that concept in current feature map. Therefore, a neuron is added to the outer edge of the concept cluster, with weight vectors initialized accordingly. In contrast, if the measured error rate is below a lower-bound error threshold εl , a neuron may be removed from the network. The actual error rate measured from the winning neuron, εA , is defined as εl < εA < εu . If εA < εl , the SOM representation of input is an overfit. Likewise, if εu < εA , the SOM representation of input is an underfit. When calculating the error, the number of “victories” a neuron has achieved must be gathered. Additional storage for the number of victories it has achieved is requried. This enables the system to calculate the popularity of a particular cluster or concept area is within a SOM.
A SOM must be trained on a subset of data before the map is considered applicable. To find the neuron wi ∈ W that has a weight vector closest to pk , similarity measures [11] are observed between each neuron and the input vector. A neuron wi∗ is marked as the winner for input vector pk if it has the highest similarity value to the input vector. Once a winning neuron has been identified, its weight vector must be updated according to the learning rate α. The value of α decays over time according to an iteration q. This ensures that the system learns features quickly at the beginning of a session and progressively moves towards precise learning as training continues. This process is done by computing the Kohonen rule [6], shown in Equation (1), vi∗ (q) = vi∗ (q − 1) + α(pk (q) − vi∗ (q − 1)).
(1)
The weight vector for the winning neuron wi∗ (denoted by the asterisk) at iteration q is equal to the original weight vector at iteration (q − 1) plus the α-scaled difference between the current input vector pk and the original weight vector vk . The neighbourhood must then be updated. The neighbourhood set is calculated around wi∗ according to the decaying neighbourhood distance d. A modified learning rate α0 is used on the neurons within the neighbourhood set Ni∗ (d) [3], shown in Equation (2), vNi∗ (d) (q)
= vNi∗ (d) (q − 1) + α0(pk (q) − vNi∗ (d) (q − 1)).
(2)
Each neuron wi ∈ W has a neighbourhood Ni (d) associated with it, where each neuron’s proximity is within that defined by d, a scalar value that is changed according to an iteration q. For each neuron wi , the neighborhood Ni (d) = {wr , . . . , ws } consists of all neurons that have connectivity to wi within distance d. An iteration q is completed when all input vectors have been introduced to the competition layer, a neuron has been selected as the winner, and the update layer has completed. Utilizing ideas from both growing SOMs and hierarchical SOMs, we introduce extensions to the growing hierarchical SOM model suitable for Web Mining. With this model, highdimensional data prevalent throughout the Web are able to be abstracted through a hierarchy of SOMs that offer high-level views of feature subsets. The static training model from the traditional SOM model is done away with in preference to the dynamic nature of the growing SOM. A new definition of a neuron is used in order to provide links between hierarchies in a hierarchical SOM. For any given neuron on hierarchy A2 , there is a link to the parent hierarchy A1 and a link to the child hierarchy A3 . Let wi∗ ∈ Wj,k be the winning neuron for input k. To propagate updates to this neuron upwards in the hierarchical structure, we calculate Par(wi∗ )= Wj−1,m , where Lev(Wj−1,m ) < Lev(Wj,k ). For all neurons wa ∈ Wj−1,m that are similar to wi∗ , update the corresponding weight vectors,
W1
W2,1 W3,1,1
W3,1,2
···
W2,2 ···
W2,9
W3,1,5
W2,10 W3,10,1
Fig. 2.
W3,10,2
W3,10,3
The SOM hierarchy for the Online News Site.
III. W EB - BASED N EWS C OVERAGE E XAMPLE
Fig. 3.
The process flow of the Web mining self-organizing map model.
va∗ (q) = va∗ (q − 1) + β(pk (q) − va∗ (q − 1)).
(3)
To propagate updates downwards in the hierarchical structure, we calculate Chd(wi∗ )= A∗j+1 , where A∗j+1 ⊆ Aj+1 and j + 1 signifies the next level in the hierarchy succeeding level j. For all neurons wb ∈ Wj+1,t , where Wj+1,t ∈ A∗j+1 , update the corresponding weight vectors, vb∗ (q) = vb∗ (q − 1) + γ(pk (q) − vb∗ (q − 1)).
(4)
The learning rates β and γ are derived from a value of α. Generally, updates to a parent neuron on hierarchy level j − 1 are not as strong as updates to children neurons j + 1 for a given neuron on level j. The relationship β < α < γ allows for the propagation upwards and downwards to reflect the proper weight vector magnitude change. The process flow of the entire SOM model, which includes the sequential operation of the hierarchical and growing operations, is shown in Figure 3.
An example of how the extended growing hierarchical SOM model can be used for Web content mining is shown here. An online news site could make use of the hierarchical model to organize news articles in a logical way. A news site has the potential to push to the user thousands of articles pertaining to many areas, such as global news, politics, technology, etc. In order to use a SOM for this application, each news document is preprocessed into a vector format that can be presented to the feature map. Each component in the input vector is an indication of how frequent a particular word occurs in a news article. The term frequency (tf) measure is useful for this purpose. These input vectors contain information regarding the frequency of each word within the document. For example, an input vector pk = {c1 , c2 , c3 } has three components (keywords). Let us say the keywords {pharmaceutical, insurance, disease} are used to describe a Health-related news document. Therefore, c2 is a measure of how often the keyword insurance appears in document k. In general, component ci is a tf-measure of the ith keyword in news document k. At the top-most level in the hierarchy, news articles pertaining to high-level concepts are organized according to their features. The entire collection of documents on the online news site are presented through feature maps that abstract their similarities. They are organized as the following equations and presented as a hierarchy in Figure 2. A1 A2 A3
= {W1 }, = {{W2,1 }, {W2,2 }, {W2,3 }, {W2,4 }, {W2,5 }, {W2,6 }, {W2,7 }, {W2,8 }, {W2,9 }, {W2,10 }}, = {{W3,1,1 , W3,1,2 , W3,1,3 , W3,1,4 , W3,1,5 }, {W3,2,1 , W3,2,2 }, {W3,3,1 , W3,3,2 , W3,3,3 , W3,3,4 , W3,3,5 }, .. . {W3,10,1 , W3,10,2 , W3,10,3 }}, (5)
where W1 is the highest level map of the hierarchy, or Lev(W1 )= 1 . The individual maps W2,1 , · · · , W2,10 on the second hierarchy level A2 are Web documents pertaining to Global news, Local news, Politics, Business, Weather, Entertainment, Technology, Sports, Opinions, Health respectively.
These maps can be derived by taking a neuron wi ∈ W1 and executing Chd(wi ). Descending through the hierarchies to the third level A3 reveals more SOMs. These are derived from the previous higher level SOMs. The SOM set {W3,10,1 , W3,10,2 , W3,10,3 } contain individual SOMs relating to specific sub-areas within Health, the parent concept represented in W2,10 . To illustrate the results of the Par() and Chd() functions, let us look at a the hierarchy presented in Figure 2. For a neuron wi ∈ W2,1 , Par(wi )= W1 results in Lev(W1 ) < Lev(W2,1 ). Likewise, for a neuron wi ∈ W2,1 , we can execute Chd(wi )= {W3,1,1 , . . . , W3,1,5 }. If we let Ak = {W3,1,1 , . . . , W3,1,5 }, we have Ak ⊆ A3 , where Lev(W2,1 ) < Lev(W3,1,i ). The SOM W2,10 is presented in Figure 4. Clusters have been labeled to show relationships to lower levels. The maps W3,10,1 , W3,10,2 , and W3,10,3 are derived from their common parent map W2,10 . One of the key advantages of this hierarchical structure is that as we descend through the levels, more neurons are used to decrease the level of abstraction on a particular topic. The map shown expands on the previous 8 neurons and organizes documents with 90 neurons. We can see that more distinct similarities between documents can be expressed as we increase the number of neurons. That is, perhaps a subset of neurons in W2,10 relate to Health Research Funding, further expanded in map W3,10,1 . Additionally, the 26 neurons pointing to hierarchy map W3,10,2 pertain to Health Outbreak Crises articles.
Fig. 4. The feature map W2,10 of hierarchy A2 shown in Figure 2. Clusters with neurons that link to the next lowest level of the hierarchy are labeled.
When adding new articles, the input vector representation of the article would be compared first the top-most feature map using the tf-measures in the components. Descending through the tree until a similarity measure has been maximized results in finding the correct hierarchy to represent this document. The neurons in the feature map would be updated to reflect the addition of this article. For example, a new Health-related article describing a recent outbreak in a country has been received. Descending through our hierarchy, we find that it should have representation in the SOM W3,10,2 . The addition of neurons in W3,10,2 to better reflect this crisis is performed. This is shown by the addition of four neurons in the dashed area in Figure 4.
IV. C ONCLUSION The extended growing hierarchical self-organizing map model for Web mining introduced in this paper incorporates the previous approaches that can help in minimizing the impact of a training procedure and allowing for different levels of abstraction to reduce feature vector dimensionality. The Web-based news coverage example demonstrates the strengths of this approach. The hierarchical structure of SOMs can be used to classify Web documents with natural language by reducing dimensionality. In addition, the dynamic nature of Web data can cause the SOM to change its topology. The bidirectional propagation within this new approach allows for new information learned by an individual SOM to be reflected in other hierarchy levels. Update propagation upwards reflect how a parent SOM partially changes in view of a change in a child SOM. Propagation downwards reflect how children SOMs are more fully influenced by changes to a parent SOM. The extension of the growing hierarchical selforganizing map shown in this article is useful for the nextgeneration of Web-enabled systems. R EFERENCES [1] M. Dittenbach, A. Rauber, and D. Merkl, “Uncovering hierarchical structure in data using the growing hierarchical self-organizing map,” Neurocomputing, vol. 48, pp. 199–216, 2002. [2] A. Georgakis, C. Kotropoulos, A. Xafopoulos, and I. Pitas, “Marginal median som for document organization and retrieval,” Neural Networks, vol. 17, pp. 365–377, 2004. [3] J. Herbert and J. T. Yao, “A game-theoretic approach to competitive learning in self-organizing maps,” in International Conference on Natural Computation, vol. 1, 2005, pp. 129–138, LNCS 3610. [4] T. L. Huntsberger and P. Ajjimarangsee, “Parallel self-organizing feature maps for unsupervised pattern recognition,” International Journal of General Systems, vol. 16, no. 4, pp. 357–372, 1990. [5] V. Kecman, Learning and Soft Computing, Support Vector Machines, Neural Networks and Fuzzy Logic Models. The MIT Press, 2001. [6] T. Kohonen, “Automatic formation of topological maps of patterns in a self-organizing system,” in Proceedings of the Scandinavian Conference on Image Analysis, 1981, pp. 214–220. [7] R. Kosala and H. Blockeel, “Web mining research: A survey,” SIGKDD Explorations, vol. 2, no. 1, pp. 1–15, 2000. [8] K. Lagus, T. Honkela, S. Kaski, and T. Kohonen, “Websom for textual data mining,” Artificial Intelligence Review, vol. 13, no. 5-6, pp. 345– 364, 1999. [9] L. Ramirez, N. G. Durdle, V. J. Raso, and D. L. Hill, “A support vector machines classifier to assess the severity of idiopathic scoliosis from surface topography,” IEEE Transactions on Information Technology in Biomedicine, vol. 10, no. 1, pp. 84–91, 2006. [10] A. Rauber, D. Merkl, and M. Dittenbach, “The growing hierarchical selforganizing map: Exploratory analysis of high-dimensional data,” IEEE Transactions on Neural Networks, vol. 13, no. 6, pp. 1331–1341, 2002. [11] S. Santini and R. Jain, “Similarity measures,” IEEE Transactions: Pattern Analysis and Machine Intelligence, vol. 21, no. 9, pp. 871–883, 1999. [12] P. N. Suganthan, “Hierarchical overlapped som’s for pattern classification,” IEEE Transactions on Neural Networks, vol. 10, no. 1, pp. 193– 196, 1999. [13] T. Villmann and H. Bauer, “Applications of the growing self-organizing map,” Neurocomputing, vol. 21, pp. 91–100, 1998. [14] L. P. Wang and X. J. Fu, Data Mining with Computational Intelligence. Springer, 2005. [15] X. Z. Wang, A. Abraham, and K. A. Smith, “Intelligent web traffic mining and analysis,” Journal Of Network And Computer Applications, vol. 28, no. 2, pp. 147–165, 2005.