Feb 19, 2006 - SCALE: An integer value used to express the rest of the graph parameters. The .... Computing (HiPC 2005), Goa, India, December 2005.
GTgraph: A Synthetic Graph Generator Suite David A. Bader Kamesh Madduri College of Computing Georgia Institute of Technology, Atlanta GA 30332 {bader,kamesh}@cc.gatech.edu February 19, 2006 Abstract This document details the characteristics, input parameters and suggested usage of the three graph generators included in this suite.
1
SSCA#2 graph generator
This generator produces graphs used in the DARPA HPCS SSCA#2 benchmark [1]. The SSCA#2 graph is directed with integer edge weights, and made up of random-sized cliques, with a hierarchical inter-clique distribution of edges based on a distance metric. An SSCA#2 clique is defined as a maximal set of vertices, where each pair of vertices is connected by directed edges in one or both directions. The following parameters can be specified by the user. The default values of each parameter are also given below. • SCALE: An integer value used to express the rest of the graph parameters. The problem size can be increased by increasing the value of SCALE. • TotVertices: The number of vertices (2SCALE ) • MaxCliqueSize: The maximum number of vertices in a clique. Clique sizes are distributed uniformly on [1, MaxCliqueSize] ([2SCALE/3.0]) • ProbUnidirectional: Probability that the connections between two vertices will be unidirectional as opposed to bidirectional (0.2) • MaxParallelEdges: The maximum number of parallel edges from one vertex to another. The actual number is distributed uniformly on [1, MaxParallelEdges] (3) • ProbIntercliqueEdges: Initial probability of an interclique edges (0.5) • MaxIntWeight: Maximum value of integer edge weight. The weights are distributed uniformly on [1, MaxIntWeight] (2SCALE ) For a detailed description of the intra- and inter-clique edge generation algorithms, refer [1]. 1
Usage % GTgraph-ssca2 [-options] -s ### SCALE value (integer) to use (default -- 20) -c ### config file to use -o ### output file to write the graph to (default -- sample.gr) -h display this message In case of all the graph generators, the user can specify the key input parameter (for instance, SCALE in this case) as a command line argument and the rest of the parameters if needed in a config file (using the -c option as given above).
2
Random graph generators
We include two random graph generators in this package. 1. an Erd˝os-R´enyi graph generator which takes as input arguments the number of vertices, and the constant probability of an edge between any pair of vertices in the graph. 2. a random graph generator which takes as input the number of vertices (n) and edges (m), and adds m edges randomly choosing a pair of vertices each time. There is a possibility of adding multiple edges between a pair of vertices in this case. Self loops are not allowed by default, but this can be changed by modifying the appropriate option in the config file.
Usage % GTgraph-random [-options] -c ### config file to use -t ### Specify random graph model to use (0 for Erdos-Renyi G(n, p), 1 for G(n, m), default 1) -n ### -p ### parameters for Erdos-Renyi (default -- n:10^7, p:10^-6) -n ### -m ### parameters for G(n, m) (default -- n:10^7, m:10^8) -o ### output file to write the graph to -h display this message
3
Power-law graphs: R-MAT
To generate graphs with power-law degree distributions and small-world characteristics, we apply the Recursive Matrix (R-MAT) graph model discussed in [2]. This is a simple model with just four parameters a, b, c and d. Consider the adjacency matrix representation A of the graph – assume that each element aij in A is non-zero if there exists a directed edge from vertex i to j. Given the number of vertices n and the number of edges m, we start off with an empty nxn adjacency matrix A, recursively subdivide the adjacency matrix into four equal-sized partitions, and distribute edges within these partitions with a set of unequal probabilities. Each edge chooses one of the four partitions with probabilities a, b, c and d 2
respectively, and a + b + c + d = 1. Note that there can be multiple edges between two vertices using this algorithm. The parameters a, b, c and d can be determined based on the required community structure and degree distribution, as detailed in [2]. The authors conjecture that a : b and a : c ratios are approximately 3 : 1 in many real world graphs, and also that a ≥ d. Accordingly, we use default values of 0.45, 0.15, 0.15 and 0.25 for these parameters.
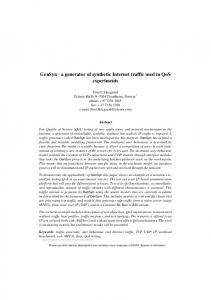
Usage % GTgraph-rmat [-options] -c ### config file to use -n ### no. of vertices (default -- 10^7) -m ### no. of edges (default -- 10^8) -o ### output file to write the graph to -h display this message Use the config file option to specify custom values of a, b, c and d. Fig. 1 gives is a log-log plot of the degree distributions (out degree vs. frequency) of the three generators for graph instances of nearly similar size (approximately 100 million vertices, 700 million edges). Clearly, the three generators exhibit contrasting degree distributions and should be interesting case studies for evaluating shortest path implementations. The edge weights are assumed to be randomly generated integers in all cases, but the generators can be trivially modified to consider other weight distributions also. With the default parameters, all three generators would produce graphs of relatively low diameter. However, by appropriately varying the input parameters (for instance, the MaxCliqueSize value in the SSCA#2), it is possible to generate high diameter graphs.
References [1] D.A. Bader and K. Madduri. Design and implementation of the HPCS graph analysis benchmark on symmetric multiprocessors. In Proc. 12th Int’l Conf. on High Performance Computing (HiPC 2005), Goa, India, December 2005. Springer-Verlag. [2] D. Chakrabarti, Y. Zhan, and C. Faloutsos. R-MAT: A recursive model for graph mining. In Proc. 4th SIAM Intl. Conf. on Data Mining, Florida, USA, April 2004.
3
Figure 1: Degree distributions of the three graph generators
4