Hands-on Statistical Process Control. In the Classroom. Southwest Center for. Microsystems Education. -SCME-. Dr. Matthias W. Pleil. See www.scme-nm.org for ...
Hands-on Statistical Process Control In the Classroom Southwest Center for Microsystems Education -SCMEDr. Matthias W. Pleil See www.scme-nm.org for more!
The work presented was funded in part by the Na5onal Science Founda5on Advanced Technology Educa5on program, Department of Undergraduate Educa5on grant: DUE 1205138
SCME is a Na*onal Science Founda*on Advanced Technological Educa*on (ATE) Program at the University of New Mexico. We offer professional development and educa*onal materials to excite and engage high school, community college and university students in the field of Microsystems (MEMS) technology. Support for this work was provided by the Na*onal Science Founda*on's Advanced Technological Educa*on (ATE) Program DUE #1205138 SEM of Loop and Hinge System Courtesy of Sandia Na5onal Laboratories www.scme-‐nm.org
Outline • What is SPC and why would we care? • Founda*onal Sta*s*cal Stuff – Mean, Median, range, Variance/Sigma, Distribu*ons
• Control Charts – UCL, LCL – WECO rules
• Measurement Systems • SCME Materials Available!
Volunteers! • During the presenta*on…. – Take 10 resistance measurements of a single pencil lead and write each down – Determine Average – Determine range – Determine variance (sigma) – Pass it on to another to repeat
Why do we need (SPC) Sta*s*cal Process Control?
Quality Product
Biochip slide for tes/ng protein arrays [Image courtesy of Argonne Na/onal Laboratories]
Drug-‐elu5ng Stent by Taxus [Image provided by the FDA]
Sta*s*cal Process Control (SPC) SPC is about “control”.
Process Varia*on
Target
Inherent or Common Cause Varia*on
Special Cause Varia*on Tracking Your Gas Mileage Common cause varia*on 33 mpg Target MPG
30 mpg 27 mpg Special Cause Varia*on Time
Special Cause Variability Process Steps: 1. Silicon Nitride Deposi*on 2. Lithography for chamber 3. Lithography for sensing circuit 4. Metal deposi*on for circuit 5. Metal Removal 6. Etch reference chamber
How do you track all of these sources of variability and detect special causes?
Types of data • Variable Data – Data Based upon measurements – Length, *me, weight, temperature, pressure, film thickness
• Agribute Data – Data based upon counts (discrete) – Either there or not – Number of defects, acceptable or unacceptable 33 mpg
Target MPG
30 mpg 27 mpg Time
Variability Photoresist Thickness Machine#1
Machine#2 1.1 µm
1.0 µm
0.9 µm
Time
Variability Photoresist Thickness
1.1 µm
1.0 µm
0.9 µm
Time
Variability Photoresist Thickness Out of Control Scenario Day#1
Day#2 1.1 µm
1.0 µm
0.9 µm
Time
Common Cause Varia*on Controlled Varia*on
Special Cause Varia*on Uncontrolled Varia*on
Another Example Process Temperature Out of Control Scenario
Time
Desired Varia*on
Can you think of a product where significant varia*on is acceptable?
Desired Varia*on
Can you think of a product where significant varia*on is acceptable?
Varia*on in Microsystems Hinge System
[Image courtesy of Sandia National Laboratories]
Sta*s*cal Process Control and Varia*on – When to Respond?
Upper Control Limit
Centerline
Lower Control Limit
Communica*on is KEY! Operators
Management
Communica6on
Engineers
Technicians
Sta*s*cs for Sta*s*cal Process Control • Sta*s*cs for Central Tendency – Sample Median – Sample Mean
• Sta*s*cs for Variability – Sample Range – Sample Variance – Sample Standard Devia*on
Sample Median – Central Tendency Sample Median – Represents the data value that is “physically” in the middle of the sample set when arranged in numerical order. Example: – Given the data set: 2,4,1,5,3 – Order the data: 1,2,3,4,5
– Ques6on: What is the Median?
Sample Median – Central Tendency Sample Median – Represents the data value that is “physically” in the middle of the sample set when arranged in numerical order. Example: – Given the data set: 2, 4, 1, 5, 3 – Order the data: 1,2,3,4,5 Example: – Given the data set: 2, 4 ,1, 5, 1 ,3 – Order the data: 1, 1, 2, 3, 4, 5 – Median is the average of the 2 middle #’s: 2 and 3 – Median = 2.5
Sample Mean – Central Tendency Mean • Universal or Arithme*c Mean = µ • Sample Mean = X • Mean of a collec*on of sample Means = X
Σ!! != !
Calcula*on of Mean 5 Resist Thickness Values: 2.87, 2.99, 3.01, 3.15, 2.98 Microns
µ ~ X = 2.87 + 2.99+ 3.01+ 3.15 + 2.98 = 3.00 microns 5
Sample Mean
What is X ?
Wafer� 2.48 3.23 2.99 3.09 1.90 4.82 2.74 4.16 4.54 2.11 Wafer #1 Sample Mean
X = 3.48 microns
Wafer� Wafer� 3.43 3.74 X 4.29 2.01 1.95 1.58 4.55 4.89 2.37 1.38 Wafer #2 Sample Mean Wafer #3 Sample Mean
X = 3.32 microns
X = 3.48 + 3.32 + 2.72 + 2.49 = 3.00 microns 4
X = 2.72 microns
Wafer#4 2.52 2.49 1.68 4.18 1.61 Wafer #4 Sample Mean
X = 2.49 microns
Sample Range Sta*s*cs for Variability Sta*s*cs for Variability – Sample Range – Sample Variance – Sample Standard Devia*on
• Sample Range – The difference between the maximum value minus the minimum value. 2.87, 2.99, 3.01, 3.15, 2.98
Ques6on – What is the Sample Range?
Sample Range Sta*s*cs for Variability Sta*s*cs for Variability – Sample Range – Sample Variance – Sample Standard Devia*on
• Sample Range – The difference between the maximum value minus the minimum value. 2.87, 2.99, 3.01, 3.15, 2.98
3.15 – 2.87 = 0.28 Sample Range
Sample Variance Sta*s*cs for Variability • Sample Variance – How far a set of numbers are spread out.
!! =
! !!! (!!
− !)! !−1
• 5 Resist Thickness Values: 2.87, 2.99, 3.01, 3.15, 2.98 microns • Mean = 3.00 micros
• σ2 = 0.01 Square Microns
Sample Standard Devia*on Sta*s*cs for Variability • Sample Standard Devia5on – Measurement of how the data are distributed around the sample mean and within a range of values.
!=
!! =
– σ2 = 0.01 micron2 – σ = 0.1 micron
! !!! (!!
− !)! !−1
Let’s Have Fun with Control Charts! X -‐Chart Upper Control Limit
X Centerline (Target)
Lower Control Limit
Normal Distribu*on
σ
σ
σ
σ
σ
σ
Control Chart Basics X -‐Chart
Upper Control Limit
µ + 3σ
µ + 2σ
µ + 1σ
Target
X
µ - 1σ µ - 2σ
µ - 3σ Lower Control Limit
Control Chart Basics • X axis is *me based – enter data as it is collected (why?) • Monitors process to detect special cause varia*on and manage common cause varia*on • Common Cause Varia*on – Due to room temperature change – Line personnel
• Special Cause Varia*on – Changes in process – Unexpected events – Change in vendors of a product ingredient – Leaks in a vacuum line
! Upper"Control"Limit"
µ + 3σ ! µ + 2σ! µ + 1σ! Centerline"
µ
1σ
µ
2σ !
µ
3σ
X"
Lower"Control"Limit"
Control Chart Basics X -‐Chart
Control Chart Basics X -‐Chart
UCL
µ + 3σ
Target
LCL
µ - 3σ
X
Control Chart Basics X or µ
= 3.00 microns σ
= 0.1 microns
X -‐Chart
UCL
µ + 3σ
3 + (3*0.1)= 3.03
Target = 3.00
X
LCL
µ - 3σ
3 - (3*0.1)= 2.97
Control Chart Basics X or µ
= 3.00 microns σ
= 0.1 microns
X -‐Chart
UCL
µ + 3σ
3 + (3*0.1)= 3.03
µ + 2σ
µ + 1σ
Target = 3.00
X
µ - 1σ µ - 2σ
LCL
µ - 3σ
3 - (3*0.1)= 2.97
Control Chart Basics X or µ
= 3.00 microns σ
= 0.1 microns
X -‐Chart
UCL
µ + 3σ
3 + (3*0.1)= 3.03
µ + 2σ
µ + 1σ
Target = 3.00
X
µ - 1σ µ - 2σ
LCL
µ - 3σ
3 - (3*0.1)= 2.97
Control Chart Basics X or µ
= 3.00 microns σ
= 0.1 microns
X -‐Chart
UCL
µ + 3σ
3 + (3*0.1)= 3.03
µ + 2σ
µ + 1σ
Target = 3.00
X
µ - 1σ µ - 2σ
LCL
µ - 3σ
3 - (3*0.1)= 2.97
Control Chart Basics Average
UCL, LCL Determined from historical data
Shewhart Rules
aka Western Electric Rules (WECO) 8 Rules to Signal an Out of Control Process – Developed by a Western Electric Engineer – Walter Shewhart • • • • • • • •
Rule 1: A single point outside the μ±3σ zone. Rule 2: Two out of three successive points outside μ±2σ zone. Rule 3: Four out of five successive points outside μ±1σ zone. Rule 4: Eight or more successive numbers either strictly above or strictly below the mean (the center). Rule 5: Six or more successive numbers showing a con*nuous increase or con*nuous decrease. Rule 6: Fourteen or more successive numbers that oscillate in size (i.e. smaller, larger, smaller, larger) Rule 7: Eight or more successive numbers that avoid μ±1σ zone. Rule 8: Fiteen successive points fall into μ±1σ zone only, to either side of the centerline.
A B C C B A
Shewhart Rules – Rule #1
Rule 1: The existence of a number that is not in any of the zones labeled A, B, and C. (See special, encircled point above.) This would be a single point outside the μ±3σ zone.
A B C C B A
Shewhart Rules – Rule #2
Rule 2: Two out of three successive numbers in a zone A or beyond (by beyond we mean away from the mean). This would be two out of three successive points outside μ±2σ zone.
A B C C B A
Shewhart Rules – Rule #3
Rule 3: Four out of five successive numbers in a zone B or beyond. This would be four out of five successive points outside μ±1σ zone.
Shewhart Rules – Rule #4
A B C C B A
Rule 4: Eight or more successive numbers either strictly above or strictly below the mean (the center).
A B C C B A
Shewhart Rules – Rule #5
Rule 5: Six or more successive numbers showing a con*nuous increase or con*nuous decrease.
Shewhart Rules – Rule #6
A B C C B A
Rule 6: Fourteen or more successive numbers that oscillate in size (i.e. smaller, larger, smaller, larger)
Shewhart Rules – Rule #7 A B C C B A
Rule 7: Eight or more successive numbers that avoid zone C.
Shewhart Rules – Rule #8
A B C C B A
Rule 8: Fiteen successive points fall into zone C only, to either side of the centerline.
Type I and Type II Response Errors • 2 Types of Errors: Type I and Type II • Type I – False Alarm – Decision rules lead you to decide that special cause varia*on is present when in fact it is not present.
• Type II – Miss – Decision rules lead you not to decide that special cause varia*on is present when in fact it is present. SPC Rules help you avoid these errors!
Ques*on: Let’s test the rules Rule 1: A single point outside the μ±3σ zone. Rule 2: Two out of three successive points outside μ±2σ zone. Rule 3: Four out of five successive points outside μ±1σ zone. Rule 4: 8 or more successive numbers either strictly above or strictly below the mean.
Rule 5: 6 or more successive numbers showing a con*nuous increase or con*nuous decrease.
Rule 6: 14 or more successive numbers that oscillate in size (i.e. smaller, larger, smaller, larger) Rule 7: 8 or more successive numbers that avoid μ±1σ zone. Rule 8: 15 successive points fall into μ±1σ zone only, to either side of the centerline or target.
Ques*on: Let’s test the rules Rule 1: A single point outside the μ±3σ zone. Rule 2: Two out of three successive points outside μ±2σ zone. Rule 3: Four out of five successive points outside μ±1σ zone. Rule 4: 8 or more successive numbers either strictly above or strictly below the mean. Rule 6: 14 or more successive numbers that oscillate in size (i.e. smaller, larger, smaller, larger) Rule 7: 8 or more successive numbers that avoid μ±1σ zone. Rule 8: 15 successive points fall into μ±1σ zone only, to either side of the centerline or target.
Process Changes -‐ Shit Shit – When the data starts to center around a different mean or center line. 3σ -‐ UCL
Centerline or Target
New mean of shited data
3σ -‐ LCL
Process Changes -‐ Trend Trend – When the process mean begins to gradually move in one direc*on.
or Target
Process Changes -‐ Cycle Cycle – When the data begins to increase or decrease in a cyclical or repe**ve manner.
or Target
We are OOC, Now what?
Out of Control Ac*on Plan -‐ OCAP You are a technician in the photolithography aisle of a local MEMS fabrica*on facility. Ater randomly tes*ng several wafers from the last processing batch and ploung the data on a control chart, you iden*fy an out-‐ of-‐control situa*on with resist thickness.
Photoresist Too Thick?
Run a boat of test wafers, re-‐measure, plot.
3σ 2σ 1σ
UCL Photoresist Thickness
Target 1σ 2σ 3σ
Too thick?
LCL
Yes Put DOWN the Machine and TS the problem Release the machine for produc*on and determine the cause of No the out-‐of-‐control situa*on
Out of Control Ac*on Plan -‐ OCAP Photoresist Too Thick?
Run a boat of test wafers
Too thick?
Yes Put DOWN the Machine and TS the problem Release the machine for produc*on and determine the cause of No the out-‐of-‐control situa*on
Recognize the a Problem Exists
Evaluate Possible Causes
Analyze the Problem
Develop an Ac6on Plan
Iden6fy Possible Causes
Verify and Record
Data Collec*on/Analysis Plan Start A Take 5 temperature measurements during the process
Average the 5 run temperatures to get an X-‐bar value Plot the X-‐bar value on the chart
Is your NO process in control? YES Process is In control!
Analyze the process for the out of control data point. (Look at methods, equipment, people, materials, environment) Determine the cause of the out of control data point. Correct the cause
A
Control Limits are NOT Specifica*on Limits • Control Chart Centerline – Derived from real-‐*me process data
• Control Limits – Derived from real-‐*me process data
• Specifica*on Limits (Spec Limits) – Boundaries that a product is acceptable or not acceptable – based on customer requirements.
• Just because a process is in sta*s*cal control does not mean it is always within spec and vise versa • SPC has to do with process predictability • Process Specifica*on Limits have to do with the process capability • General Rule: Do not put Specifica*on Limits in a control chart!
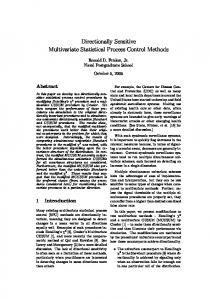
EXAMPLE – SiO2 Growth • Silicon Dioxide Growth for a Sacrificial Layer on a MEMS device • Specifica*on states that the Average Run Temperature (X) should be 1000°C ± 10°C Image courtesy of UNM MTTC
[Image courtesy of Sandia Na5onal Laboratories] !
[Image courtesy of Sandia National Laboratories]
X -‐Chart for SiO2 Growth
σ = 3.77 °C
µ + 3σ = 1004 + (3*3.77) = 1015°C µ - 3σ = 1004 - (3*3.77) = 993°C
UCL
µ + 3σ = 1015°C
Target = 1004°C
LCL
µ - 3σ = 993°C
X -‐Chart for SiO2 Growth Management has determined that this process should be monitored for only the following 4 Shewhart Rules: Rule 1: A single point outside the μ±3σ zone. Rule 2: Two out of three successive points outside μ±2σ zone. Rule 4: 8 or more successive numbers either strictly above or strictly below the mean. Rule 5: 6 or more successive numbers showing a con*nuous increase or con*nuous decrease.
Run$#9 992 989 987 994 990
X -‐Chart for SiO2 Growth Run$#10 992 993 995 994 994
UCL
µ + 3σ = 1015°C
Target = 1004°C
LCL
µ - 3σ = 993°C
X -‐Chart for SiO2 Growth
Rule 1: A single point outside the μ±3σ zone. Rule 2: Two out of three successive points outside μ±2σ zone. Rule 4: 8 or more successive numbers either strictly above or strictly below the mean. Rule 5: 6 or more successive numbers showing a con*nuous increase or con*nuous decrease.
UCL
µ + 3σ = 1015°C
Target = 1004°C
LCL
µ - 3σ = 993°C
990°C
X -‐Chart for SiO2 Growth
Rule 1: A single point outside the μ±3σ zone. Rule 2: 2 out of three successive points outside μ±2σ zone. Rule 4: 8 or more successive numbers either strictly above or strictly below the mean. Rule 5: 6 or more successive numbers showing a con*nuous increase or con*nuous decrease.
UCL
µ + 3σ = 1015°C
Target = 1004°C
LCL
µ - 3σ = 993°C
Other types of Charts • • • • • •
X and R chart X and s chart p-‐Chart and np-‐chart (defec*ves) U and c charts (defects) Individuals Chart Exponen*ally Weighted Moving Average (EWMA) Chart
X-‐bar R charts for Film Thickness UCL Target LCL
UCL Mean
Process Performance -‐ Pp, Ppk • Is the process capable of delivering a consistent product – one that is in specifica*on 99.9% of the *me? • Process Performance: Pp = (USL-‐LSL)/6σ • Process Performance Index: Ppk = (USL-‐μ)/3σ, (LSL-‐μ)/3σ è the lesser of the two. • What’s the difference?
Difference between the two? • Process Performance: Pp = (USL-‐LSL)/6σ • Process Performance Index: Ppk = (USL-‐ μ)/3σ, (LSL-‐μ)/3σ è the lesser of the two.
The second one takes into account how well your are running to target… Think about it.
Process Capability
• Cp, Cpk is what is typically used in industry. • Same as Pp and Ppk EXCEPT the way you calculate sigma. In industry, we don’t measure everything, but samples. So… if we measure 5 sites/wafer and 2 wafers per run (lot)…. We have to use a different way. – We use the within sub-‐group standard devia*on to es*mate the
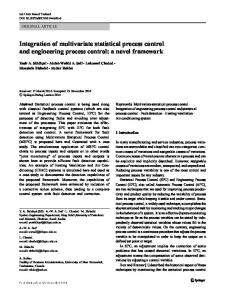
Cp Cpk – Some Details Individual(Vs(Average((n=3)( Same(Measurement(System(&(Sample( 104.15' 104.10'
Resistnce((Ohms)(
104.05' 104.00' 103.95' 103.90' 103.85' 103.80' 103.75' 103.70' 103.65' 1' 2'
3'
4'
5' 6'
7'
8'
9' 10' 11' 12' 13' 14' 15' 16' 17' 18' 19' Measurement( Ave'3'Meas'
Meter'A'(11040568)'
Cpk > 1.33 is capable Cpk > 1.66 is very capable, Oten for 27'cri*cal 20' 21' 22'required 23' 24' 25' 26' 28' 29' 30' Parameters.
Why d2 Individual(Vs(Average((n=3)( Same(Measurement(System(&(Sample( 104.15' 104.10'
Resistnce((Ohms)(
104.05' 104.00' 103.95' 103.90' 103.85' 103.80' 103.75' 103.70' 103.65' 1' 2'
3'
4'
5' 6'
7'
8'
9' 10' 11' 12' 13' 14' 15' 16' 17' 18' 19' 20' 21' 22' 23' 24' 25' 26' 27' 28' 29' 30' Measurement( Ave'3'Meas'
Meter'A'(11040568)'
SPC Tools • Manufacturing SPC Tools – – allows one to apply rules to easily determine if your process is capable to produce quality products for your customer in the future. – Determine when you have a problem as soon as it is sta*s*cally significant. – Keeps you from driving varia*on by “turning the knob” too oten
Sources of Varia*on • • • •
Machine parameters Materials People (procedures) Measurement Systems!
So… Tell me what you found? • Average? • Sigma? • Range? • Is this a good method for measuring pencil leads or not? • Is the measurement gauge adequate?
My Class Data Total'Popula9on'of'Measurements' Frequency' Number''of'Measurements'
30" 25" 20" 15" 10" 5" 0" 103.50"
103.60"
103.70"
103.80"
103.90"
Bin'1'Value'Range'
104.00"
104.10"
104.20"
Different Meters
25"
Individual)Meter)Frequency)
20" 15" meter"A" 10"
meter"B" meter"C"
5" 0" 103.50"
103.60"
103.70"
103.80"
103.90"
104.00"
104.10"
104.20"
Summary • SPC is a sta*s*cal scien*fic method that provides valuable informa*on about a process • They type of varia*on (common and special cause) should be understood and controlled. • Sta*s*cal Concepts used in SPC – Sample median – Sample mean – µ, X, X – Sample range -‐ R – Sample variance – σ2 – Sample standard devia*on – σ
Summary cont. • Most process data follows a Normal Distribu*on • Process Performance and Process Capability are key quality tools • Shewhart or Western Electric Rules can be used to determine if a process goes out of control • Don’t forget about the measurement system – it contributes to the varia*on of the measurement process.
Resources • www.scme-‐nm.org -‐ Download the SPC Learning Module: – – – – – –
Sta*s*cal Process Control Knowledge Probe (KP) Pre-‐test SPC PK#1: Introduc*on to Sta*s*cal Process Control (PK) SPC PK#2: Control Chart Basics (PK) Ac*vity: Hands-‐on SPC Resistance Measurement Ac*vity Ac*vity: SPC MEMS Applica*on Ac*vity – SiO2 Thickness Sta*s*cal Process Control Assessment
• Book: “EZ SPC” by Ralph Celone & Ronald Buckley