Haptic Comparison of Size (Relative Magnitude) in Blind and Sighted People Sarah A. Douglas and Shasta Willson Computer & Information Science Department, University of Oregon Eugene, Oregon U.S.A. 1-541-346-3974
[email protected]
ABSTRACT
1. INTRODUCTION
Applications for blind users often involve the mapping of information such as size (magnitude) from one sensory domain (vision) onto another (sound or touch). For example, visual perception of length can be estimated directly by touch, or encoded to pitch or even vibration. Applications for blind users will benefit from fundamental research into human perception of computergenerated substitutions for vision. In this paper we present the results of a haptics-only experiment with the PHANToM that measures human performance (time and accuracy) judging relative magnitude with computer generated haptic properties. Magnitude was represented by either physical length (displacement), or vibration varied by frequency or amplitude. Eleven blind and eleven blindfolded sighted individuals participated. Displacement tasks were 50% slower than vibration conditions for all participants. Accuracy for displacement and vibration varied by amplitude was equivalent. Vibration varied by frequency was significantly less accurate, although we are cautious about the reliability of those results. Blind participants took 50% longer with equivalent accuracy to sighted participants. Sightedness had no effect on performance regarding the type of display. No other interaction effects were found. These results suggest that vibration varied by amplitude provides a faster and equally accurate display of magnitude compared with the traditional displacement approach. Secondly, the same coding benefits equally well visually disabled and sighted individuals.
Human vision is the primary modality for human-computer interaction, whether for application program display or graphical user interfaces. Access for people with visual impairment becomes a primary concern when non-text visual aspects of the display become primary. However, the human perceptual system has other modalities that offer substitutions or even potential advantages. During the past twenty years hearing has been extensively explored using sonification as an augmentation or even substitute for graphical display. Recently tactile and kinesthetic perception have been considered viable modalities with the development of haptic devices, such as the force-feedback mouse, force-feedback glove, and 3DOF or even 6DOF force feedback devices such as the Sensable PHANToM. Haptics is an important development for human-computer interaction since most haptic devices are unique I/O devices having 3-D manipulatory ability in addition to tactile and kinesthetic display. Combined with sound, haptics can create a viable alternative interface for blind and visually impaired people. Such computer environments may even offer advantages over other technologies such as traditional tactile diagrams. The work of Yu, Ramloll and Brewster illustrates careful, thoughtful work in developing multimodal (haptics + sound) computer applications for line graphs and bar charts as substitutes for tactile diagrams for blind students [25, 29, 30]. Their work on bar charts illustrates a classic set of problems in substituting other modalities for vision [29]. For example, in a graphic display a visual glance can easily compare the height of bars. How do we substitute effective modalities of sound and touch for this size comparison task? Yu et al. chose to map the pitch of a MIDI note (sound) to height of the bar. Users then gain an overall impression of bar heights by moving the haptic pointer across all bars on the chart. Individual bar height could also be obtained by physical displacement or “touching”, since each bar was coded haptically as a vertical concave engraved surface. In this particular application, blind users ignored the possibility of size comparison by “touch”, preferring to use pitch. The reasons include the familiarity of sound through use of screen readers as well as (possible) reduced performance time and accuracy.
Categories and Subject Descriptors H.5.2 [Information Interface]: User Interface—Haptic I/O; H.5.1 [Information Interface]: Multimedia Information System— Artificial, augmented, and virtual realities
General Terms Human Factors, Measurement, Design, Experimentation.
Keywords: haptic interaction, PHANToM, accessibility, blind, visually disabled, visually impaired, multi-modal.
What we do not understand well are the types of perceptual substitutions and their human performance implications. For example, bar height could have been encoded by vibration. Would this have been a usable or even preferred alternative over pitch for the users?
Permission to make digital or hard copies of all or part of this work for personal or classroom use is granted without fee provided that copies are not made or distributed for profit or commercial advantage and that copies bear this notice and the full citation on the first page. To copy otherwise, or republish, to post on servers or to redistribute to lists, requires prior specific permission and/or a fee. ASSETS07, Oct. 15-17, 2007, Tempe, Arizona, USA. Copyright 2007 ACM 978-1-59593-573-1/07/0010…$5.00.
83
allows users to manipulate a stylus in a 3-D environment. The stylus limits tasks to domains where one can touch and manipulate using an instrument similar to a pointer, paint brush or scalpel, although point force devices can be combined to allow grasping with multiple finger attachments such as thimbles.
Early research in haptics has primarily focused on developing the technology and demonstrating the benefits of using haptics. Many questions remain for successful widespread implementation of haptic displays. For example, what types and attributes of information can be meaningfully mapped to haptics? What constitutes a good mapping? Do people, particularly visually disabled individuals, perceive haptic displays differently? How should haptics be combined with sonification and visualization? What haptic tools are best for which tasks? Answering these questions will allow developers to apply general knowledge across many application domains. Not answering them also has a price: Oakley et al. [21] noted that arbitrary haptic information combinations could often be ineffective or misleading.
Given some of the characteristics of current haptic devices, it is not surprising that applications, such as teleoperation, that integrate manipulation with naturally occurring force-related kinesthetic haptic properties are the most successful. A recent device, the nanomanipulator, integrates force output with stereoscopic visual output for the control of a Scanning Tunneling Microscope [28]. Surgical training is also a prolific area of development [6]. GROPEIII [3], under development from 1967 to 1990, is a virtual environment simulating 6-D force fields of interacting protein molecules.
We conducted an experiment with the PHANToM haptic device to better understand human performance with magnitude (size) haptically coded as physical length or vibration. We had equal groups of blind and sighted participants to determine whether the blind have differences in performance or perception since they rely heavily upon touch in daily tasks, and are a user group of particular concern to the authors.
It is worth noting that much of the above research shows conclusively a benefit of haptic interaction: that environments combining haptics and graphics are more effective than graphics alone [14, 18, 28]. There is clearly one caveat here. These successful systems all involve visually guided manipulation tasks and the display of primarily kinesthetic properties such as limb position and force magnitude that can be easily generated as resistance to motion by force-feedback. In other modes of tactile haptic device use, e.g., the perception of texture in a virtual object, are more difficult to demonstrate clear human performance benefits. (For a taxonomy and discussion of haptic modes, see Kirkpatrick and Douglas [11].)
This paper will first present a brief review of the relevant haptics research, and then present the experiment and its results. Finally, we will discuss its findings and relevance.
2. BACKGGROUND Haptic properties are felt perceptions of qualities of natural objects such as hot, slippery, hard, and heavy as well as position in space of a limb. An extensive literature exists based on decades of human psychophysical experimentation [17].
2.2 Moving Beyond Realistic Imagery: Mapping Visual Data to Haptic Properties
2.1 Displaying Realistic Haptic Properties
Moving haptic interaction into successful substitution of visual properties with haptic properties is a very difficult and uncharted area of research. Unlike the goal of creating realistic visual-haptic images, this substitution involves the mapping of attributes and types of abstract data or information onto perceptual properties [4]. When this is a multi-modal, multi-sensory display it can be called information perceptualization [20]. For example, the abstract concept of magnitude can be mapped in the visual modality to size or color, in the acoustic modality to pitch or volume and in the haptic modality to vibration or displacement.
While computer-generated graphics and acoustics are currently able to display a wide range of perceptual properties, haptic devices are much more limited. Some haptic devices, such as the PHANToM, are currently able to simulate tactile properties such as roughness and hardness, and kinesthetic properties such as viscosity and position. (In this paper the term haptics will be used to cover both tactile and kinesthetic properties of human perception unless specifically distinguished.) While no general purpose haptics devices display thermal or chemogenic properties, experimental devices have been developed [22]. One taxonomy of haptic properties for haptic design is available in Nesbitt [20].
Most research in mapping visual properties to haptic properties has occurred in the context of developing and understanding applications for visually impaired users [7, 8, 25, 26, 29, 30]. The work of Ramloll, Brewster and Yu was described earlier regarding bar charts. Their work on a haptics-only system for the blind for displaying mathematical (visual) graphs is equally valuable [25, 30]. Both blind and sighted participants were given graphs represented haptically. Each graph contained two graphed lines, one sticky and one slippery. XY data values were represented by touchable gridlines. Understanding the trends of the graphs was difficult for most participants, although participants were able to distinguish the two graphed lines by friction properties. Gridlines were problematic, and participants were often unable to derive data values based on grid size. Differences between blind and sighted participants were inconclusive due to lack of a sufficient number of blind individuals.
Research on the psychophysics of haptic displays is just emerging. Lederman & Klatzky [15] identify the resolution level of the human haptic sense that a haptic display would have to match in order to provide “high-fidelity” display. Minsky [19] has evaluated the perception of texture generated from an actual display; Tan [27] the perception of sphere size; Kirkpatrick & Douglas [10] the perception of Koenderink shapes; Penn et al. [24] and Wall & Harwin [32] the perception of roughness; and Pao & Lawrence [23] hardness and friction. Both Penn et al. and Pao & Lawrence discovered that psychophysical experimentation with humans touching natural objects does not necessarily predict their performance with computer-generated haptic displays. Unlike graphics and sound displays, all haptic displays are actually input/output devices with output as haptic display integrated into an input device for the usual interaction with traditional 2-D and 3-D GUI’s. Haptic mice and the Pantograph are 2-D input devices. One of the most common point force devices, the 3DOF PHANToM,
A more recent paper published in ASSETS ’06 by Kahol et al. [8] develops a method for rendering color through multi-dimensional surfaces of haptic texture encoding. The approach was tested with both a PHANToM haptic joystick and a CyberTouch glove.
84
whether this is an optimal representation for data such as magnitude that is fundamentally abstract. This research problem motivates our experimental work.
Experimental testing with users included blind participants. After a brief training period users were able to achieve 100% accuracy on color recognition from the training set. In a second experimental study the participants were able to demonstrate a high degree of congruency between the similarity of textures (colors) encoded by the system, and the hue saturation color wheel.
As a testing device, we chose to use the PHANToM for its wide availability and 3D output capability. In choosing an experimental design, we considered the classical experiments of psychophysics such as the Just Noticeable Difference (JND) task. While many psychophysical experimental tasks are invaluable for obtaining information on the location and degree of sensation, they are designed to exclude cognitive processing. Since judgment of relative magnitude using the PHANToM involves significant cognitive processing, an experimental task such as JND is not appropriate.
Unlike applications that map the value of scalar information to a haptic property, an experimental study of unimodal, bimodal and trimodal feedback by Vitense et al. [31] examines human performance for combinations of auditory, haptic and visual feedback in a search and select drag-and-drop desktop task. Performance was assessed by workload and time. Haptic feedback was implemented as vibration when the haptic pointer was located over a desktop folder. (The haptic device was a Logitech forcefeedback mouse.) Of particular interest to our research was the finding that unimodal haptic feedback was the fastest of all conditions including visual. It also had a low subjective workload close to that of visual feedback. More generally, haptics combined with the other sensory modalities enhanced performance time. Auditory feedback increased time and workload. We note that the 32 participants did not include blind people, but we agree with the authors that the results suggest great potential of multi-modal feedback for users with visual impairments. This study is similar to other work with force-feedback mice that supports the use of haptics for feedback, guidance and manipulation with kinesthetic properties such as icon magnetism.
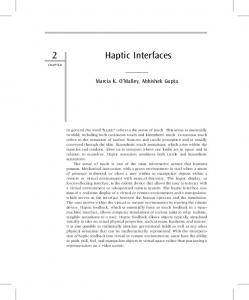
It is generally accepted that users of point-force haptic devices have reduced haptic and tactile sensory cues that are normally available through perception during human object recognition [16]. For example, multi-finger area contact can perceive an object’s surface extent directly, whereas temporal integration of mental states is required when deciding the total distance traversed when moving from one point to another with a haptic device. We have found that overcoming these limitations places additional cognitive demands on users and increases task time [10]. We were also interested in whether a natural mapping existed between various haptic stimuli and the abstract concept of magnitude. For these reasons and because we are concerned with predicting real-world use of haptic devices like the PHANToM, we created our own task of magnitude comparison, encoding pairs of magnitude with displacement (physical length) or vibration. (See Figure 1.) Displacement was represented by the height of the virtual walls and vibration by varying the amplitude or frequency of the PHANToM’s “buzz effect”, triggered by touching height-invariant walls. In each treatment, participants indicated which of the stimuli was “larger”, with the precise definition of larger left to the participant for vibration. Both blind and sighted but blindfolded participants were secured.
We could find only one study that directly compares differences in haptic perception for blind and sighted participants in experimental conditions that are independent of a specific application. Colwell et al. [5] performed experiments to measure differences in computergenerated haptic perception of blind and sighted participants for roughness, object size and angle for several types of cubes and spheres. Haptics was implemented on Immersion Corp. 3DOF force-feedback Impulse Engine. Roughness was studied using a psychophysical paradigm of magnitude estimation. The results from this first study showed that more blind people were more discriminating than sighted people in assessment of roughness of the textures. No significant differences in performance in all three studies were found between blind and sighted participants except sighted participants were better able to judge sheared cubes more accurately. Both groups were significantly more accurate in perception of larger from smaller objects.
3.1 Research Questions and Hypotheses Magnitude (of data) is often represented visually as a spatial representation of linear length, spatial extent or volume. We will call this displacement. For example, in a mathematical graph the length and slope of the plotted lines represent magnitudes of data and rate of change as a 2-D representation. Similarly, histograms represent the simpler concept of relative magnitude as 1-D “sticks” of varying lengths. For our first experimental treatment condition for displacement (see Figure 1), we created pairs of 3-D walls whose vertical extent could be physically traced, much as the existing haptic graphing approaches do.
We believe that an important next step in haptics research for information perceptualization is to systematically test human performance for a variety of computer-generated haptic properties mapped to attributes of visual data. Because of the importance of haptic environments for accessibility, both sighted and blind individuals should be tested. The generalized results of such experiments can be developed into guidelines that will allow developers to choose the best types of data mappings and haptic tools for their specific applications.
3. THE EXPERIMENT As discussed earlier, information perceptualization maps abstract data to perceptual properties. One such abstract mathematical concept is magnitude and a basic task is judging relative magnitude of two different quantities. Current haptic work often attempts to make a physical model of the visual representation. For example, visual lines become tangible lines [29. 30]. No research indicates
Displacement: Participants move up and down the walls to perceive displacement.
Vibration: Participants touch the walls, causing the stylus to vibrate.
Figure 1. Tasks
85
There are problems with this simple representation. In addition to the need for one to transparently sense the position of objects through the stylus, there is the additional obstacle posed by forming a complete image through sequential contacts over time, and then comparing several of these integrated haptic images. There is research indicating that haptic recognition tasks are much more difficult when they involve temporal integration [12, 16]. In particular, the perception of distance is affected by duration of traversal [1]. This latter indicates that the ability to accurately perceive sizes by moving along an object may be suspect, particularly if any factor slows or speeds some portions of traversal. The poor temporal consistency of touch also indicates that it may be difficult to compare objects sensed over time.
TABLE 1. Base sizes for the display type treatments Base Sizes Display Type Frequency
Medium 100Hz
Large 110Hz
Amplitude
1.3mm
1.5mm
1.7mm
Displacement
40mm
50mm
60mm
During each trial the magnitudes were applied to two virtual haptic walls (Figure 1). In the displacement state the height of the walls varied with magnitude. In the other states touching the walls caused the PHANToM to vibrate at the appropriate frequency or amplitude. In all treatments the walls were equidistant and rested on a “floor” to aid orientation within the 3-D haptic space.
The psychophysical literature suggests that vibration is a potential alternative. Vibration is a uniquely haptic property. Its use allows other data and information to be coded in the visual mode. This reduces workload stress and increases screen real estate for visual displays. Furthermore, anecdotal evidence suggests that blind participants might particularly benefit from vibration coding through transfer. For example, the Optacon [2] outputs a vibration “image” of printed material that it passes over, and has enjoyed a period of commercial availability, and vibration passing through white canes is used by the blind for way finding and to determine surface texture.
3.3 Procedure Sighted participants were blindfolded to remove environmental visual cues. All participants were instructed to choose the taller wall in the displacement state, and to choose the “larger” wall in the vibration state. Participants were asked to define “larger” for these states as suited them, and were questioned about their thought process during the exit interview. Once the participant reached a decision for a pair of magnitudes, they clicked the PHANToM stylus button to return control to the keyboard, then pressed the 4,5 or 6 key on the number keypad to record answers of “left wall larger”, “same”, or “right wall larger” respectively. They could also enter a 0 to indicate an error and return to the walls. Finally, pressing the enter key returned the participant to the PHANToM with the next set of magnitudes loaded and waiting.
For these reasons, our second and third experimental treatment conditions tested the ability of participants to make relative magnitude judgments using vibration, varied by either frequency or amplitude (Figure 1). We developed the following research hypotheses concerning human performance in time and accuracy: • • •
Small 90Hz
There was no feedback concerning correct answers at any time, and no definition of “larger” was given for amplitude or frequency. Participants were allowed an exploratory time during which they were presented with randomly selected samples of the experimental task. They could explore the haptic space and practice the sequence of keystrokes necessary as many times as they chose in each treatment state before signaling that they felt comfortable with the task. This time was also used to adjust chair and desk position and elevation of their arm and/or the PHANToM for comfort. When the participant had explored all display types to their satisfaction the experiment began.
Vibration coding would be superior to displacement. Frequency coding of vibration would differ from amplitude. Blind participants would exhibit larger differences favoring vibration coding.
3.2 Experimental Design The experimental design was mixed design repeated measures ANOVA, with displacement and vibration as the treatment factor display type. Our experiment included two types of vibration: varied by amplitude or by frequency. However, the frequency results were inconclusive and should be treated with caution. (This will be explained in our Discussion section.) We included sightedness as a between-subjects factor, with equal populations of eleven subjects each. Each participant evaluated 33 randomly ordered trials in each of three randomly ordered blocks.
Experimental sessions ranged between 40 minutes and slightly over two hours with most participants taking slightly more than an hour.
3.4 Participants There were twenty-two participants in the experiment, eleven in each group. Sighted participants were selected from the general community with only a few computer science students. Two of the sighted participants had used a PHANToM very briefly before.
Three base magnitudes were chosen for each treatment. (See Table 1.) Each trial was composed of a pair of magnitudes, one of which was a base and the other the base multiplied by one of 11 ratios ranging from .5 to 1.5 in increments of .1 units, including a ratio of 0 (no change from base), for a total of 33 possible pairs of magnitudes per condition. This reduced learning by insuring that no two pairs of magnitudes were identical in any given display type, while allowing repeated measures of a given ratio. When amplitude was varied, the base frequency was 100 Hz; when frequency was varied, the base amplitude was 1.3mm.
Blind participants were selected from candidates who were physically unable to use large-print books or screen magnification software to provide visual access to materials. In most cases this was equivalent to total vision loss, hence our use of the term “blind”. We also required participants to be functionally independent, defined as actively participating in meaningful activities such as school, work, parenting, etc. Our criteria turned out to be quite restrictive and we eventually traveled to several cities to secure a sufficient population sample.
86
participants locate the keypad, reassuring them that their fingers were over the correct keys, or helping them when they forgot to press the PHANToM stylus button to turn control over to the keyboard.
Four of the participants were blind since birth; the rest ranged from 3 years to 30 years since reaching a level of blindness that would qualify them for our experiment, with the average being 17.4 years for all those not blind since birth. All were trained to use a white cane with most using it daily. A few had dogs rather than canes for daily use. All were trained to use Braille but some used Braille infrequently.
After completing each treatment, participants were told they could move around or take a break prior to the next treatment condition. Sighted participants were asked not to remove their blindfold until the experiment was complete. When the participant indicated readiness, the experiment resumed with the next treatment. Once all treatments were done, an exit interview was conducted with the experimenter recording oral answers.
An attempt was made to balance gender and to match the approximate age, gender, educational level and computer experience profile of the sighted and blind participant groups. Blind participants ranged from 18-60 in age with 6 females and 5 males. Education level ranged from high school to doctorate (two). Sighted participants ranged from 20-50 in age with 5 females and 6 males. Education level ranged from high school to doctoral candidate (two). All participants were cognitively able, and none had upper body disabilities that precluded free use of arms and torso or involved sensory damage to the hands or arms.
4. RESULTS The mean accuracies and times by display type (displacement, amplitude and frequency) are summarized in Table 2. However, the frequency results were inconclusive and should be treated with caution. This will be explained in our Discussion section. Table 2. Times and accuracies for each display type
3.5 Experimental Environment The experiment was conducted using the PHANToM model 1.0A on a 300-Mhz Pentium II running Windows NT 4.0. Securing a population with sufficient vision loss required transporting the equipment, but reasonable attempts were made to provide similar seating circumstances, ambient noise control, etc. All participants were encouraged to find a comfortable seating position relative to the equipment and to adjust the arm support.
Time
The keystroke sequence required was the most cognitively challenging distraction from the task at hand. After sensing the haptic environment, the participant pushed a button on the PHANToM stylus to shift control from the haptic environment to the keyboard, then a response key was pressed, followed by the enter key to return to the next haptic environment. To reduce the cognitive load, all superfluous keys on the number pad were physically blocked, leaving only the response keys, the error key, and the enter key available. In prototyping this was particularly helpful to blindfolded participants and blind participants who were not fluent computer users.
Accuracy
Display Type
Mean (sec.)
Std. Dev.
Mean (# correct)†
Std. Dev.
Displacement
13.70*
7.84
25.0
3.5
Amplitude
8.15
3.99
23.5
3.4
Frequency
8.89
5.09
19.9*
5.5
* Denotes significant difference p≤ .05 † Possible correct is 33.
As expected from the data in Table 2, and with a significance level of p≤ .05, analysis of variance revealed a significant difference in time for display type (F = 12.086, p < .0001). Paired t-tests for display type confirmed that there is a significant difference between times for the displacement condition when compared to either of the other two conditions (tdisp,amp = 4.124, p = .0005; tdisp,freq = 3.342, p = .0031). However, no difference was found for time between the two vibration conditions of amplitude and frequency. Displacement tasks definitely took almost 50% longer than either of the vibration conditions.
All participants were blind or blindfolded, so no visual components were present, and only the ambient audio inherent in PHANToM use was present. Participants were able to move between each magnitude in a pair at will, with the program recording the moment the stylus came into contact with or moved away from a wall. It also automatically recorded the magnitudes and the keystroke. In this way a record of duration and order of exploration, along with the final decision, was maintained.
We also note that times for these tasks are fairly long in terms of the order of real-world human perceptual tasks. They clearly represent the inclusion of a great deal of cognitive and physical movement time. Similarly, ANOVA of the accuracy measure for display type (see Table 2) demonstrated a significant difference in performance (F = 9.816, p = .0003). Paired t-tests confirmed that accuracy was better for the displacement condition when compared to frequency (tdisp,freq = -1.356, p = .0008) and for amplitude when compared to frequency (tamp,freq = 2.979, p = .0072). Displacement and amplitude were 22% more accurate than frequency. No difference was found for accuracy between displacement and the vibration condition of amplitude.
3.6 Experimental Task During the initial familiarity period participants were instructed to explore the PHANToM haptic space freely. The experimenter offered physical assistance locating objects within the simulation as needed, and guided the participant’s hands to the exposed portions of the keypad. The participant was able to explore all three treatments at will, and indicated when they were ready to move on to the experimental task.
In examining the factor for sightedness, Table 3 shows the mean accuracies and times for both sighted and blind participants. Blind participants took almost 50% more time to complete their tasks, but were approximately the same in accuracy.
During the experimental task participants were able to spend as long as they liked exploring each wall, and could move between walls in a pair until they felt comfortable with their answer. They were instructed to ask for help if they became disoriented or had questions about the task. Typical requests included helping
These observations made from the descriptive data in Table 3 were upheld by the analysis of variance. There was a significant
87
the difference in time is solely attributable to the physical constraint of traversing the walls in the displacement treatment and we believe it is the result of reduced cognitive load.
difference in time for sightedness (F1,2 = 4.521, p = .046) and no difference for accuracy. Table 3. Times and accuracies for sightedness Time Sightedness
Our most important finding with respect to amplitude is that magnitude has a natural mapping onto amplitude. Analysis shows a normal distribution of incorrect answers, similar to the distribution for displacement errors. This indicates that people mapped magnitude to amplitude consistently.
Accuracy
Mean (sec.)
Std. Dev.
Mean
Std.
(# correct)
Dev.
Sighted
8.25
5.02
22.4
4.7
Blind
12.25*
6.80
23.2
4.7
Finally, we would like to report preliminary evidence that participants may have subjectively preferred amplitude. One question in the post-experiment interview asked participants to tell us which were easiest to discriminate, height or vibration. Of the 59% of participants who indicated that some form of vibration had been easiest, 17% specifically cited amplitude by name or trial order, despite the question’s wording, which did not mention amplitude. Informal comments recorded during the experiment also supported the idea that amplitude was the easiest of the three treatments for many participants.
* Denotes significant difference p≤ .05
No other significant differences in performance were found, including interaction effects of sightedness with display type.
5. DISCUSSION Our initial hypotheses were: • • •
Vibration coding would be superior to displacement. Frequency coding of vibration would differ from amplitude. Blind participants would exhibit larger differences favoring vibration coding.
5.3 Frequency Frequency was the least accurate treatment, although it was statistically equal to amplitude for time. Our initial frequency choice was made without consideration of Weber ratios or neuroreceptor function. Difficulties that participants had with the frequency condition led us to further evaluate our choice of range for frequency. For this reason, we do not feel the frequency results are fully reliable.
Vibration varied by amplitude provides a faster, equally accurate and preferred display of magnitude compared with the traditional displacement approach, supporting our first research hypothesis. However, we could not support our second hypothesis. Vibration varied by frequency was problematic. Finally, we could not support our third hypothesis. The same coding benefits equally well visually disabled and sighted individuals. Vibration coding gave no advantage to blind participants.
Our frequency bases were chosen from the average of three vibrotactile displays of 40Hz, 60Hz and 230Hz used in psychophysical experiments mentioned in Loomis and Lederman [17]. This resulted in displays ranging from 45Hz to 165Hz, once the magnitude ratios were applied. This means that some of our trials had one display in the optimal excitation range for FAI mechano-receptors, while the other magnitude was in the optimal range for FAII mechano-receptors, which may be more suited to the type of vibration created by the PHANToM [13].
5.1 Displacement Displacement performed well with accuracy levels equal to those of amplitude despite taking 50% longer. We conclude that people of all sight levels are able to successfully make gross distinctions between magnitudes presented as haptic partial planes, thus validating the common approach of creating a haptic model of the visual graph. We attribute the increased contact time to greater cognitive load. While not explicitly measured, there is evidence to support this.
We suspect that this may account for the lack of consistent mapping from frequency to magnitude, as indicated by the distribution of errors and participant comments. Some participants made statements during the experiment indicating that they changed their view of “larger” during the frequency treatment, and others indicated during the exit interview that very slow frequencies felt more like large amplitudes and they weren’t sure whether to call them small or large.
The cognitive load of integrating discrete haptic contacts temporally is documented explicitly [10] and implicitly [26]. The displacement task requires integration of each wall traversal, as well as comparison of this information over time spent moving from one wall to the next. During the exit interview only 36% of participants indicated they felt the “height” treatment was “easiest”. Of these, several made statements such as “Height, because it was clear what ‘bigger’ meant”, implying that they may not have been referring to the ease of the perceptual task itself. Additionally, post-hoc analysis indicated that participants made an average of 74% more contacts with the walls during the displacement treatment than in either of the vibration treatments. This supports our belief that cognitive load was increased, resulting in increased exploration, and that the longer time spent during these trials was not exclusively related to the physical time required to traverse the walls.
With this insight, a different choice of frequency range might seem sensible, presumably in the higher FAII range. Unfortunately the upper range appears to be limited by subjective factors. Specifically the highest frequencies we presented, which were at the lower end of the FAII range, elicited comments such as “sounds like a dental drill.” It is likely that any range of frequencies would need to reside either entirely in the FAI range, or in the very lower end of the FAII range, however this presents a fairly small range of available frequencies for encoding, once Weber ratios are considered. For these reasons we believe that any frequency range may be poor encoding stimuli for a magnitude comparison task with any significant range of magnitudes for the PHANToM.
5.2 Amplitude Amplitude outperformed displacement, with statistically similar accuracy but much shorter times, supporting our hypothesis that some form of vibration would be superior to the traditional displacement presentation. As discussed above, it is not likely that
88
than vibration tasks. Displacement and amplitude were 22% more accurate than frequency. Amplitude was found to have a natural mapping to magnitude. Frequency, despite expected transfer of training from vibration generating tools such as the white cane, was the poorest of the possible display types and may not be suited to this type of task. Blind participants, while taking 50% longer, did not have higher accuracy, and there were no interaction effects.
5.4 Sightedness The lack of interaction effects between sightedness and treatment surprised us. While blindness does not increase a person’s ability to perceive the haptic sensations presented, we expected transfer from accessibility tools to improve evaluation of vibration. White canes provide a single point of data that must be integrated over time to form a cognitive model, and an experienced white cane user can differentiate the surface over which the cane sweeps by vibration. Participants who used guide dogs also indicated that useful vibration information is transmitted through the handle, and reading braille, while cutaneous, would presumably train one’s mental ability to perceive and integrate tactual information. John Kennedy at the University of Toronto Scarborough argues that people who are blind perform similarly to sighted (blindfolded) individuals on tasks such as picture-based object recognition, but have a greater skill in tactile exploration [9].
These results suggest that vibration varied by amplitude provides a consistently interpreted, faster and equally accurate display of magnitude compared with the traditional displacement approach. Secondly, the same coding benefits visually disabled and sighted individuals equally well. This experiment contributes to our understanding of human perception of computer-generated haptic properties. It benefits the general enterprise of creating multi-sensory interaction, the integration of haptics into information perceptualization and the creation of haptics applications for the blind.
For all of these reasons we hypothesized that blind participants would be generally faster and more accurate with haptic data. We also expected blind participants with minimal exposure to visual graphs to have the most difficulty with the displacement treatment, since it is a physical model of the visual graph representation. We assumed this might be partially mitigated by the experience integrating tactual data over time, but expected vibration to prove the most beneficial treatment overall. None of our assumptions with regard to blind participants were correct, and in fact our sole statistically significant finding with regard to sightedness was that blind participants were slower across all treatments, with no significant interaction effect.
This research is only a first-step in exploring the use of haptics for abstract data “visualization” both with and without graphics. Future research includes the exploration of other perceptual properties: hardness, viscosity and stiffness, in addition to refining our work on frequency perception.
7. REFERENCES [1] Armstrong, L., and Marks, L. Haptic perception of linear extent. Perception & Psychophysics, volume 61, number 6, 1999, pages 1211-1226. [2] Bliss, J.C., Katcher, M.H., Rogers, C.H., and Shepard, R.P. Optical-to-tactile image conversion for the blind. IEEE Trans. on Man-Machine Systems, volume 11, number 1, 1970, pages 58-65.
The primary presumed advantage of the vibration states over the displacement states is in the reduced cognitive load. It is possible that blind participants’ greater ability to integrate haptic information cognitively may have offset any learning in the vibration states. One would expect in that case to find that blind participants were more accurate across all treatments, and this was not the case. Alternatively, it may indicate that our tasks were either subject to basic physiological factors not affected by sightedness, or the tasks were sufficiently dissimilar from real world settings that there was no transfer from exposure to accessibility technology.
[3] Brooks, F. P., Jr., Ming, O.Y., Batter, J. J., & Kilpatrick, P. J. Project GROPE-haptic displays for scientific visualization. Computer Graphics, volume 24, number 4, 1990, pages 177185. [4] Card, S.K., Mackinlay, J.D. and Shneiderman, B. Readings in Information Visualization: Using Vision to Think. Morgan Kaufmann, San Francisco, 1999.
Our one significant finding with respect to sightedness was that blind participants took nearly 50% longer across all treatments. We found that the blind participants were, for the most part, very interested in the PHANToM, and asked more questions after the experiment. We wonder whether a higher level of interest explains the longer time taken. An experiment with time held constant might help determine whether blind participants needed more time to reach equivalent accuracy, or were simply more leisurely.
[5] Colwell, C., Petrie, H., Kornbrot, D., Kardwick, A., and Furner, S. Haptic virtual reality for blind computer users. In Proc. ACM Conference on Assistive Technologies, 1998, pages 92-99. [6] Cotin, S., Delingette, H., and Ayache, N. Real-Time Elastic Deformations of Soft Tissues for Surgery Simulation. In IEEE Transactions on Visualization and Computer Graphics: Special Issue on Surgery Simulation, volume 5, number 1, January 1999, pages 62-73.
As described earlier, the research into differences between sighted and visually disabled users’ perception of computer generated haptics has failed to report statistically significant differences for most conditions, however it has also failed to explicitly report null results, and so it is difficult to find evidence supporting or refuting these explanations. We hope that further research will not fail to make explicit null results, and we suggest that research specifically measuring cognitive load for these haptic evaluation tasks would be beneficial.
[7] Grabowski, N.A. and Barner, K.E. Data visualisation methods for the blind using force feedback and sonification. In Proc. SPIE Conference on Telemanipulator and Telepresence Technologies V, Boston, MA, 1998, pages 131-139. [8] Kahol, K., French, J., Bratton, L. and Panchanathan, S. Mode transformations for vision: Learning and perceiving colors haptically. In Proc. ACM Conference on Assistive Technologies, 2006, pages 173-180.
6. CONCLUSION AND FUTURE WORK In summary, significant differences were found for the display type and sightedness conditions. Displacement tasks were 50% slower
89
[22] Ottensmeyer, M. and Salisbury, K. Hot and cold running VR: adding thermal stimuli to the haptic experience. In Proceedings of the PHANToM Users Group and MIT Artificial Intelligence Lab Tech Report No. 1617, 1997.
[9] Kennedy, J.M. Recognizing outline pictures via touch: Alignment theory. In M.A. Heller (Ed.) Touch, representation and blindness, Oxford, 2000, pages 67-98. [10] Kirkpatrick, A. E., and Douglas, S. A. A shape recognition benchmark for evaluating usability of a haptic environment. In Haptic HCI: First International Workshop, Glasgow, UK, 2000, In Lecture Notes in Computer Science, Brewster, Stephen, & Murray-Smith, Roderick (Eds.), volume 2058, pages 151-156. Springer, Berlin, 2001.
[23] Pao, L.Y. and Lawrence, D.A. Synergistic Visual/Haptic Computer Interfaces. In Proc. of Japan-USA-Vietnam Workshop on Research and Education in Systems, Hanoi, Vietnam, 1998, pages 155-162. [24] Penn, P., Petrie, H., Colwell, C. Kornbrot, D. Furner, S. and Hardwick, A. The haptic perception of texture in virtual environments: An investigation with two devices. In Haptic HCI: First International Workshop, Glasgow, UK, 2000. In Lecture Notes in Computer Science, Brewster, Stephen, & Murray-Smith, Roderick (Eds.), volume 2058, 2001, Springer, Berlin, pages 25-30.
[11] Kirkpatrick, A.E. and Douglas, S.A. Application-based Evaluation of Haptic Interfaces. Tenth Symposium on haptic interfaces for virtual environment and teleoperator systems. Orlando, FL, March 24-25, 2002. Part of IEEE Virtual Reality 2002, March 24-27, 2002. [12] Klatzky, R.L., Loomis, J.M., Lederman, S.J., Wake, H., and Fujita, N. Haptic identification of objects and their depictions. Perception and Psychophysics, volume 54, 1993, pages 170178.
[25] Ramloll, R., Yu, W. and Brewster, S. Constructing sonified haptic line graphs for the blind student: first steps. In Proc. ACM Conference on Assistive Technologies, 2000, pages 1724.
[13] Kontarinis, D.A. and Howe, R.D. Tactile display of vibratory information in teleoperation and virtual environments. Presence, volume 4, number 4, 1995, pages 387-402.
[26] Ramstein, C., Marial, O., Dufresne, A., Carignan, M., Chasse, P., and Mabilleau, P. Touching and hearing GUI’s: Design issues for the PC-Access system. In Proc. ACM Conference on Assistive Technologies, 1996, pages 2-9.
[14] Lawrence, D.A., Lee, C.D., Pao, L.Y., and Novoselov, R.Y. Shock and vortex visualization using a combined visual/haptic interface. In Proc IEEE. Visualization 00, 2000, pages 131138.
[27] Tan, H. Z. Identification of sphere size using the PHANToM: Towards a set of building blocks for rendering haptic environment. In Proc. of ASME Dynamic Systems and Control Division, DSC-Vol. 61, 1997, ASME, New York, pages 197203.
[15] Lederman, S. J., and Klatzky, R. L. Designing haptic interfaces for teleoperational and distributed environments: Should spatially distributed forces be displayed at the fingertip? In Proc. of ASME Dynamic Systems and Control Division, DSCVol volume 61. ASME, New York, 1997, pages 11-15.
[28] Taylor, R. M., Chen, J., Okimoto, S., Llopis-Artime, N., Chi, V. L., Brooks, F. P., Falvo, M., Paulson, S., Thiansathaporn, P., Glick, D., Washburn, S., and Superfine, R. Pearls found on the way to the ideal interface for scanned-probe microscopes. In Proc. IEEE Visualization 97, 1997.
[16] Lederman, S.J. & Klatzky, R.L. Haptic Identification of Common Objects: Effects of Constraining the Manual Exploration Process. Perception & Psychophysics, volume 66, number 4, 2004, pages 618-628.
[29] Yu, W. and Brewster, S. Multimodal technologies: Multimodal virtual reality versus printed medium in visualization for blind people. In Proc. ACM Conference on Assistive Technologies, 2002, pages 57-64.
[17] Loomis, J.M. and Lederman, S.J. Tactual perception, vol. II, chapter 31, 1-41. In K. Boff, L. Kaufman, & J. Thomas (Eds.), The Handbook of Perceptual Organization and Cognition, New York: Wiley, 1986.
[30] Yu, W., Ramloll, R. and Brewster, S. Haptic graphs for blind computer users. In Haptic HCI: First International Workshop, Glasgow, UK, 2000. In Lecture Notes in Computer Science, Brewster, Stephen, & Murray-Smith, Roderick (Eds.), volume 2058, 2001. Springer, Berlin, pages 41-51.
[18] Mark, W.R., Randolph, S.C., Finch, M., Van Verth, J.M., and Taylor, R.M. Adding force feedback to graphics systems: Issues and solutions. In Proc. of the 23rd Annual Conference on Computer Graphics and Interactive Techniques, 1996.
[31] Vitense, H., Jacko, J. and Emery, V.K. Multimodal technologies: Multimodal feedback: establishing a performance baseline for improved access by individuals with visual imparitments. In Proc. ACM Conference on Assistive Technologies, 2002, pages 49-56.
[19] Minsky, M. D. R. Computational haptics: The Sandpaper system for synthesizing texture for a force-feedback display. Unpublished Ph.D. thesis, MIT, 1995. [20] Nesbitt, K.V. Modeling the multi-sensory design space. Australian Symposium on Information Visualization, volume 9, 2001, pages 27-36.
[32] Wall, S. A. and Harwin, W.S. Interaction of visual and haptic information in simulated environments. In Haptic HCI: First International Workshop, Glasgow, UK, 2000. In Lecture Notes in Computer Science, Brewster, Stephen, & Murray-Smith, Roderick (Eds.), volume 2058, 2001. Springer, Berlin, pages 1081-1451.
[21] Oakley, I., McGee, M. R., Brewster, S. and Gray, P. Putting the feel in look and feel. In Proc. CHI ’00 ACM Conference on Human Factors in Computing Systems, 2000, pages 415-422.
90