Todd Michael Austin. A dissertation ... all stages of its development. Their efforts have made .... 3.5 Increasing Prediction Performance with Software Support .
HARDWARE AND SOFTWARE MECHANISMS FOR REDUCING LOAD LATENCY
By
Todd Michael Austin
A dissertation submitted in partial fulfillment of the requirements for the degree of
Doctor of Philosophy (Computer Sciences)
at the
UNIVERSITY OF WISCONSIN { MADISON 1996
Abstract
i
As processor demands quickly outpace memory, the performance of load instructions becomes an increasingly critical component to good system performance. This thesis contributes four novel load latency reduction techniques, each targeting a di�erent component of load latency: address calculation, data cache access, address translation, and data cache misses. The contributed techniques are as follows:
� Fast Address Calculation employs a stateless set index predictor to allow address calculation to
overlap with data cache access. The design eliminates the latency of address calculation for many loads.
� Zero-Cycle Loads combine fast address calculation with an early-issue mechanism to produce pipeline designs capable of hiding the latency of many loads that hit in the data cache.
� High-Bandwidth Address Translation develops address translation mechanisms with better latency and area characteristics than a multi-ported TLB. The new designs provide multiple-issue processors with e�ective alternatives for keeping address translation o� the critical path of data cache access.
� Cache-conscious Data Placement is a pro le-guided data placement optimization for reducing the frequency of data cache misses. The approach employs heuristic algorithms to nd variable placement solutions that decrease inter-variable con ict, and increase cache line utilization and block prefetch.
Detailed design descriptions and experimental evaluations are provided for each approach, con rming the designs as cost-e�ective and practical solutions for reducing load latency.
Acknowledgements
ii
It's hard to believe, but after nearly six years, the time has come to leave Madison. When I think back to all my years here, it is clear there are many to whom I owe my thanks and acknowledgements. First and foremost, I must thank my family for their endless support in my mostly self-indulgent endeavor to pursue a Ph.D. My wife Emily, son Nicholas, and daughter Katharine have spent far too many years living from check to check in too small of a house with too small of a car, always giving me the love, stability, and diversions I needed to nish my Ph.D. with my sanity intact. I have made many close friends in the Computer Sciences Department, more than I can include here. Their in uences and friendships will be with me all my life. My advisor, Guri Sohi, has provided me with the guidance and encouragement needed to navigate from CS 552 to this thesis. When I compare myself to the person I was six years ago, it becomes truly evident how much Guri has in uenced my attitudes and abilities. I hope he will feel free to share in any successes that I may have after I leave Madison. The members of my preliminary and nal defense committees, Suresh Chalasani, Charles Fischer, Jim Goodman, Jim Larus, and David Wood, provided invaluable assistance by critiquing this work at all stages of its development. Their e�orts have made this thesis more accurate, more complete, and easier to read. The members of the Wisconsin Multiscalar group have been my close con dants since the day I arrived. Scott Breach has been my most trusted sounding board for ideas and a close collaborator on the Safe-C work. T.N. Vijaykumar was a collaborator on the Knapsack work, the primordial seed of this thesis. Dionisios Pnevmatikatos shared his talents with me on the Fast Address Calculation work and served as a willing guinea pig for my SimpleScalar experiments. Other people that I want to acknowledge for their friendship and company are Steve Bennett, Doug Burger, Babak Falsa , Alain Kagi, Alvy Lebeck, Andreas Moshovos, Subbarao Palacharla, and Steve Reinhardt. Finally, I would like to express my thanks to the agencies that helped to fund my endeavors at Madison. My work was supported in part by NSF Grants CCR-9303030 and MIP-9505853, ONR Grant N00014-93-1-0465, and a donation from Intel Corporation. Todd M. Austin University of Wisconsin { Madison, April 1996
iii
Contents Abstract
i
Acknowledgements
ii
1 Introduction
1
Anatomy of a Load : : : : : : : : : : : : : : : The Impact of Load Latency : : : : : : : : : Reducing the Impact of Load Latency : : : : Contributions of This Thesis : : : : : : : : : 1.4.1 Fast Address Calculation : : : : : : : 1.4.2 Zero-Cycle Loads : : : : : : : : : : : : 1.4.3 High-Bandwidth Address Translation 1.4.4 Cache-Conscious Data Placement : : : 1.5 Organization of This Thesis : : : : : : : : : :
1.1 1.2 1.3 1.4
: : : : : : : : :
: : : : : : : : :
: : : : : : : : :
: : : : : : : : :
: : : : : : : : :
: : : : : : : : :
: : : : : : : : :
: : : : : : : : :
: : : : : : : : :
: : : : : : : : :
: : : : : : : : :
: : : : : : : : :
: : : : : : : : :
: : : : : : : : :
: : : : : : : : :
: : : : : : : : :
: : : : : : : : :
: : : : : : : : :
: : : : : : : : :
: : : : : : : : :
: : : : : : : : :
: : : : : : : : :
: : : : : : : : :
: : : : : : : : :
2 3 5 6 6 7 8 9 10
2 Experimental Framework
11
3 Fast Address Calculation
15
2.1 Compiler Tools : : : : : : : : : : : : : : : : : : : : : : : : : : : : : : : : : : : : : : : : : 11 2.2 Simulation Methodology : : : : : : : : : : : : : : : : : : : : : : : : : : : : : : : : : : : : 11 2.3 Analyzed Programs : : : : : : : : : : : : : : : : : : : : : : : : : : : : : : : : : : : : : : : 13 3.1 Introduction : : : : : : : : : : : : : : : : : : : : : : : : : : 3.2 Program Reference Behavior : : : : : : : : : : : : : : : : 3.2.1 Reference Type : : : : : : : : : : : : : : : : : : : : 3.2.2 O�set Distribution : : : : : : : : : : : : : : : : : : 3.3 Fast Address Calculation : : : : : : : : : : : : : : : : : : 3.3.1 Further Design Considerations : : : : : : : : : : : 3.4 Working Examples : : : : : : : : : : : : : : : : : : : : : : 3.5 Increasing Prediction Performance with Software Support 3.5.1 Software Support for Global Pointer Accesses : : : 3.5.2 Software Support for Stack Pointer Accesses : : : : 3.5.3 Software Support for General Pointer Accesses : : 3.6 Experimental Evaluation : : : : : : : : : : : : : : : : : : : 3.6.1 Methodology : : : : : : : : : : : : : : : : : : : : :
: : : : : : : : : : : : :
: : : : : : : : : : : : :
: : : : : : : : : : : : :
: : : : : : : : : : : : :
: : : : : : : : : : : : :
: : : : : : : : : : : : :
: : : : : : : : : : : : :
: : : : : : : : : : : : :
: : : : : : : : : : : : :
: : : : : : : : : : : : :
: : : : : : : : : : : : :
: : : : : : : : : : : : :
: : : : : : : : : : : : :
: : : : : : : : : : : : :
: : : : : : : : : : : : :
: : : : : : : : : : : : :
: : : : : : : : : : : : :
15 16 16 17 19 22 23 24 25 25 25 26 27
iv 3.6.2 Prediction Performance 3.6.3 Program Performance : 3.7 Related Work : : : : : : : : : : 3.8 Chapter Summary : : : : : : :
: : : :
: : : :
: : : :
4 Zero-Cycle Loads
: : : :
: : : :
: : : :
: : : :
: : : :
: : : :
: : : :
: : : :
: : : :
4.1 Introduction : : : : : : : : : : : : : : : : : : : : : : : 4.2 Zero-Cycle Loads : : : : : : : : : : : : : : : : : : : : 4.2.1 Implementation with One Decode Stage : : : 4.2.2 Implementation with Multiple Decode Stages 4.2.3 Further Design Considerations : : : : : : : : 4.3 A Working Example : : : : : : : : : : : : : : : : : : 4.4 Experimental Evaluation : : : : : : : : : : : : : : : : 4.4.1 Methodology : : : : : : : : : : : : : : : : : : 4.4.2 Baseline Performance : : : : : : : : : : : : : 4.4.3 Performance with Out-of-Order Issue : : : : : 4.4.4 Performance with Fewer Registers : : : : : : 4.5 Related Work : : : : : : : : : : : : : : : : : : : : : : 4.6 Chapter Summary : : : : : : : : : : : : : : : : : : :
5 High-Bandwidth Address Translation
: : : : : : : : : : : : : : : : :
: : : : : : : : : : : : : : : : :
5.1 Introduction : : : : : : : : : : : : : : : : : : : : : : : : : 5.2 Impact of Address Translation on System Performance : 5.3 High-Bandwidth Address Translation : : : : : : : : : : : 5.3.1 Multi-ported TLB : : : : : : : : : : : : : : : : : 5.3.2 Interleaved TLB : : : : : : : : : : : : : : : : : : 5.3.3 Multi-level TLB : : : : : : : : : : : : : : : : : : 5.3.4 Piggyback Ports : : : : : : : : : : : : : : : : : : 5.3.5 Pretranslation : : : : : : : : : : : : : : : : : : : 5.4 Experimental Evaluation : : : : : : : : : : : : : : : : : : 5.4.1 Methodology : : : : : : : : : : : : : : : : : : : : 5.4.2 Baseline Performance : : : : : : : : : : : : : : : 5.4.3 Performance with In-Order Issue : : : : : : : : : 5.4.4 Performance with Increased Page Size : : : : : : 5.4.5 Performance with Fewer Registers : : : : : : : : 5.5 Chapter Summary : : : : : : : : : : : : : : : : : : : : :
: : : : : : : : : : : : : : : : : : : : : : : : : : : : : : : :
: : : : : : : : : : : : : : : : : : : : : : : : : : : : : : : :
: : : : : : : : : : : : : : : : : : : : : : : : : : : : : : : :
: : : : : : : : : : : : : : : : : : : : : : : : : : : : : : : :
: : : : : : : : : : : : : : : : : : : : : : : : : : : : : : : :
: : : : : : : : : : : : : : : : : : : : : : : : : : : : : : : :
: : : : : : : : : : : : : : : : : : : : : : : : : : : : : : : :
: : : : : : : : : : : : : : : : : : : : : : : : : : : : : : : :
: : : : : : : : : : : : : : : : : : : : : : : : : : : : : : : :
: : : : : : : : : : : : : : : : : : : : : : : : : : : : : : : :
: : : : : : : : : : : : : : : : : : : : : : : : : : : : : : : :
: : : : : : : : : : : : : : : : : : : : : : : : : : : : : : : :
: : : : : : : : : : : : : : : : : : : : : : : : : : : : : : : :
: : : : : : : : : : : : : : : : : : : : : : : : : : : : : : : :
: : : : : : : : : : : : : : : : : : : : : : : : : : : : : : : :
: : : : : : : : : : : : : : : : : : : : : : : : : : : : : : : :
: : : : : : : : : : : : : : : : : : : : : : : : : : : : : : : :
: : : : : : : : : : : : : : : : : : : : : : : : : : : : : : : :
28 31 33 34
36
36 37 37 40 42 42 44 44 45 48 50 52 54
55
55 57 59 60 60 62 63 64 66 66 69 72 73 73 75
v
6 Cache-Conscious Data Placement
6.1 Introduction : : : : : : : : : : : : : : : : : : : : : : : : : : 6.2 How Variable Placement A�ects Data Cache Performance 6.3 Cache-Conscious Data Placement : : : : : : : : : : : : : : 6.3.1 Optimization Framework : : : : : : : : : : : : : : 6.3.2 Heuristic Placement Algorithm : : : : : : : : : : : 6.4 Detailed Methodology : : : : : : : : : : : : : : : : : : : : 6.4.1 Variable Pro ling : : : : : : : : : : : : : : : : : : : 6.4.2 Variable Placement Algorithm : : : : : : : : : : : 6.4.3 Placement Mechanisms : : : : : : : : : : : : : : : 6.5 Experimental Evaluation : : : : : : : : : : : : : : : : : : : 6.5.1 Methodology : : : : : : : : : : : : : : : : : : : : : 6.5.2 Cache Performance : : : : : : : : : : : : : : : : : : 6.5.3 Impact of Varied Cache Geometry : : : : : : : : : 6.5.4 Program Performance : : : : : : : : : : : : : : : : 6.6 Related Work : : : : : : : : : : : : : : : : : : : : : : : : : 6.7 Chapter Summary : : : : : : : : : : : : : : : : : : : : : :
7 Conclusion
: : : : : : : : : : : : : : : :
: : : : : : : : : : : : : : : :
7.1 Thesis Summary : : : : : : : : : : : : : : : : : : : : : : : : : 7.2 Future Directions : : : : : : : : : : : : : : : : : : : : : : : : : 7.2.1 Less-Speculative Fast Address Calculation : : : : : : : 7.2.2 Combining Stateful and Stateless Address Predictors : 7.2.3 Leveraging Address Prediction Information : : : : : : 7.2.4 Additional Compiler Support for Zero-Cycle Loads : : 7.2.5 Exposing Address Translation to the Compiler : : : : 7.2.6 Improving Cache-Conscious Data Placement : : : : :
: : : : : : : : : : : : : : : : : : : : : : : :
: : : : : : : : : : : : : : : : : : : : : : : :
: : : : : : : : : : : : : : : : : : : : : : : :
: : : : : : : : : : : : : : : : : : : : : : : :
: : : : : : : : : : : : : : : : : : : : : : : :
: : : : : : : : : : : : : : : : : : : : : : : :
: : : : : : : : : : : : : : : : : : : : : : : :
: : : : : : : : : : : : : : : : : : : : : : : :
: : : : : : : : : : : : : : : : : : : : : : : :
: : : : : : : : : : : : : : : : : : : : : : : :
: : : : : : : : : : : : : : : : : : : : : : : :
: : : : : : : : : : : : : : : : : : : : : : : :
: : : : : : : : : : : : : : : : : : : : : : : :
: : : : : : : : : : : : : : : : : : : : : : : :
77
: 77 : 78 : 79 : 80 : 81 : 84 : 84 : 87 : 92 : 93 : 94 : 96 : 101 : 101 : 106 : 107
109
: 109 : 111 : 111 : 112 : 112 : 112 : 112 : 113
Bibliography
115
A The SimpleScalar Architecture
122
B Detailed Results
138
vi
List of Figures 1.1 1.2 1.3 1.4
Anatomy of a Load : : : : : : : : Impact of Load Latency : : : : : Impact of Load Latency on IPC : Thesis Road Map : : : : : : : : :
: : : :
: : : :
: : : :
: : : :
: : : :
: : : :
: : : :
: : : :
: : : :
: : : :
: : : :
: : : :
: : : :
: : : :
: : : :
: : : :
: : : :
: : : :
: : : :
: : : :
: : : :
: : : :
: : : :
: : : :
: : : :
: : : :
: : : :
: : : :
: : : :
: : : :
: : : :
3 4 4 7
2.1 Experimental Framework : : : : : : : : : : : : : : : : : : : : : : : : : : : : : : : : : : : 12 3.1 3.2 3.3 3.4 3.5 3.6
Fast Address Calculation : : : : : : : : : : : : Load O�set Cumulative Distributions : : : : : Pipeline Support for Fast Address Calculation : Examples of Fast Address Calculation : : : : : Prediction Performance : : : : : : : : : : : : : Speedups, with and without Software Support :
: : : : : :
: : : : : :
: : : : : :
: : : : : :
: : : : : :
: : : : : :
: : : : : :
: : : : : :
: : : : : :
: : : : : :
: : : : : :
: : : : : :
: : : : : :
: : : : : :
: : : : : :
: : : : : :
: : : : : :
: : : : : :
: : : : : :
: : : : : :
: : : : : :
16 18 21 24 29 32
4.1 4.2 4.3 4.4 4.5 4.6
Zero-Cycle Loads : : : : : : : : : : : : : : : : : : : : : : : : : Pipelined Implementation with One Decode Stage : : : : : : Pipelined Implementation with Multiple Decode Stages : : : Pointer Chasing Example with and without Zero-Cycle Loads Hit Rates for Address- and Register Speci er-Indexed BRIC : Breakdown of All Loads by Latency in Cycles : : : : : : : : :
: : : : : :
: : : : : :
: : : : : :
: : : : : :
: : : : : :
: : : : : :
: : : : : :
: : : : : :
: : : : : :
: : : : : :
: : : : : :
: : : : : :
: : : : : :
: : : : : :
: : : : : :
37 38 41 43 47 49
5.1 5.2 5.3 5.4 5.5 5.6 5.7 5.8 5.9 5.10
A System Model of Address Translation Performance : Traditional High-Bandwidth Memory Designs : : : : : Piggyback Port : : : : : : : : : : : : : : : : : : : : : : The Life of a (Register) Pointer : : : : : : : : : : : : : Pipeline Support for Pretranslation : : : : : : : : : : : Relative Performance on Baseline Simulator : : : : : : TLB Miss Rates : : : : : : : : : : : : : : : : : : : : : Relative Performance with In-order Issue : : : : : : : Relative Performance with 8k Pages : : : : : : : : : : Relative Performance with Fewer Registers : : : : : :
: : : : : : : : : :
: : : : : : : : : :
: : : : : : : : : :
: : : : : : : : : :
: : : : : : : : : :
: : : : : : : : : :
: : : : : : : : : :
: : : : : : : : : :
: : : : : : : : : :
: : : : : : : : : :
: : : : : : : : : :
: : : : : : : : : :
: : : : : : : : : :
: : : : : : : : : :
: : : : : : : : : :
57 61 63 64 65 69 70 72 74 75
: : : : : : : : : :
: : : : : :
: : : : : : : : : :
: : : : : :
: : : : : : : : : :
: : : : : : : : : :
6.1 Cache-Conscious Data Placement : : : : : : : : : : : : : : : : : : : : : : : : : : : : : : : 80 6.2 Phase 1: Active/Inactive Variable Partitioning : : : : : : : : : : : : : : : : : : : : : : : 82 6.3 Phase 2: Temporal A�nity Set Generation : : : : : : : : : : : : : : : : : : : : : : : : : 82
vii 6.4 6.5 6.6 6.7 6.8 6.9 6.10 6.11 6.12 6.13 6.14 6.15 6.16 6.17 6.18 6.19 6.20 6.21 6.22 6.23 6.24
Phase 3: Address Assignment : : : : : : : : : : : : : : : : : : : : : : : : : Variable Reference Pro le : : : : : : : : : : : : : : : : : : : : : : : : : : : Pro ling Methodology (DPROF) : : : : : : : : : : : : : : : : : : : : : : : Heap Allocation Names : : : : : : : : : : : : : : : : : : : : : : : : : : : : Variable Placement Algorithm (PLACETOOL) : : : : : : : : : : : : : : : Active/Inactive Variable Partitioning : : : : : : : : : : : : : : : : : : : : : Temporal A�nity Set Generation : : : : : : : : : : : : : : : : : : : : : : : Global Variable Address Assignment : : : : : : : : : : : : : : : : : : : : : Heap Variable Address Assignment : : : : : : : : : : : : : : : : : : : : : : Post-pass Link Algorithm (KLINK) : : : : : : : : : : : : : : : : : : : : : Modi ed Heap Allocator : : : : : : : : : : : : : : : : : : : : : : : : : : : : Program Miss Rates Broken Down by Variable Interaction : : : : : : : : : Program Miss Rates Broken Down by Miss Class : : : : : : : : : : : : : : Performance of Placement Algorithms { 8k Direct-Mapped Cache : : : : : Impact of Random Placement for 8k Direct-Mapped Cache : : : : : : : : Impact of CCDP Placement for 8k Direct-Mapped Cache : : : : : : : : : Performance of Placement Algorithms { 8k 2-Way Set-Assoc. Cache : : : Performance of Placement Algorithms { 2k Direct-Mapped Cache : : : : : Performance of Placement Algorithms { 32k Direct-Mapped Cache : : : : Program Performance with Cache-Conscious Data Placement { 8k Cache Reduction in Exposed Miss Latency { 8k Cache : : : : : : : : : : : : : : :
: : : : : : : : : : : : : : : : : : : : :
: : : : : : : : : : : : : : : : : : : : :
: : : : : : : : : : : : : : : : : : : : :
: : : : : : : : : : : : : : : : : : : : :
: : : : : : : : : : : : : : : : : : : : :
: : : : : : : : : : : : : : : : : : : : :
: : : : : : : : : : : : : : : : : : : : :
: 83 : 84 : 85 : 86 : 87 : 88 : 88 : 90 : 91 : 92 : 94 : 97 : 97 : 98 : 99 : 100 : 102 : 102 : 103 : 105 : 105
A.1 SimpleScalar Architecture Instruction Formats : : : : : : : : : : : : : : : : : : : : : : : 123
viii
List of Tables
2.1 Baseline Simulation Model : : : : : : : : : : : : : : : : : : : : : : : : : : : : : : : : : : : 13 2.2 Benchmark Programs : : : : : : : : : : : : : : : : : : : : : : : : : : : : : : : : : : : : : 14 3.1 3.2 3.3 3.4
Program Reference Behavior : : : : : : : : : Program Statistics without Software Support Program Statistics with Software Support : : Memory Bandwidth Overhead : : : : : : : : :
: : : :
: : : :
: : : :
: : : :
: : : :
: : : :
: : : :
: : : :
: : : :
: : : :
: : : :
: : : :
: : : :
: : : :
: : : :
: : : :
: : : :
: : : :
: : : :
: : : :
: : : :
: : : :
: : : :
: : : :
17 28 30 33
4.1 Zero-Cycle Load Baseline Performance : : : : : : : : : : : : : : : : : : : : : : : : : : : : 46 4.2 Performance with Out-of-Order Issue : : : : : : : : : : : : : : : : : : : : : : : : : : : : : 49 4.3 Performance with Fewer Registers : : : : : : : : : : : : : : : : : : : : : : : : : : : : : : 51 5.1 Analyzed Address Translation Designs : : : : : : : : : : : : : : : : : : : : : : : : : : : : 67 5.2 Program Execution Performance : : : : : : : : : : : : : : : : : : : : : : : : : : : : : : : 68 6.1 6.2 6.3 6.4 6.5
Placement Algorithm Parameters : : : : : : : : : : : : : : : : : : : : : : : : : Analyzed and Pro led Inputs : : : : : : : : : : : : : : : : : : : : : : : : : : : Program Statistics before Cache-Conscious Data Placement : : : : : : : : : : Percent Change in Program Statistics after Cache-Conscious Data Placement Baseline Program Performance : : : : : : : : : : : : : : : : : : : : : : : : : :
: : : : :
: : : : :
: : : : :
: : : : :
: : : : :
: 95 : 95 : 96 : 101 : 104
A.1 SimpleScalar Architecture Register De nitions : : : : : : : : : : : : : : : : : : : : : : : 123 A.2 Operator/Operand Semantics : : : : : : : : : : : : : : : : : : : : : : : : : : : : : : : : : 124 B.1 B.2 B.3 B.4 B.5 B.6 B.7
Relative Performance on Baseline Simulator TLB miss rates : : : : : : : : : : : : : : : : Program Execution Performance : : : : : : Relative Performance with In-order Issue : Relative Performance with 8k Pages : : : : Program Execution Performance : : : : : : Relative Performance with Fewer Registers
: : : : : : :
: : : : : : :
: : : : : : :
: : : : : : :
: : : : : : :
: : : : : : :
: : : : : : :
: : : : : : :
: : : : : : :
: : : : : : :
: : : : : : :
: : : : : : :
: : : : : : :
: : : : : : :
: : : : : : :
: : : : : : :
: : : : : : :
: : : : : : :
: : : : : : :
: : : : : : :
: : : : : : :
: : : : : : :
: : : : : : :
: : : : : : :
: 139 : 140 : 141 : 142 : 143 : 144 : 145
Chapter 1
1
Introduction Memory system design is one of the most challenging aspects of computer architecture. The dynamic nature of the computer industry limits the lifetime of any cost-e�ective design solution, forcing designers to continually re-evaluate the cost-e�ectiveness of any design in light of changes in implementation technology, workload, and processor architecture. To further challenge designers, the most cost-e�ective solutions will often span the traditional boundary placed between hardware and software designs, possessing vital components in both domains. One of the paramount challenges in memory system design is the problem of continually lengthening load latency. For a large class of important programs, growing load latency dominates all other latencies during execution, making the performance of load instructions the most important barrier to good system performance. The problem of lengthening load latency can be traced to continuing technology, workload, and architecture trends. Each year, advances in implementation technologies reward processors with faster clocks, while memory speeds, particularly for DRAM, remain relatively unchanged. The fallout is a widening gap between the speed of processors and memory. Cache memory has for a long time been an e�ective mitigator, providing reduced memory access time through the use of the memory hierarchy. However, many newer workloads lack the locality necessary to perform well on traditional memory hierarchies. Familiar examples of this trend can be seen in environments supporting multitasking, multimedia, compression, and encryption. Finally, architectural changes place increased demands on the memory system which complicates its design and further aggravates load latency. A timely example of this trend can be seen in the shift towards instruction-level parallel processors that issue multiple loads and stores per cycle, resulting in increased bandwidth demands on the memory system. This thesis contributes four novel techniques for reducing load latency. The work presented takes a balanced approach to addressing the problem. A full chapter of material is devoted to each of the four major components of load latency: address calculation, data cache access, address translation, and data cache misses. Detailed design descriptions are given for each approach. The solutions presented include a hardware-based and a software-based design as well as two hardware-software codesigns. The e�ectiveness of each approach is evaluated using qualitative analyses to assess impacts on pipeline complexity and cycle-time as well as cycle-timing simulations to gauge impacts on pipeline throughput. The remainder of this chapter presents the background and motivation necessary to prepare the
2 reader for the remaining chapters. Section 1.1 introduces load instructions and describes the components of load latency. Section 1.2 explores the impact of load latency on both the performance of a single load instruction as well as the performance of the entire system. Section 1.3 examines existing approaches for reducing the impact of load latency. Section 1.4 presents an overview of the contributions of this thesis, and nally, Section 1.5 details the organization of the remaining chapters.
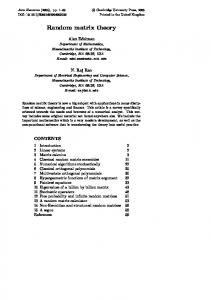
1.1 Anatomy of a Load Load instructions move data between the processor and memory. The semantics of a typical load are as follows: two inputs, a base address and o�set, are added together to form an e�ective address which is used to access data memory. In most modern architectures, the base is supplied from a processor register and the o�set is supplied by either an immediate constant, i.e., register+constant addressing, or via a register, i.e., register+register addressing. Architectures often employ variations of this simple scheme; for instance, the IBM System 370 combines the two addressing forms, o�ering an addressing mode that supports register+register+constant addressing. The VAX and Intel (x86) architectures eliminate explicit load instructions altogether by permitting any instruction to access operands from either registers or memory. In this thesis, the discussion is restricted to architectures with explicit load instructions and register+constant and register+register mode addressing. However, the approaches presented within should easily extend to other machines as well. A load, while being a single instruction, is decomposed into several component operations when mapped onto a processor pipeline. Figure 1.1 illustrates the major component operations of a load and their order of execution.1 A load is rst fetched by the processor from instruction memory, possibly within a group of instructions. Next, the processor must identify the load instruction. After a load has been identi ed, it is aligned to the pipe or functional units supporting its execution, base and index register values are read from the register le, and functional unit resources are secured. Finally, the e�ective address is computed and used to access data memory. As shown in the gure, address translation proceeds in parallel with data memory access. In a typical pipeline implementation, loads are fetched in the fetch (IF) stage of the pipeline. Identifying, aligning, and reading the register le occur in the decode (ID) stage of the pipeline. In designs with very fast clocks and wide issue, these operations are often split across multiple decode stages. E�ective address computation occurs in the execute (EX) stage of the pipeline, and data memory access and address translation in the memory access (MEM) stage of the pipeline. Load latency is de ned as the time it takes to compute the e�ective address of the access, access data memory, and return a result. In the example in Figure 1.1, e�ective address calculation takes 1 Of course, many variations exist upon this basic template; for example, some pipelines require address translation to complete before accessing the data cache. However, the basic template shown is representative of many modern pipelines.
3 IF
ID(s)
EX
MEM
Align Load Hit Miss
Fetch Load
Identify Load
Read Base/Index Registers
Compute Effective Address
Arbitrate Adder/ Cache
Access Data Cache Translate Effective Address
Load Latency
Figure 1.1: Anatomy of a Load. a single cycle, and data memory access takes a single cycle if the access hits in the data cache. If a load misses in the data cache, its latency is further increased by delays incurred with accessing lower levels of the data memory hierarchy, e.g., cache misses or page faults. The remaining components, e.g., fetch, align, identify, and arbitrate, are not normally considered an integral part of load latency, since they share few dependencies with earlier instructions and thus can be e�ectively hidden by overlapping their execution with earlier instructions.
1.2 The Impact of Load Latency Figure 1.2 illustrates how load latency a�ects program execution. The gure shows a traditional ve stage pipeline executing three dependent instructions. Pipelined execution continues without interruption until the sub instruction attempts to use the result of the previous lw instruction. In a traditional ve stage pipeline, a load instruction requires the EX stage for e�ective address calculation and the MEM stage for data cache access. The result of the load operation is not available until the end of cycle 5 (assuming a single cycle cache access and the access hits in the data cache), forcing the pipeline to stall issue one cycle waiting for register rw. As the pipeline stalls, valuable functional unit resources sit idle, wasting resources that could otherwise be used to improve program performance. Fortunately, the e�ect of load latency on program performance is tempered by two factors: 1) the processor's ability to tolerate latency, and 2) the relative impact of load latency compared to other latencies. The workload and execution model both a�ect the degree to which the processor can tolerate latency. If the workload contains su�cient parallelism and the execution model provides the capability to exploit the parallelism, the impact of load latency on overall performance can be reduced by executing independent instructions on idle processor resources. Execution models with high levels
4 Instruction add
rx,ry,rz
lw
rw,4(rx)
sub
ra,rb,rw
Clock Cycle 4 5
1
2
3
6
IF
ID
EX
WB
IF
ID
EX
MEM
WB
IF
ID
stall
EX
7
WB
Figure 1.2: Impact of Load Latency.
Instructions Per Cycle
2 1.8 1.6 1.4 1.2 1 0.8 0.6 Compress Espresso Sc Elvis Perl Int-Avg Eqntott Gcc Xlisp Grep YACR-2
Baseline
1 Cycle Loads
Doduc Mdljdp2 Ora Su2cor FP-Avg Alvinn Ear Mdljsp2 Spice Tomcatv
Perfect Memory
1 Cycle + Perfect
Figure 1.3: Impact of Load Latency on IPC. of latency tolerating capability include those that support such techniques as out-of-order issue [HP90], non-blocking loads [FJ94], and speculative execution [HP90]. The extent to which a program accesses memory (i.e., the dynamic frequency of loads) also a�ects the degree to which load latency impacts program performance. Programs that access memory often will need better load performance for good overall performance. To gauge the extent to which load latency a�ects system performance, a simulation case study was performed on the SPEC '92 benchmarks. The IPCs of benchmarks compiled with GNU GCC were examined while executing with varied load latency. Experiments were run on an aggressive 4-way in-order issue processor timing simulator (described in Section 3.6). The simulator was con gured with a 16k byte dual-ported direct-mapped non-blocking data cache, with 32 byte blocks, and a xed 6 cycle miss latency. The results of the experiments are shown in Figure 1.3. Baseline shows program performance with 2 cycle loads and a 6 cycle cache miss latency, 1-Cycle Loads reduces the cache hit latency to 1 cycle but retains the 6 cycle cache miss penalty, Perfect Cache represents a 2 cycle load latency and a 0 cycle cache miss penalty, and 1 Cycle+Perfect represents the case where all load
5 instructions complete in 1 cycle. In addition, the graph shows the average IPC, weighted by program run-time (in cycles), for the integer codes (the left group) and the oating point codes. A number of interesting observations can be made from Figure 1.3. In general, the integer codes saw more improvement in performance when load latency was reduced. The oating point codes did not fair as well because their executions are dominated by other long latency operations such as oating point computations. When comparing the relative impact of the analyzed component latencies, i.e., address calculation, data cache access, and cache misses, no single component stands out as the dominating component across all the codes. The integer code performance was a�ected more by eliminating the latency of address calculation or data cache access (i.e., 1-Cycle Loads), while the oating point codes bene ted more by eliminating the latency of data cache misses (i.e., Perfect Cache). Clearly, load latency can have a signi cant impact on system performance. Optimizations designed to reduce the impact of load latency, independent of which component of load latency is targeted, stand to gain much.
1.3 Reducing the Impact of Load Latency A signi cant body of work proposes techniques for reducing the impact of load latency. The techniques can be broadly bisected into two camps: latency tolerating techniques and latency reducing techniques. Tolerating techniques work by inserting independent instructions into the pipeline delay slots created by load latencies. Local instruction scheduling [KE93, PS90, GM86] is a commonly used compiletime technique to tolerate load latency (it is employed in this work as well). The scheduler attempts to place independent instructions between loads and their rst use, keeping pipeline resources utilized until loads complete. To make good schedules, the scheduler needs independent work, which is nite and usually quite small in the basic blocks of control intensive codes, e.g., many integer codes [AS92]. Global scheduling techniques [Fis81, MLC+ 92, ME92] have been developed as a way to mitigate this e�ect; however, these techniques often su�er from ambiguous dependencies, unpredictable latencies, and safety issues that limit the extent of their e�ectiveness. Many of the limitations of compile-time scheduling can be overcome by using a dynamic scheduling approach. When processor progress is stalled due to a load delay (or other instruction delays), the dynamic scheduler selects another instruction from a window of available instructions or another independent thread of control. Examples of execution models that perform dynamic scheduling include Multiscalar [Fra93], decoupled [Smi82b], data ow [Vee86], and multi-threaded [LGN92, Smi81]. The best way by far to reduce load latency is to make memory access time zero by moving the accessed storage into a register. Register allocation is a well developed area and continues to progress. Current research centers on increasing the number of candidates for register allocation, e.g., register
6 allocation for subscripted variables [CCK90], and increasing the utilization of a nite collection of registers through techniques such as live-range splitting [BCT92] and load/store range analysis [KH92b]. Unfortunately, many program variables are still forced into memory, due to the limited size and addressability of register les. Cache misses are often a signi cant component of load latency, especially in numeric codes where data locality is low. Much work has been done to reduce both the latency and frequency of data cache misses. Approaches that work to reduce miss latencies include multi-level caches [JW94, BKW90, WBL89], victim caches [Jou90], and cache line prefetching [RL92, CBM+ 92, MLG92]. Non-blocking caches [FJ94, CB92, Con92, SF91] also help to reduce the impact of cache misses by letting other cache accesses complete while misses are serviced. Techniques that work to reduce the frequency of cache misses usually attack the problem of reducing con ict misses. Approaches along these lines include set-associative caches [KJLH89, Hea86, Smi82a], column-associative caches [AP93, AHH88], stride tolerant address mappings [Sez93, IL89, CL89], static [Kes91, DS91] or dynamic [BLRC94, LBF92, Kes91] page coloring, program restructuring [LRW91, Wu92, PH90, Fer76], and reference exclusion [McF92, CD89, ASW+ 93, Hsu94, Con92]. Even with the bevy of work already available to reduce the impacts of load latency, the problem continues to persist, partly because load latency continues to grow and partly because existing approaches have limited applicability or e�ectiveness.
1.4 Contributions of This Thesis This thesis contributes four novel load latency reduction techniques, each targeting a di�erent component of load latency: address calculation, data cache access, address translation, and data cache misses. Figure 1.4 shows the four contributions of this thesis and the load latency components that each addresses. The following subsections give a brief overview of each approach and key results of their evaluation.
1.4.1 Fast Address Calculation For many programs, especially integer codes, exposed load instruction latencies that hit in the data cache account for a signi cant portion of total execution time. For these codes, fast address calculation is an e�ective method to reduce load latency. The approach works to reduce load latency by allowing e�ective address calculation to proceed in parallel with data cache access, thereby eliminating the extra cycle required for address calculation. The technique employs a simple circuit to predict the portion of the e�ective address needed to read the data cache. If the address is predicted correctly, the cache access completes without an extra cycle for address calculation. If the address is mispredicted, the cache is accessed again using the correct
7 Fast Address Calculation
Zero−Cycle Loads
Align Load Hit Miss
Fetch Load
Identify Load
Read Base/Index Registers
Compute Effective Address
Arbitrate Adder/ Cache
High−Bandwidth Address Translation
Access Data Cache Translate Effective Address
Cache−Conscious Data Placement
Figure 1.4: Thesis Road Map. e�ective address. The predictor is designed to minimize its impact on cache access time, adding only a single OR operation before data cache access can commence. Veri cation of the predicted e�ective address is also very fast and decoupled from the cache access critical path, ensuring that pipeline control logic impacts are minimal. Detailed timing simulations of a 4-way in-order issue superscalar processor extended to support fast address calculation show this design is a good one, servicing enough accesses early enough to result in speedups for all the programs tested. Simulations found an average speedup of 14% for the integer codes and 6% for the oating point codes. The approach also responds well to software support. Compiler and linker support for fast address calculation was shown to signi cantly reduce the number of mispredictions, in many cases provide better program speedups and reduced cache bandwidth demand. Simulated performance with software support improved the average speedup to 19% for the integer codes and 7.5% for the oating point codes.
1.4.2 Zero-Cycle Loads Address calculation is typically one half of the latency for loads that hit in the cache. Zero-cycle loads extend the latency reduction a�orded by fast address calculation by combining it with an early-issue mechanism. The resulting pipeline designs are capable of completely hiding the latency of many loads that hit in the cache. Through the judicious application of instruction predecode, base register caching, and fast address calculation, it becomes possible to complete load instructions up to two cycles earlier than traditional
8 pipeline designs. For a pipeline with one cycle data cache access, loads can complete before reaching the execute stage of the pipeline, creating what is termed a zero-cycle load. A zero-cycle load allows subsequent dependent instructions to issue unencumbered by load instruction hazards, resulting in fewer pipeline stalls and increased overall performance. Two pipeline designs supporting zero-cycle loads are presented: an aggressive design for pipelines with a single stage of instruction decode, and a less aggressive design for pipelines with multiple decode stages. The designs are evaluated in a number of contexts: with and without software support, in-order vs. out-of-order issue, and on architectures with many and few registers. Programs running on a 4-way in-order issue processor simulator extended to support zero-cycle loads found an average speedup of 45% for the integer codes and 26% for the oating point codes. For the integer codes, program performance was on par with the speedups a�orded by an out-of-order issue processor model. Speedups on an out-of-order issue processor simulator extended to support zero-cycle loads were less due to the latency tolerating capability of the execution model. On architectures with few registers, the frequency of loads and their impact of program performance increases signi cantly. Providing an 8 register architecture with limited zero-cycle load support resulted in performance comparable to a 32 register architecture, suggesting that the approach may be able to negate the impacts of too few architected registers.
1.4.3 High-Bandwidth Address Translation Address translation is not generally thought of as a latency component of loads. The usual goal of address translation design is not to directly minimize load latency, but rather to keep address translation o� the critical path of data cache access. Typically, this task is accomplished by allowing data cache access and address translation to proceed in parallel using, for example, a virtually-indexed cache. The address translation mechanism is then constructed to be at least as fast as data cache access. However, this design strategy is becoming increasingly more di�cult. In an e�ort to push the envelope of system performance, microprocessor designs are exploiting continually higher levels of instruction-level parallelism, resulting in increasing bandwidth demands on the address translation mechanism. Most current microprocessor designs meet this demand with a multi-ported TLB. While this design provides an excellent hit rate at each port, its access latency and area grow very quickly as the number of ports is increased. As bandwidth demands continue to increase, multi-ported designs may soon impact memory access latency. To help meet these new demands, four new high-bandwidth address translation mechanisms are presented that feature latency and area characteristics that scale better than a multi-ported TLB design. Traditional high-bandwidth memory design techniques are extended to address translation, developing interleaved and multi-level TLB designs. In addition, two new designs crafted speci cally
9 for high-bandwidth address translation are introduced. Piggyback ports are proposed as a technique to exploit spatial locality in simultaneous translation requests, allowing accesses to the same virtual memory page to combine their requests at the TLB access port. Pretranslation is proposed as a technique for attaching translations to base register values, making it possible to reuse a single translation many times. Extensive simulation-based studies were performed to evaluate the proposed designs. Key system parameters, such as execution model, page size, and number of architected registers were varied to see what e�ects they had on the relative merits of each approach. A number of designs show particular promise. Multi-level TLBs with as few as eight entries in the upper-level TLB nearly achieve the performance of a TLB with unlimited bandwidth. Piggyback ports combined with a lesser-ported TLB structure, e.g., an interleaved or multi-ported TLB, also perform well. Pretranslation over a single-ported TLB performs almost as well as a same-sized multi-level TLB with the added bene t of decreased access latency for physically indexed caches.
1.4.4 Cache-Conscious Data Placement For many codes, the data cache miss component of load latency dominates all other memory access latencies. These codes often have working sets that are too large or lack the locality necessary for good data cache performance. In other cases, their reference streams perform poorly on commonly used cache geometries. Whatever the case may be, these programs spend much of their execution time waiting for cache misses to be serviced and can bene t greatly from optimizations designed to reduce the impact of data cache miss latencies. A software-based variable placement optimization, called cache-conscious data placement, is introduced as a technique for reducing the frequency of data cache misses. To apply the approach, a program is rst pro led to characterize how its variables are used. The pro le information then guides heuristic data placement algorithms in nding a variable placement solution that decreases predicted inter-variable con ict, and increases predicted cache line utilization and block prefetch. The generated placement solution is implemented partly at compile-time using a modi ed linker and partly at run-time with modi ed system libraries. Various placement strategies are developed and compared to the performance of natural placement (i.e., the layout of variables using the unmodi ed linker and system libraries). Random placement performed consistently worse than natural placement, revealing natural placement as an e�ective placement strategy that sets the bar for arti cial placement measures. Cache-conscious data placement improved cache performance for most of the programs tested, with many seeing more than a 10% reduction in data cache misses. A simpli ed and less expensive version of the placement algorithm (i.e., with reduced computation and storage requirements) lost the stability of the more complex algorithm, suggesting that for consistent performance improvements the more capable and expensive algorithm is
10 required. Run-time performance impacts were also examined for in-order and out-of-order issue processor models. Run-time performance improvements were small, especially for the out-of-order issue processor, because the processors were able to tolerate much of the data cache miss latency eliminated. However, the placement optimizations were able to eliminate a large fraction of the exposed data cache miss latency in many of the experiments.
1.5 Organization of This Thesis The remainder of thesis is organized as follows. Chapter 2 describes the experimental framework used throughout this thesis. Chapter 3 develops and analyzes fast address calculation. Chapter 4 examines and evaluates zero-cycle loads. Chapter 5 introduces new mechanisms for high-bandwidth and lowlatency address translation. Chapter 6 explores the use of cache-conscious data placement as a means to improve data cache performance. Finally, Chapter 7 gives conclusions and suggests future directions to explore. The appendices include a detailed description of the SimpleScalar architecture (used by the experimental framework) and detailed experimental results for Chapter 5.
Chapter 2
11
Experimental Framework This section details the experimental framework used for all the experiments in this thesis. Figure 2.1 illustrates the structure of the experimental framework.
2.1 Compiler Tools All experiments were performed with programs compiled for the SimpleScalar architecture. The SimpleScalar architecture is a superset of the MIPS-I instruction set [KH92a] with the following notable di�erences:
� There are no architected delay slots for loads, stores, or control transfers. � Loads and stores support additional addressing modes: indexed, auto-increment, and autodecrement, for all data types.
� SQRT implements single- and double-precision oating point square roots. � The architecture employs a 64-bit instruction encoding. The entire instruction set is detailed in Appendix A. As shown in Figure 2.1, C programs are compiled with a version of GNU GCC targeted to the SimpleScalar architecture. All programs are compiled with maximum optimization (-O3) and loop unrolling enabled (-funroll-loops). FORTRAN sources are compiled by rst converting them to C with AT&T's F2C compiler. GNU GCC produces SimpleScalar assembly les which are assembled with a version of GNU GAS assembler ported to support SimpleScalar assembly. The produced object les are compatible with the MIPS ECOFF object format. The programs are linked with GNU GLD. Standard library calls are implemented with a version of GNU GLIBC ported to support the SimpleScalar instruction set and POSIX Unix system calls.
2.2 Simulation Methodology The baseline simulator is detailed in Table 2.1. The simulator executes only user-level instructions, performing a detailed timing simulation of 4-way superscalar processor and the rst level of instruction
12 FORTRAN source C source f2c
GNU GCC Assembly source GNU GAS Object files
libc.a
GNU GLD
libm.a libF77.a
Executables SimpleScalar ISA + POSIX syscalls Simulation Suite Host (32+ bits,IEEE FP,POSIX Unix)
Figure 2.1: Experimental Framework. and data cache memory. Simulation is execution-driven, including execution down any speculative path until the detection of a fault, TLB miss, or misprediction. The simulator supports both in-order and out-of-order issue execution models. The in-order issue model provides no renaming and stalls whenever any data hazard occurs on registers. The out-of-order issue model employs a reorder bu�er to rename registers and hold results of pending instructions. Loads and stores are placed into a load/store queue. Stores execute when all operands are ready; their store values, if speculative, are placed into the load/store queue. Loads may execute when all prior store addresses have been computed; their values come from a matching earlier store in the store queue or from the data cache. Speculative loads may initiate cache misses if the address hits in the TLB. If the load is subsequently squashed, the cache miss will still complete. However, speculative TLB misses are not permitted. That is, if a speculative cache access misses in the TLB, instruction dispatch is stalled until the instruction that detected the TLB miss is squashed or committed. Each cycle the reorder bu�er commits completed instruction results in-order to the architected register le. When
13 Fetch Width Fetch Interface I-cache Branch Predictor
4 instructions able to fetch any 4 contiguous instructions per cycle 16k direct-mapped, 32 byte blocks, 6 cycle miss latency 1024 entry direct-mapped BTB with 2-bit saturating counters, 2 cycle misprediction penalty In-Order Issue in-order issue of up to 4 operations per cycle, out-of-order completion, Mechanism stalls on rst data hazard Out-of-Order Issue out-of-order issue of up to 4 operations per cycle, 16 entry reorder bu�er, Mechanism 8 entry load/store queue, loads execute when all prior store addresses are known Architected Registers 32 integer, 32 oating point Functional Units 4-integer ALU, 2-load/store units, 2-FP adders, 1-integer MULT/DIV, 1-FP MULT/DIV Functional Unit integer ALU-1/1, load/store-2/1, integer MULT-3/1, integer DIV-12/12, Latency (total/issue) FP adder-2/1, FP MULT-4/1, FP DIV-12/12 D-cache 16k direct-mapped, write-back, write-allocate, 32 byte blocks, 6 cycle miss latency, two read ports, one write port (e.g., dual-ported via replication), non-blocking interface, one outstanding miss per register, 6 cycle miss latency via a single-ported fully pipelined bus to main memory Store Bu�er 16 elements, non-merging
Table 2.1: Baseline Simulation Model. stores are committed, the store value is written into the data cache. The data cache modeled is dual-ported, direct-mapped, and non-blocking. Data cache bandwidth is limited, it can only service two loads or stores each cycle, either speculative or otherwise. For the in-order issue pipeline, cache writes are serviced in two cycles using a non-merging store bu�er. The store bu�er retires data written to the data cache during cycles it is unused. If a store executes and the store bu�er is full, the entire pipeline is stalled and oldest entry in the store bu�er is retired to the data cache.
2.3 Analyzed Programs Table 2.2 details the programs analyzed, the language they are written in, and their inputs and options. The top group are integer codes, the bottom group are oating point codes. Compress, Go, Perl, and Vortex are from the SPEC '95 benchmark suite [SPE95]. Elvis is a VI-compatible text editor performing textual replacements in batch mode. Ghostscript is a postscript viewer rendering a page with text and graphics to a PPM-format graphics le. Grep performs regular expression matches in a large text le. MPEG play is an MPEG compressed video decoder displaying a 79 frame compressed video le. TFFT performs real and complex FFTs on a randomly generated data set. YACR-2 is a VLSI channel router routing a channel with 230 terminals. The remaining benchmarks are from the SPEC92 benchmark suite [SPE91].
14
Benchmark Compress Elvis Eqntott Espresso GCC Ghostscript Grep Perl MPEG play Sc Xlisp YACR-2 Alvinn Doduc Ear Mdljdp2 Mdljsp2 Ora Spice2g6 Su2cor TFFT Tomcatv
Language C C C C C C C C C C C C C Fortran C Fortran Fortran Fortran Fortran Fortran Fortran Fortran
Input in unix.c int pri 3.eqn cps.in 1stmt.i fast-addr.ps 3x inputs.txt tests.pl coil.mpg loada1 li-input.lsp input2 doducin short.m22 mdlj2.dat mdlj2.dat greycode.in su2cor.in
Options/Modi cations %s/for/forever/g, %s/./& /g -dNOPAUSE -sDEVICE=ppm -c quit -E -f regex.in Short input (queens 8) NUM EPOCHS=50 args.short MAX STEPS=150 MAX STEPS=250 ITER=60800 .tran .7n 8n Short input MEXPONENT=20, ITER=1 N=129
Table 2.2: Benchmark Programs.
Chapter 3
15
Fast Address Calculation 3.1 Introduction All load instructions commence execution by computing the e�ective address of their access, i.e., the base register value plus the o�set or index register value. The latency of this operation, as shown in Figure 3.1a, is typically a single cycle in modern pipeline designs. For codes with an abundance of exposed load latency and good cache performance, e.g., many integer codes, e�ective address calculation latency can account for a signi cant portion of total execution time. This chapter focuses on a pipeline optimization, called fast address calculation, that reduces the latency of e�ective address calculation. The basic approach is illustrated in Figure 3.1b. The technique works by predicting early in the pipeline the e�ective address of a memory access and using the predicted address to speculatively access the data cache. A veri cation circuit determines if the address prediction is correct. If so, cache access is overlapped with non-speculative e�ective address calculation. Otherwise, the cache is accessed again in a later cycle using the correct e�ective address. For fast address calculation to work well, the predictor must be both fast and accurate. A fast predictor minimizes impact on data cache access latency and processor cycle time. An accurate predictor eliminates most address calculation latency. In Section 3.2, analyses of programs reveal reference characteristics that when combined with properties of on-chip data cache can be exploited to produce a predictor that is both fast and accurate. Section 3.3 details the predictor design. Section 3.3 also describes a prediction veri cation circuit that is both fast and decoupled from the cache access critical path, ensuring minimal impacts on pipeline control circuitry and processor cycle time. When fast address calculation does fail, its failure modes are few and easy to identify. Section 3.5 describes how simple software support can signi cantly reduce the number of address mispredictions. In Section Section 3.6 analysis of prediction failure rates and program speedups are presented. Finally, Section 3.7 lists related work, and Section 3.8 summarizes the chapter.
16 EX
MEM
Addr Calc
EX
Cache Access
2 Cycles
MEM
Addr Calc P r e d
Cache Access
Verify 1+
Cycles
a)
b)
Figure 3.1: Fast Address Calculation.
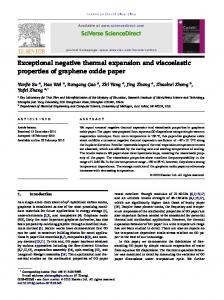
3.2 Program Reference Behavior Fast address calculation is best motivated by examining by examining the reference behavior of programs. The load instructions of several benchmarks (detailed in Chapter 2) compiled for the SimpleScalar architecture (detailed in Appendix A) were pro led. A number of key observations are made below.
3.2.1 Reference Type Three prevalent modes of addressing occur during execution: global, stack, and general pointer addressing. Table 3.1 details the dynamic number of loads and stores executed by each program and the dynamic breakdown by reference type for loads. Global pointer addressing is used to access small global (static) variables. The SimpleScalar (and MIPS) approach to global pointer addressing uses a reserved immutable register, called the global pointer, plus a constant o�set to access variables in the global region of the program's data segment [CCH+ 87]. The linker constructs the global region such that all variables referenced by name are grouped together near the target address of the global pointer. As shown in Table 3.1, global pointer addressing is prevalent in some programs, but not all. The frequency of this mode is highly dependent on the program structure and style. Stack pointer addressing is used to access elements of a function's stack frame. The stack pointer register holds an address to the base of the stack frame of the currently executing function. Accesses to frame elements are made using the stack pointer register plus a constant o�set. As is the case with global pointer addressing, stack pointer addressing is also a prevalent, but not an entirely dominating form of addressing.
17 Benchmark
Insts (Mil.)
Compress Eqntott Espresso Gcc Sc Xlisp Elvis Grep Perl YACR-2 Alvinn Doduc Ear Mdljdp2 Mdljsp2 Ora Spice Su2cor Tomcatv
61.5 875.7 474.4 121.7 840.1 965.2 249.3 122.2 203.6 386.8 1015.4 1597.2 338.4 729.1 874.4 1057.1 1250.6 796.1 464.2
Total Refs Loads (Millions) % % % Loads Stores Global Stack General 14.3 7.5 29.23 9.21 61.56 205.2 12.6 5.08 7.09 87.83 109.1 25.9 3.91 5.26 90.83 25.8 19.7 7.35 36.02 56.63 217.3 91.8 12.68 33.97 53.36 290.0 172.2 16.78 42.33 40.90 67.7 28.6 1.63 6.33 92.04 42.1 1.5 1.13 3.64 95.23 50.0 34.2 10.69 43.15 46.16 59.0 7.1 7.61 32.72 59.68 362.5 125.1 0.73 1.51 97.77 536.3 195.8 29.33 38.44 32.23 75.6 43.0 1.04 1.19 97.76 276.9 84.9 2.30 0.23 97.47 219.8 75.6 5.01 1.14 93.86 231.2 98.2 33.19 33.14 33.67 443.9 76.5 27.42 21.03 51.55 333.8 88.8 2.91 3.76 93.32 172.8 35.9 4.68 4.07 91.25
Table 3.1: Program Reference Behavior. The third mode of addressing, general pointer addressing, encompasses all other accesses. These accesses are the result of pointer and array dereferencing occurring during program execution. Quantitatively, all the benchmarks make heavy use of general pointer addressing with more than half of them using it for more than 80% of loads.
3.2.2 O�set Distribution A typical load instruction has two inputs: base and o�set. The base is added to the o�set during e�ective address computation. In the SimpleScalar architecture, the base is supplied by a register and the o�set may be supplied by either a signed 16-bit immediate constant, i.e., register+constant addressing, or via a register, i.e., register+register addressing. Figure 3.2 shows the cumulative size distribution of o�sets for the global, stack, and general pointer accesses of four benchmarks. (These curves are representative of the other benchmarks.) The graphs include loads using register+register addressing, in which case the base and o�set of the load are determined by compiler convention. The o�sets applied to the global pointer are typically quite large, being that they are partial addresses. As one would expect, there is a strong correlation between the size of the o�sets required and the aggregate size of the global data addressed by the program. Stack pointer o�sets tend to be large as well due to the large size of stack frames. While a stack frame may have only a few local variables, there are overheads not apparent to high-level language programmers which can greatly increase its size. These overheads include register save areas, dynamic
18 Global Pointer Offset Distribution 1 Gcc
0.9
Sc
0.8
Doduc
0.7 Spice
0.6 0.5 0.4 0.3 0.2 0.1 0
Neg 0
1
2
3
4
5
6
7
8
9
10 11 12 13 14 15 More
Offset size in bits
Stack Pointer Offset Distribution 1 Gcc
0.9
Sc
0.8
Doduc
0.7 Spice
0.6 0.5 0.4 0.3 0.2 0.1 0
Neg 0
1
2
3
4
5
6
7
8
9
10 11 12 13 14 15 More
Offset size in bits
General Pointer Offset Distribution 1 Gcc
0.9
Sc
0.8
Doduc
0.7 Spice
0.6 0.5 0.4 0.3 0.2 0.1 0
Neg 0
1
2
3
4
5
6
7
8
9
10 11 12 13 14 15 More
Offset size in bits
Figure 3.2: Load O�set Cumulative Distributions.
19 stack allocations, return address storage, among others. For general pointer accesses, most load o�sets are small. In fact, for a number of programs analyzed, e.g., GCC, zero was the most common o�set used. Zero o�sets are primarily the product of array subscript operations where strength reduction [ASU86] of the subscript expression succeeded, pointer dereferences to basic types (e.g., integers), and pointer dereferences to the rst element of a structured (record) variable. Non-zero o�sets arise from primarily three sources: structure o�sets, some array accesses, and array index constants. Structure o�sets are small constants applied to pointers when accessing elds of a structured variable. Array base addresses are combined with index values to implement array accesses, e.g., a[i]. The compiler used in this work, a port of GNU GCC to the SimpleScalar architecture, only generates this form of addressing when strength reduction of the subscript expression is not possible or fails. (When strength reduction is successful, a zero o�set su�ces.) Index constants are generated when part of an array subscript expression is constant, e.g., array[i+10]. In addition, the compiler creates many index constants when unrolling loops. Index constants are usually small, although when in the higher dimension of a multi-dimensional array, they can become large. For a few of the oating point programs, most notable Spice, there were a signi cant number of large o�sets. This result indicates strength reduction of array accesses was generally ine�ective. Consequently, the compiler had to rely on the brute force approach of adding the index variable to the base address of the array for every array access made, creating many large (index register) o�sets. Negative o�sets are usually small immediate constants, generated by negative array subscript constants. They occur infrequently for both the integer and oating point intensive programs, e.g. for GCC they account for 5.7% of the general pointer loads and about 3.2% of all loads. To summarize how these observations a�ect the design of an address predictor, it is clear that any prediction mechanism must: 1) perform well on all reference types, 2) perform well on small o�sets, and 3) perform well on large o�sets applied to the stack and global pointers. Secondary goals to good performance include support for predicting large index register o�sets and support for small negative o�sets. The following section presents a fast address calculation mechanism designed to satisfy these criteria while minimizing cost and pipeline impacts.
3.3 Fast Address Calculation The fast address calculation mechanism predicts e�ective addresses early in the pipeline, thereby allowing loads to commence execution and complete earlier. To accomplish this task, an organizational property of on-chip data caches is exploited. To minimize access time, on-chip caches are organized as wide two-dimensional arrays of memory cells (as shown in Figure 3.3). Each row of the cache array typically contains one or more data blocks
20 [WRP92, WJ94]. To access a word in the cache, the set index portion of the e�ective address is used to read an entire cache row from the data array and a tag value from the tag array. Late in the cycle, a multiplexor circuit uses the block o�set part of the e�ective address to select the referenced word from the cache row. At approximately the same time, the tag portion of the e�ective address is compared to the tag value from the tag array to determine if the access hit in the cache. Hence, on-chip cache organizations require the set index portion of the e�ective address early in the access cycle and the block o�set and tag portion late { after the cache row and tag have been read. The address prediction mechanism leverages this property of on-chip caches, allowing part of the address calculation to proceed in parallel with cache access. Figure 3.3 shows a straightforward implementation of the e�ective address prediction mechanism for an on-chip direct-mapped cache, targeting ease of understanding rather than optimal speed or integration. The set index portion of the e�ective address is supplied very early in the cache access cycle by OR'ing together the set index portion of the base and o�set. This operation implements a faster, carry-free form of addition, since it ignores any carries generated in or propagated into the set index portion of the address computation.1 Because many o�sets are small, the set index portion of the o�set will often be zero, allowing this computation to succeed. For larger o�sets, like those applied to the global or stack pointer, it is possible to employ software support to align pointer values, thereby increasing the likelihood that the set index portion of the base register value is zero. In parallel with access of the cache data and tag arrays, full adders are used to compute the block o�set and tag portion of the e�ective address. Later in the cache access cycle, the block o�set is used by the multiplexor to select the correct word from the cache row, and the tag portion of the e�ective address is compared to the tag value read from the tag array. Special care is taken to accommodate small negative o�sets. The set index portion of negative o�sets must be inverted, otherwise address prediction will fail. In addition, the prediction will fail if a borrow is generated into the set index portion of the e�ective address computation. The design assumes that o�sets from the register le arrive too late for set index inversion, thus address predictions for these loads and stores fail if the o�set is negative. This conservative design decision has little impact on the designs performance since negative index register o�sets are extremely infrequent. To complete the hardware design, the cache hit/miss detection logic is augmented with a circuit that veri es the predicted address. Using the result of this circuit, the cache controller and the instruction dispatch mechanism can determine if the access needs to be re-executed in the following cycle using the non-speculative e�ective address (computed in parallel with the speculative cache access). A misprediction is detected by looking for carries, either propagated into or generated in the set index part of the e�ective address computation. Four failure condition exist: 1) a carry (or borrow) is 1 Technically, a carry-free addition requires an XOR function, but use of a simpler inclusive OR su�ces here because the functions only di�er when address prediction fails.
0
0
1
31
S−1 S
Base
Base
Base
1 0
1 0
0
1
0
1
0
1
OFS
OFS
OFS
S
*
Base
OFS
OFS
Base S
*
+
CarryOut
Cout
+
OFS
Row Decoder NegFail
. . . . . .
Bitline Select/Sense Amps
GenCarry
Overflow
PredTag
BlockOFS
PredIndex
HIT
FAC_Valid
DATA
=
Sense Amps
. . . . . . .. . . . . . .
. . . . .
Tag Array
Data Array
. . . . . . . . .
Figure 3.3: Pipeline Support for Fast Address Calculation. Bold lines indicate a bus, gates with an `*' signify a replicated gate for every line of the connected bus. 2S is the size of a cache set in bytes, 2B is the block size. The architecture shown has 32-bit addresses.
31
30
S−1 S
B−1 B
0
Offset / Index
LargeNegConst
IndexReg
IndexReg
BaseReg
RegIndex/ConstOffset
31
30
S−1 S
B−1 B
0
Constant Offset
Register File / Forwarding Logic
B−1 B
0
Base Register
S
B
B
2 /2
8*2
21
22 propagated out of the block o�set portion of the e�ective address (signal Over ow in Figure 3.3), 2) a carry is generated in the set index portion of the e�ective address (signal GenCarry), 3) a constant o�set is negative and too large (in absolute value) to result in an e�ective address within the same cache block as the base register address (signal LargeNegConst), or 4) an o�set from the register le is negative (signal IndexReg).
3.3.1 Further Design Considerations The address prediction mechanism is designed to have minimal impact on the cache access critical path. The two typical cache access critical paths are denoted with bold dashed lines in Figure 3.3. While a much more detailed design would be required to demonstrate the exact impact the prediction mechanism has on the cache access critical path, it is possible point out a few design features of this circuit that indicate it should have minimal impact on cycle time. Three paths through the prediction circuit could a�ect the cache access cycle time. The rst is through the tag adder. The tag portion of the e�ective address computation must arrive at the tag comparator before the tag array output becomes stable. For small addresses and large cache set sizes, this computation will likely complete before tag comparison. For large addresses and small cache set sizes, this computation may not complete in time. For these designs, the logical OR operation used to compute the set index could also be used to compute the tag portion of the address. All the experiments in Section 3.6 were run with and without full addition capability in the tag portion of the e�ective address computation and this capability was found to be of limited value. This result is to be expected considering the relatively small size of load o�sets compared to cache set sizes, and the large alignments required on either the base or o�set for carry-free addition to succeed on the set index portion of the address computation but fail on the tag portion. The second path that could a�ect cycle time runs through the block o�set adder. This result must arrive at the data array multiplexor before the data array produces stable output. For most cache designs, a 4- or 5-bit adder should su�ce for this computation. The complexity of the block o�set adder is small, on the order of the cache row decoders, hence, this part of the design will likely not impact the cache access critical path. The third path that could a�ect cache access cycle time is through the prediction veri cation circuit. Since this circuit is completely decoupled from the normal cache access, it cannot a�ect the cache access cycle time as long as validation of the predicted e�ective address completes before the end of the clock cycle. This prediction veri cation signal, however, could a�ect processor cycle time if it is not available early enough to allow the processor control logic to schedule operations for the following cycle (a function of the success and failure of memory accesses in the current cycle). Since the veri cation circuit is very simple, it should have minimal impact on processor cycle time. The OR operation used to generate the upper portion of the e�ective address is, as shown in Figure
23 3.3, directly on the critical path of data cache access. The impact of this operation may or may not impact processor cycle time, depending on the speci cs of the pipeline design. In some designs, it may be possible to integrate the OR operation into the address decoder logic or the execute stage input latches, possibly reducing cycle time impact to zero. In any event, the predictor is only a single level of logic and should have minimal impact of cache access latency. The fast address generation mechanism assumes that data cache access can start as soon as the set index part of the e�ective address is available. If this is not the case, e.g., the cache is indexed with a translated physical address, fast address calculation will not work. Another important consideration is the handling of stores. If stores execute later in the pipeline than speculative loads, it becomes possible for memory operations to execute out of order, introducing the possibility of data dependencies through memory being violated. Many options exist to eliminate this problem, each with varying degrees of cost, complexity, and performance. The simplest approach for dealing with stores is to prevent loads from speculatively executing before than an earlier-issued, un nished store. This approach, while inexpensive in that it need only track the existence of un nished stores in the pipeline, limits performance due to the conservative assumption that all speculative loads and stores con ict. Many loads will be forced to wait for stores that do not con ict. A slightly more aggressive approach is to force loads and stores to execute in order, but permit stores to also use fast address calculation. Using this strategy, stores will complete earlier in the pipeline as well, reducing the frequency of stalled loads. Of course, this design must ensure that misspeculated stores can be undone. For designs employing a store bu�er [Jou93] and a two-cycle store sequence, this may not pose a problem. In the rst cycle, cache tags are probed to see if the access hits in the cache, in the second (possibly much later) cycle, the store is made to the cache. Since the fast address calculation mechanism determines the correctness of the address after one cycle, the store bu�er entry can simply be reclaimed or invalidated if the e�ective address is incorrect. A design similar to this one is adopted in the detailed timing simulator used in Section 3.6. The most ambitious approach is to check for possible con icts between loads and stores, and only stall loads that reference data produced by earlier-issued, un nished stores. This design will have the best performance, but also the highest cost and complexity since speculative load addresses must be compared against all earlier-issued, un nished stores. When store addresses are not known, loads must stall or execute with possibility of later recovery if a con ict does arise.
3.4 Working Examples Figure 3.4 shows a number of example address computations using fast address calculation. Example (a) shows a pointer dereference. Since the o�set is zero, no carry is generated during address calculation
24
(a)
load r3, 0(r8) r8 = offset = prediction = actual result =
0x0001ac00 0x00000000 0x0001ac00 0x0001ac00
000...01 000...00 000...01 000...01
10 00 10 10
10 00 10 10
1100 0000 1100 1100
0000 0000 0000 0000
0000 0000 0000 0000
(b)
load r3, 2436(gp) gp = 0x00010000 offset = 0x00000984 prediction = 0x00010984 actual result = 0x00010984
000...01 000...00 000...01 000...01
00 00 00 00
00 00 00 00
0000 1001 1001 1001
0000 1000 1000 1000
0000 0100 0100 0100
(c)
load r3, 102(sp) sp = 0x7fff5b84 offset = 0x00000066 prediction = 0x7fff5bea actual result = 0x7fff5bea
011...11 000...00 011...11 011...11
01 00 01 01
01 00 01 01
(d)
load r3, 364(sp) sp = 0x7fff5b84 offset = 0x0000016c prediction = 0x7fff5be0 actual result = 0x7fff5cf0
011...11 000...00 011...11 011...11
01 00 01 01
01 00 01 01
1011 1000 0100 0000 0110 0110 1011 1110 1010 1011 1110 1010 Generated Carry 1011 1000 0100 0001 0110 1100 1011 1110 0000 1100 1111 0000
Generated Propagated Carry Carry
Figure 3.4: Examples of Fast Address Calculation. The address bits are split into the tag, index and block o�set elds corresponding to a 16K byte direct-mapped data cache with 16 byte blocks. and the predicted address is correct. Example (b) shows an access to a global variable though the global pointer. In this example, the global pointer is aligned to a large power of two, so carry-free addition is su�cient to generate the correct address. In example (c), carry-free addition is su�cient to predict the portion of the address above the block o�set, but full addition is required to compute the block o�set. Since a carry in not generated out of the block o�set portion of the e�ective address computation, the prediction succeeds. Finally, example (d) shows a stack frame access with a larger o�set. In this case, the predicted address is incorrect because a carry is propagated out of the block o�set and generated in the set index portion of the e�ective address computation.
3.5 Increasing Prediction Performance with Software Support Software support can increase the prediction accuracy of fast address calculation by reducing the need for full-strength addition in the set index portion of the e�ective address calculation. This task is accomplished by decreasing the size of o�set constants and index register values, and by increasing the alignment of base register pointers. It is important to note, however, that software support is only used as a mechanism to improve performance, it is not required. As shown in Section 3.6, fast address calculation is a remarkably resilient mechanism, providing good speedups even without software support. Software support targets each reference type (i.e., global, stack, and general pointer), ensuring a high prediction accuracy for each.
3.5.1 Software Support for Global Pointer Accesses
25
Since the linker controls the value of the global pointer and o�sets applied to it, it is trivial to ensure all global pointer accesses are correctly predicted. The linker can limit all o�sets o� the global pointer to be positive and relocate the global region to an address starting at a power-of-two boundary larger than the largest o�set applied. Using this approach, carry-free addition will su�ce for any global pointer access.
3.5.2 Software Support for Stack Pointer Accesses As is the case with global pointer addressing, the compiler completely controls the value of the stack pointer and the organization of stack frames. By aligning the stack pointer and organizing the stack frame so as to minimize the size of o�set constants, it is possible to ensure that all stack pointer accesses are correctly predicted. The compiler can enforce a program-wide stack pointer alignment by initially aligning the stack pointer and then forcing all frame sizes to be a multiple of the alignment. Using this approach, carryfree addition will su�ce for address computations in which the o�set is smaller than the alignment of the stack pointer. Nearly all stack pointer addressing is performed on scalar variables. By sorting the elements of the stack frame such that the scalars are located closest to the stack pointer, the compiler can minimize the size of o�sets constants applied to the stack pointer. A few programs, most notably numeric codes, have functions with very large large stack frames that bene t little from a fairly small program-wide stack pointer alignment. For stack frames larger than the program-wide stack pointer alignment, the compiler can employ an alternative approach: the stack pointer can be explicitly aligned to a larger alignment by AND'ing the stack pointer with the adjusted power-of-two frame size times a negative one. Since this approach creates variable size stack frames, a frame pointer will be required for access to incoming arguments not in registers. In addition, the previous stack pointer value must be saved at function invocation and restored when the function returns. The impact of this approach is increased stack memory usage { frame size overheads can grow as much as 50%. If a program uses more memory, cache and virtual memory performance could su�er. The compiler should provide programmers with an option to limit stack pointer alignments, thereby providing a mechanism to control memory overhead.
3.5.3 Software Support for General Pointer Accesses For general pointer accesses, o�sets are typically small and positive, the result of index constants and structure o�sets. The compiler can increase the likelihood of a carry not being generated out of the
26 block o�set portion of the e�ective address by aligning variable allocations to a multiple of the target cache block size. For global and local variables, alignments can be increased to the next power-of-two larger than the size of the variable, bounded by the block size of the target cache. For dynamic storage allocations, alignments can be increased in the same manner by the dynamic storage allocator, i.e., malloc(). Since many languages, e.g., C, employ type-less dynamic storage allocation, the allocator lacks the type information required to minimize alignment overheads. Aligning any dynamic allocation to the maximum alignment required, i.e., the block size of the target cache, will ensure any alignments within the allocation are not perturbed. Alloca() allocations (used heavily by the benchmarks GCC and Grep) can employ a similar approach for dynamic storage allocation within stack frames. To encourage proper alignments of interior objects, e.g., array elements, the compiler can increase the size of array elements to the next larger power of two, bounded by the block size of the target cache. Since basic types, e.g., integers and oats, are already a power of two in size, overheads will only be incurred for arrays of structured variables. The compiler need not, however, enforce stricter alignments on structure elds, as this would serve to spread out elements of a structure. Experimental results to date have indicated that dense structures is consistently a bigger win than stricter alignments within structured variables. As is the case with larger stack frame alignments, these techniques can increase memory usage by as much as 50%. Hence, a compiler option should be available to limit the alignments placed on variable addresses and sizes. In addition to the changes described above, modi cations made to existing optimization routines can also improve the performance of optimized code. Speci cally, common subexpression elimination (CSE) should give preference to aligned pointer subexpressions. In addition, the address cost function used by the strength-reducer should make register+register addressing seem very expensive. This change will make the compiler work harder to strength-reduce loop induction variables, resulting in more zero-o�set loads and stores within loops.
3.6 Experimental Evaluation This section evaluates the e�ectiveness of fast address calculation by examining the performance of programs running on a detailed timing simulator of a 4-way in-order issue processor extended to support fast address calculation. The performance of programs is examined in a number of contexts: with and without software support, with and without register+register addressing mode speculation, and with varied cache block sizes.
27
3.6.1 Methodology
All experiments were performed on the baseline in-order issue timing simulator detailed in Chapter 2. The simulator implements a detailed timing model of a 4-way in-order issue superscalar processor and the rst level of instruction and data cache memory. The simulator implements a traditional ve stage pipeline, i.e., all ALU and memory operations begin execution in the third stage of the pipeline (EX), and non-speculative loads and stores execute in the fourth stage (MEM), resulting in a non-speculative load latency of 2 cycles. The data cache modeled is a dual-ported 16k direct-mapped non-blocking cache. Stores are serviced in two cycles using a 16-entry non-merging store bu�er. A number of modi cations were made to the simulator to support fast address calculation. Loads may speculatively access the data cache using fast address calculation given that there are no un nished stores in the pipeline. To reduce the number of stalled loads, stores are also allowed to utilize fast address calculation to speed their execution. When executed speculatively, a store is entered into a store bu�er. If the store address is mispredicted, the store is re-executed and its address in the store bu�er is updated. When fast address calculation fails (in the EX stage of the modi ed pipeline), the access can re-execute in the following cycle (in the MEM stage). All programs were compiled for the SimpleScalar architecture (detailed in Appendix A). Compiler support for fast address calculation, as described in Section 3.5, was added to GNU GCC, linker support was added to GNU GLD. The following fast address calculation speci c optimization were applied to both the programs and the system libraries (e.g. libc.a): Global pointer alignment: The linker, GNU GLD, aligned the global pointer to a power-of-two value (unbounded) larger than the largest o�set applied to it. All global pointer o�sets were restricted to be positive. (Normally, the initial value of the global pointer is dependent on the size of the data segment and is not aligned.) Stack pointer alignment: The compiler, GNU GCC, rounded all stack frame sizes up to the next multiple of 64 bytes, resulting in a program-wide stack pointer alignment of 64 bytes. (Normally, GCC maintains an 8 byte alignment on the stack pointer.) Frames larger than 64 bytes enforce larger stack pointer alignments of up to 256 bytes by explicitly aligning the stack pointer on function invocation and restoring the original value on function return. Static variable alignments: Static allocations were placed with an alignment equal to the next powerof-two larger or equal to the size of the variable, not exceeding 32 bytes. Dynamic variable alignments: default of 8 to 32 bytes.
malloc()
and
alloca()
allocation alignments were increased from the
Structured variable alignments: Internal structure o�sets were not changed, however, structure sizes were increased to the next power-of-two larger than or equal to the normal structure size, with
28 Program Compress Eqntott Espresso Gcc Sc Xlisp Elvis Grep Perl YACR-2 Alvinn Doduc Ear Mdljdp2 Mdljsp2 Ora Spice Su2cor Tomcatv
Insts Cycles Loads Stores Miss Ratio Mem Usage (Mil.) (Mil.) (Mil.) (Mil.) I-cache D-cache (K bytes) 61.5 58.4 14.3 7.5 0.00 15.65 438 875.7 627.4 205.2 12.6 0.00 4.70 2704 474.4 374.0 109.1 25.9 0.16 2.54 400 121.7 109.5 25.8 19.7 1.63 3.09 1416 840.1 811.3 217.3 91.8 0.17 7.11 493 965.2 850.6 290.0 172.2 0.71 1.72 115 249.3 207.1 67.7 28.6 0.50 0.44 90 122.2 139.0 42.1 1.5 0.03 3.88 377 203.5 214.4 50.0 34.2 3.63 4.63 3625 386.9 261.0 59.0 7.1 0.01 0.67 195 1015.4 1236.2 362.5 125.1 0.02 4.21 507 1597.2 1820.5 536.3 195.8 1.55 2.26 144 338.4 416.5 75.6 43.0 0.00 0.02 208 729.1 787.3 276.9 84.9 0.00 1.52 267 874.4 1110.7 219.8 75.6 0.00 1.52 227 1057.1 1112.9 231.2 98.2 0.00 0.33 50 1250.6 1388.9 443.9 76.5 0.36 10.16 3227 796.1 1073.3 333.8 88.8 0.08 23.55 4131 464.2 431.6 172.8 35.9 0.01 8.63 945
Table 3.2: Program Statistics without Software Support. the overhead not exceeding 16 bytes. The analyzed programs include both integer and oating point codes. Table 3.2 lists the programs analyzed and their baseline execution statistics without software support. The integer codes are in the top group, the oating point codes in the bottom group. The benchmarks are detailed in Chapter 2. Shown are the number of instructions, execution time in cycles on the baseline simulator (i.e., a 4-way in-order issue superscalar processor without fast address calculation support), total loads and stores executed, instruction and data cache miss ratios for 16k byte direct-mapped caches with 32 byte blocks, and total memory size.
3.6.2 Prediction Performance Figure 3.5 shows the prediction failure rates for loads with a 32 byte cache block size, i.e., the case where the prediction circuitry is able to perform 5 bits of full addition in the block o�set portion of the e�ective address computation. The gure shows the failure rates as a percentage of total speculated accesses when running with only fast address calculation hardware support (i.e., H/W), with hardware and software support (i.e., H/W+S/W), and with hardware and software support but no speculation of register+register mode accesses (i.e., H/W+S/W - R+R). Without any software support, the percentage of incorrect predictions is quite high, suggesting that many pointers are insu�ciently aligned to allow for carry-free addition in the set index part of the e�ective address calculation. Some of the programs, however, have very low prediction failure rates, e.g., Elvis and Alvinn. For these programs, the frequency of zero-o�set loads is very high, indicating
Failed Predictions (percent of total)
29 100 90 80 70 60 50 40 30 20 10 0
Comp Esp Sc Elv Perl Alvinn Ear Sp2 Spc Tomc Eqn Gcc Xli Grep YACR Dod Dp2 Ora Su2 H/W
H/W+S/W
H/W+S/W - R+R
Figure 3.5: Prediction Performance. The cache block size is 32 bytes, i.e., the predictor supports 5 bits of full addition in the block o�set portion of the address computation.
that prediction is working fairly well because e�ective address computation is not required. Prediction performance with 16 byte blocks was also examined (detailed results can be found in an earlier paper on fast address calculation [APS95]). Overall the prediction failure rate decreased slightly when the block size increased, since misaligned pointers bene ted from more full addition capability in the fast address calculation mechanism. As Figure 3.5 shows, software support was extremely successful at decreasing the failure rate of e�ective address predictions. Compared to the prediction failure rates without software support, the percentage of loads and stores mispredicted is consistently lower, the prediction failure rate decreasing by more than 50% in many cases. Even with software support, a number of the programs, e.g. Spice and Tomcatv, still possessed notably high address misprediction rates. To better understand their cause, loads and stores were pro led to determine which were failing most. The two dominating factors leading to address prediction failures were: Array index failures: Many loads and stores using register+register addressing resulted in failed predictions. The compiler only uses this addressing mode for array accesses, and then only when strength-reduction fails or is not possible, e.g., an array access not in a loop. (If strength-reduction is successful, a zero-o�set load or store su�ces.) As one would expect, array index values are
30 Benchmark Compress Eqntott Espresso Gcc Sc Xlisp Elvis Grep Perl YACR-2 Alvinn Doduc Ear Mdljdp2 Mdljsp2 Ora Spice Su2cor Tomcatv
Insts Cycles Loads Stores % % % % Change Change Change Change -0.38 +0.50 +0.00 -0.01 +0.40 +0.15 +1.39 -0.04 -0.33 -0.59 -0.01 -0.03 +0.86 +1.76 +1.01 +0.90 -0.06 +0.12 -0.01 -0.02 -0.09 +0.80 -0.12 -0.08 -0.17 +0.27 -0.30 -0.36 -0.72 -1.14 -0.95 -24.82 -0.95 +0.22 -0.53 +0.71 +0.42 -0.17 +2.33 -0.01 +0.12 -0.03 -0.01 -0.00 +0.13 +0.21 +0.06 -0.25 +0.04 +0.09 +0.18 -0.02 +0.02 -0.34 +0.05 -0.00 -0.07 +0.03 +0.10 +0.01 +0.24 +1.51 +0.00 +0.00 -0.13 +0.46 +0.12 +0.01 +0.59 +0.54 +0.24 +0.51 +0.00 +0.03 -0.00 +0.00
Miss Ratio Mem Change Usage I-cache D-cache %Change -0.00 +0.00 +1.14 -0.00 +0.00 +0.11 -0.00 -0.00 +13.25 -0.02 +0.00 +1.20 -0.00 +0.00 +1.01 -0.01 +0.00 +15.65 -0.01 -0.00 +1.11 -0.00 -0.00 +3.18 -0.04 +0.01 +20.03 -0.00 -0.00 +0.00 -0.00 -0.00 +0.20 -0.02 -0.00 +2.78 -0.00 +0.00 +2.40 -0.00 -0.00 +1.87 -0.00 +0.00 +0.44 -0.00 +0.00 +10.00 -0.00 +0.00 +0.28 -0.00 -0.00 +0.12 -0.00 +0.00 +0.32
Table 3.3: Program Statistics with Software Support. typically larger than the 32 byte alignment placed on arrays, resulting in high prediction failure rates. The bars labeled \H/W+S/W - R+R" in Figure 3.5 show the prediction failure rate for all loads and stores except those using register+register mode addressing. For many programs, array index operations are clearly a major source of mispredicted addresses. Domain-speci c storage allocators: A number of programs, most notably GCC, used their own storage allocation mechanisms, this led to many pointers with poor alignment and increased prediction failure rates.
These factors, however, are not without recourse. A strategy for placement of large alignments could eliminate many array index failures; for example, in the case of Spice aligning a single large array to its size would eliminate nearly all mispredictions. In addition, program tuning could rectify many mispredictions due to domain-speci c allocators. Table 3.3 shows the program statistics for the benchmarks compiled with software support. The table lists the percent change in instruction count, cycle count (on the baseline simulator without fast address calculation), number of loads and stores, and total memory size with respect to the program without fast address calculation optimizations (the results in Table 3.2). For the instruction and data cache (16k byte direct-mapped), the table lists the absolute change in the miss ratio. Generally, fast address calculation speci c optimizations did not adversely a�ect program performance on the baseline simulator. The total instruction count as well as the number of loads and stores executed are roughly comparable. The cycle count di�erences (without fast address calculation
31 support) were small; the largest di�erence was 1.76% more cycles for GCC. Cache miss ratios saw little impact for both the instruction and data caches. Total memory usage was also examined, as it is an indirect metric of virtual memory performance. The largest increases experienced were for Perl, Espresso, and Xlisp where memory demand increased by as much as 20%. However, the absolute change in memory consumption for these programs was reasonably small, much less than a megabyte for each. In addition, we examined TLB performance running with a 64 entry fully associative randomly replaced data TLB with 4k pages and found the largest absolute di�erence in the miss ratio to be less than 0.1% (for Perl). Given these metrics, fast address calculation speci c optimizations are not expected to adversely impact program performance when executing on a machine without fast address calculation support.
3.6.3 Program Performance Prediction performance does not translate directly into program run-time improvements. A successful e�ective address prediction may or may not improve program performance, depending on whether or not the access is on the program's critical path. To gauge the performance of fast address calculation in the context of a realistic processor model, baseline program performance was compared to the performance of programs running on the baseline timing simulator extended to support fast address calculation (detailed in Section 3.6.1). Figure 3.6 shows execution speedups as a function of three design parameters: with and without software support, with 16 and 32 byte blocks, and with and without register+register mode speculation. Also shown are the average speedups for the integer and oating point codes, weighted by the run-time (in cycles) of the program. All speedups are computed with respect to the execution time (in cycles) of the baseline program (no fast address calculation speci c optimizations) running on the baseline simulator. On the average, fast address calculation without software support improves the performance of integer programs by 14%, largely independent of block size or speculation of register+register mode accesses. The oating point programs show a smaller speedup of 6%. This is a very positive result { even without software support, one could expect program performance to consistently improve, and by a sizable margin for integer codes. The combination of software and hardware manages to give somewhat better performance improvements. An average speedup of 19% was found for the integer codes, with no individual program speedup less than 6%. For the oating point programs, speedups were smaller in magnitude with an average of 7.5%. The compiler optimizations have a positive e�ect on most programs, and tend to assist more where the hardware-only approach is ine�ective, (e.g., Compress). The consistent speedup across all programs is a very important property of fast address calculation for it allows the designer a trade-o� between a longer cycle time and increased performance for integer
32 1.45
1.4
1.35
Speedup
1.3
1.25
1.2
1.15
1.1
1.05
1 Compress Espresso Sc Elvis Perl Int-Avg Eqntott Gcc Xlisp Grep YACR-2
H/W, 16 byte block
H/W+S/W, 16 byte
Doduc Mdljdp2 Ora Su2cor FP-Avg Alvinn Ear Mdljsp2 Spice Tomcatv
H/W, 32 byte
H/W+S/W, 32 byte
Figure 3.6: Speedups, with and without Software Support. Speedups shown are over baseline model execution
time for a 16K byte data cache with 16 and 32 byte blocks. The dashed bars indicate where there was improvement with register+register mode speculation.
programs. For example, if fast address calculation increases the cycle time by 5%, the average oating point performance will still improve slightly while the average integer performance will improve by a sizable 13.5%. All simulations were run with both 16 and 32 byte cache blocks, i.e. where the prediction circuitry is able to perform 4 or 5 bits of full addition in parallel with cache access, respectively. The impact of increasing the block size was positive but small in magnitude for most programs, resulting in an overall di�erence of less than 3% for all experiments. In all cases, the improvement in the average performance was less than 1%. Considering the prediction failure rate of register+register mode addressing, program performance was examined with and without speculation of this mode. The only programs which experienced any change in performance were Compress, Espresso, and Grep. Grep's stellar performance improvement is the result of many register+register accesses to small arrays which bene t from limited full addition in the block o�set portion of address computation. Average speedup increased less than 1% for the integer codes and was unchanged for the oating point codes. The overall lackluster improvement is the result of high failure rates when predicting register+register mode addresses. Without a means to e�ectively predict register+register mode loads and stores, their speculation appears to have little overall bene t, especially in light of increased demand on cache bandwidth.
33 Benchmark Compress Eqntott Espresso Gcc Sc Xlisp Elvis Grep Perl YACR-2 Alvinn Doduc Ear Mdljdp2 Mdljsp2 Ora Spice Su2cor Tomcatv
R+R Speculation No R+R Speculation H/W only H/W + S/W H/W only H/W + S/W 24.21 16.47 8.92 +0.00 3.02 1.40 2.95 1.33 5.38 3.06 3.95 2.01 20.85 7.26 20.31 6.65 13.10 2.71 13.10 2.65 17.43 1.17 17.43 1.17 2.49 1.31 2.46 1.04 2.63 1.10 1.94 0.40 19.40 7.98 18.55 7.41 5.07 3.87 4.68 3.49 1.33 1.00 1.33 1.00 22.68 13.49 17.37 7.28 8.95 10.32 8.95 10.32 21.11 19.56 7.06 3.28 18.81 16.32 2.68 +0.00 24.72 14.03 21.03 10.97 45.86 32.44 7.46 3.07 19.92 20.33 7.65 5.72 32.52 33.56 4.22 2.77
Table 3.4: Memory Bandwidth Overhead. The numbers shown are the total failed speculative cache accesses as a percentage of total references.
Table 3.4 shows the increase in the number of accesses to the data cache (in percent of total accesses without speculation). These numbers re ect memory accesses that were mispredicted and actually made during execution; in other words, these results are the overhead in cache accesses due to speculation. Without compiler support, a large fraction of the speculative memory accesses are incorrect (as shown in Figure 3.5), requiring more cache bandwidth, as much as 45% for Spice. The compiler optimizations cut down this extra bandwidth signi cantly. For most programs the increase in the required cache bandwidth is less than 10%, and the maximum increase in bandwidth is less than 34%; without register+register mode speculation the bandwidth increases are at most 11%. Despite the increase in cache accesses due to speculation, the impact of store bu�er stalls was surprisingly small, typically less than a 1% degradation in the speedups attained with unlimited cache store bandwidth. (The results in Figure 3.6 include the performance impact of store bu�er stalls.)
3.7 Related Work Golden and Mudge [GM93] explored the use of a load target bu�er (LTB) as a means of reducing load latencies. An LTB, loosely based on a branch target bu�er, uses the address of a load instruction to predict the e�ective address early in the pipeline. They conclude the cost of the LTB is only justi ed when the latency to the rst level data cache is at least 5 cycles. Fast address calculation has two distinct advantages over the LTB. First, it is much cheaper to implement, requiring only a small adder circuit and a few gates for control logic. Second, it is more accurate at predicting e�ective addresses
34 because it predicts addresses using the operands of the e�ective address calculation, rather than the address of the load. In addition, fast address calculation employs compile-time optimization to further improve performance. An earlier paper by Steven [Ste88] goes as far as proposing a four stage pipeline that eliminates the address generation stage and executes both memory accesses and ALU instructions in the same stage. Steven proposes the use of an OR function for all e�ective address computation. Steven's approach was only intended as a method for speeding up stack accesses, all other accesses require additional instructions to explicitly compute e�ective addresses. The performance of this pipeline organization was not evaluated. AMD's K5 processor [Sla94] overlaps a portion of e�ective address computation with cache access. The lower 11 bits of the e�ective address is computed in the cycle prior to cache access. The entire 32 bit e�ective address is not ready until late into the cache access cycle, just in time for the address tag check. The idea of exploiting the two-dimensional structure of memory is being used in several other contexts, such as paged mode DRAM access [HP90]. Katevenis and Tzartzanis [KT91] proposed a technique for reducing pipeline branch penalties by rearranging instructions so that both possible targets of a conditional branch are stored in a single instruction cache line. The high bandwidth of the cache is used to fetch both targets of a branch instruction. The branch condition is evaluated while the instruction cache is accessed and the condition outcome is used to late-select the correct target instruction.
3.8 Chapter Summary This chapter presented the design and evaluation of fast address calculation, a novel approach to reducing the latency of load instructions. The approach works by predicting early in the pipeline the e�ective address of a memory access and using the predicted address to speculatively access the data cache. If the prediction is correct, the cache access is overlapped with non-speculative e�ective address calculation. Otherwise, the cache is accessed again in the following cycle, this time using the correct e�ective address. The predictor's impact on the cache access critical path is minimal. The prediction circuitry adds only a single OR operation before cache access can commence. In addition, veri cation of the predicted e�ective address is fast and completely decoupled from the cache access critical path. Detailed timing simulations show that without software support the prediction accuracy of the basic hardware mechanism varies widely. For the programs examined, prediction success rates ranged from 13 to 98%. However, detailed timing simulations of the programs executing on a superscalar processor resulted in consistent program speedups { an average speedup of 14% for the integer codes and 6%
35 for the oating point codes. With the addition of simple compiler and linker support, prediction accuracy increased signi cantly, with success rates ranging from 62 to 99%. Simulated performance with software support increased as well, resulting in average speedup of 19% for the integer codes and 7.5% for the oating point codes. Increases in cache bandwidth demand due to speculation were also measures found to be generally very low. With software support, speculation required at most 34% more accesses. By preventing register+register addressing mode speculation, extra cache bandwidth requirements drop to at most 11% more accesses, with little impact on overall performance. The consistent performance advantage of fast address calculation coupled with the low cost of its use, in terms of hardware support, software support, and cache bandwidth demand, should makes the approach an attractive option for reducing load latency.
Chapter 4
36
Zero-Cycle Loads 4.1 Introduction In the previous chapter, fast address calculation (illustrated in Figure 4.1a) was introduced as a technique to overlap address calculation with data cache access, thereby eliminating the extra cycle needed for address calculation. For most pipeline designs, address calculation latency comprises at most half of the latency of loads that hit in the data cache, leaving one or more cycles of data cache access latency still exposed to extend execution critical paths or stall instruction issue. In this chapter, the latency reduction capability of fast address calculation is extended by combining it with an early-issue mechanism, reducing load latency by yet another cycle. As shown in Figure 4.1b, the approach allows loads to complete up to two cycles earlier than traditional designs. These loads, termed zero-cycle loads because they have no visible latency to dependent instructions, produce a result by the time they reach the execute stage of the pipeline. Subsequent dependent instructions can enter the execute stage of the pipeline at the same time unencumbered by load instruction hazards. Programs executing on a processor with support for zero-cycle loads will experience signi cantly fewer pipeline stalls due to load instructions and increased overall performance. Design of the early-issue mechanism is particularly challenging since it must eliminate one cycle from the time taken to fetch and decode loads and read their register le operands. Instruction cache predecode is used to speed up fetch and decode, permitting these operations to occur when loads are placed in the instruction cache. A base register cache provides early access to register le operands. Even with this support, however, not all loads can execute with zero latency. The early-issue mechanism introduces new register and memory hazards, and fast address calculation will occasionally fail. To ensure correct program execution, the design must also include mechanisms to detect and recover from failed accesses. The rest of this chapter explores the pipeline support needed to implement zero-cycle loads and evaluates their e�ectiveness in reducing the impact of load latency. Section 4.2 proposes two pipeline designs that support zero-cycle loads: an aggressive design for pipelines with a single stage of instruction decode, and a less aggressive design for pipelines with multiple decode stages. Section 4.4 presents results of simulation-based studies of the proposed designs. Program performance is examined in a number of contexts: with and without software support, in-order vs. out-of-order issue, and on
37 ID
EX
ID
Addr Calc P r e d
Cache Access
Verify
EX
Addr Calc P r e d
Result "forwarded" to dependent instructions with zero visible latency
Cache Access
Verify
1+
Cycles
1+
a)
Cycles b)
Figure 4.1: Zero-Cycle Loads. architectures with many and few registers. Section 4.5 describes related work, and nally, Section 4.6 summarizes the chapter.
4.2 Zero-Cycle Loads 4.2.1 Implementation with One Decode Stage Completing a load by the beginning of the execute stage in a pipeline with only one decode stage is a very challenging task { the load instruction must be fetched, decoded, and executed (including memory access) in only two pipeline stages. Assuming data cache access takes one cycle, all preceeding operations must complete in only a single cycle. Figure 4.2 shows one approach to implementing zero-cycle loads in an in-order issue pipeline with a single decode stage.
Fetch Stage Organization In the fetch stage of the processor, the instruction cache and base register and index cache (or BRIC) are accessed in parallel with the address of the current PC. The instruction cache returns both instructions and predecode information. The predecode information is generated at instruction cache misses and describes the loads contained in the fetched instructions. The predecode data is supplied directly to the pipes which execute loads, permitting the tasks of fetching, identifying, and aligning loads to complete by the end of the fetch stage. The predecode data for each load consists of three elds: the addressing mode, base register type, and o�set. The addressing mode eld speci es either a register+constant or register+register addressing (if supported in the ISA). The base register type is one of the following: SP, GP, or Other. SP and GP loads use the stack or global pointer [CCH+ 87] as a base register, respectively. Loads
38 Fetch
Decode
PC
Execute
IR I−Cache
predecode
Mode Type
Other Operand
Offset
Offset
Index
BRIC
Base Base
Result Operand F Forward A D−Cache (Bypass) C Logic
A L U
SP GP
Figure 4.2: Pipelined Implementation with One Decode Stage. marked \Other" use a register other than the stack or global pointer as a base register. The o�set eld speci es the o�set of the load if it is contained as an immediate value in the instruction. Predecode costs will vary depending on the speci cs of the instruction set, and pipeline and cache designs. For the pipeline shown in Figure 4.2, the predecode information for a single load is 19 bits (assuming an o�set of 16 bits). The number of predecode packets attached to an instruction in the data cache depends on the speci cs of the pipeline and cache designs. If the necessary network is available to collect predecode from all instructions fetched, only one packet of predecode information is required per instruction. This design would have an instruction cache data array overhead of about 60%, although total cache overheads would be lower because the tag array size would not increase. Without the capability to collect predecode from fetched instructions, predecode for all subsequent loads (that can issue together) must be attached to each instruction in the cache. For a pipeline that can issue two loads per cycle, the predecode overhead would double to 120%. With more time to decode instructions and with more sophisticated pipeline and cache cache designs, predecode costs will decrease. The BRIC is a small cache indexed by the address of a load, producing a register pair: the base register value and the index register value (unused if a register+constant mode load). During execution, the BRIC builds an association between the address of loads executed and their base and index register values. This address-to-register value association allows register access to complete by the end of the fetch stage of the pipeline. If the BRIC misses, an entry is replaced after the base and index register values have been read from the integer register le. As shown in Section 3.2, loads that use the stack or global pointers are executed quite frequently. The e�ective capacity of the BRIC can be increased by using an alternate means to supply these loads
39 with a base register value. As illustrated in Figure 4.2, two registers are used to cache copies of the global and stack pointer values. When an access is made, the type eld of the predecode data is used to select the correct base register source. Any cached register value must be updated whenever the corresponding register le value is updated. Since multiple loads may be using the same base and index registers, a value written into the BRIC may have to be stored into multiple locations. Consequently, the BRIC is a complex memory structure, supporting multiple access ports and multi-cast writes. The BRIC will not have to be very large before its access time impacts processor cycle time, hence, only small BRIC sizes are considered { on the order of 4-64 elements. It is also possible to implement zero-cycle loads without a BRIC, a con guration particularly useful to programs with a high frequency of global and stack pointer accesses.
Decode Stage Organization In the decode stage of the pipeline, the base register and o�set pair produced in the fetch stage are combined using fast address calculation (represented by the box labeled FAC in Figure 4.2), and the data cache is accessed. The pipeline organization in Figure 4.2 requires two new data paths (per pipe). A path must be added to allow forwarding of register values from the BRIC directly to the data cache. This path does not normally exist on traditional pipeline organizations as all values from the fetch/decode stages of the pipeline will rst pass through the execute stage before arriving at the data cache ports. In addition, the data path used to write register values to the register le must also be extended to supply register values to the BRIC. All other data paths used to facilitate zero-cycle loads, i.e., D-cache to ALU, ALU to D-cache, ALU to ALU, and D-cache to D-cache, already exist in traditional pipeline organizations.
Pipeline Control As with most pipeline optimizations, the brunt of the complexity is placed on the pipeline control circuitry. The following logic equation summarizes the condition under which a zero-cycle load will succeed:
ZCL V alid
BRIC Hit ^ FAC V alid ^ Port Allocated ^ DCache Hit ^ Reg Interlock ^ Mem Interlock
BRIC Hit indicates if the load address hit in the BRIC. FAC V alid indicates if fast address calculation succeeded. Fast address calculation succeeds when
no carries are propagated into or generated in the set index part of the e�ective address computation. (The veri cation circuit is shown in the lower portion of Figure 3.3 in Chapter 3.) Port Allocated indicates if a data cache port is available for the speculative load. This signal is
40 required because accessing the data cache from multiple pipeline stages provides more points of access to the data cache than ports available, necessitating port allocation on a per cycle basis. DCache Hit indicates if the load hit in the data cache. Reg Interlock indicates whether a data hazard exists between the base and index register values used by the zero-cycle load and the register results of earlier-issued, un nished instructions. Mem Interlock is analogous to Reg Interlock, but detects hazards through memory. A hazard through memory occurs whenever an earlier-issued, un nished store con icts with the zero-cycle load. The approaches proposed in Section 3.3.1 to detect load/store con icts will work here as well. If a zero-cycle load is not possible or fails due to a mispredicted e�ective address, there are a number of options available for recovery. If the BRIC misses, the register values read in the decode stage of the pipeline can be used to re-execute the access using fast address calculation in the execute stage of the pipeline. If successful, the load will complete in one cycle. If fast address calculation fails, a non-speculative e�ective address can be computed in the execute stage of the pipeline, with subsequent data cache access in the memory stage. Alternatively, if an adder is available for use in the decode stage of the pipeline, non-speculative e�ective address could be performed on the register values from the BRIC, and the failed access could be re-executed in the execute stage of the processor. If an interlock condition exists, the load must stall until it clears, at which point the access can proceed, possibly employing fast address calculation if the interlock condition clears before address generation completes. In the worse case, the BRIC will miss, forcing re-execution in the execute stage, where fast address calculation will fail, resulting in re-execution in the memory stage of the processor { a worse case latency of two cycles (given that mispredictions can be recovered in the following cycle and there is su�cient data cache bandwidth). In some designs, it may be possible to detect a failure condition early enough to prevent a speculative access. These pipelines will bene t from less wasted data cache bandwidth. For the one decode stage design, it is assumed a BRIC miss or failure to arbitrate a data cache port are the only conditions that can elide a data cache access. While conservative, this strategy ensures that failure detection logic is both simple and fast, resulting in minimal impact on pipeline control critical paths and processor cycle time.
4.2.2 Implementation with Multiple Decode Stages The increased complexity of instruction decode created by wide issue and faster clock speeds has forced many recent designs to increase the number of pipeline stages between instruction fetch and execute. (Stages collectively referred to as decode stages.) For example, the DEC 21164 [Gwe94a] has three decode stages and the MIPS R10000 [Gwe94b] has two. Adding more decode stages increases the mispredicted branch penalty, however, architects have compensated for this penalty by increasing branch prediction accuracy through such means as larger branch target bu�ers or more e�ective predictors,
41 Fetch
Decode−I IR
PC
Decode−II
Execute Other Operand
Mode Offset Offset
I−Cache
Result
predecode Index Spec Base Spec
RF/BRIC
Base
Operand F A D−Cache Forward (Bypass) C Logic
A L U
Figure 4.3: Pipelined Implementation with Multiple Decode Stages. e.g., two-level adaptive [YP93]. Given extra decode stages, the task of implementing zero-cycle loads becomes markedly easier. Figure 4.3 shows one approach to providing support for zero-cycle loads on an in-order issue pipeline with two decode stages. Register access is delayed to the rst decode stage of the pipeline. This modi cation eliminates the need for a complex address-indexed BRIC in the fetch stage, permitting direct register le access using register speci ers. In the design shown in Figure 4.3, instructions are arbitrarily assumed to be fully decoded by the end of the rst decode stage, thus only the base and index register speci ers are supplied by instruction predecode. In some designs, it may be possible to decode the register speci ers and access the register le in a single cycle, eliminating the need for instruction predecode altogether. In some pipelines, it may not be possible to access the integer register le in the rst decode stage without supplying more ports (or multiplexing existing ports), which greatly increases the risk of impacting processor cycle time. A better alternative for these designs may be to adapt the BRIC as a means for caching register values. Previous studies, e.g., [FP91], have found a signi cant amount of temporal locality in base and index register accesses. A small cache, on the order of 4 to 8 entries should provide the necessary bandwidth to register values without increasing the number of ports on the existing integer register le. Like the original BRIC, a miss initiates a replacement which is available for use after the base and index registers have been read from the integer register le. However, unlike the original BRIC, this storage need not support multi-cast writes, since any register value will reside in at most one location. The extra decode stage makes it possible to detect more interlock conditions prior to speculative data cache access. For this design, it is assumed register interlock conditions are detected early enough to terminate the speculative access. As a result, a failure in fast address calculation, a memory interlock condition, or a data cache miss are the only signals that do not provide early termination of a speculative access. These conditions cannot be detected early because testing for them requires values that are only available after the start of the data cache access cycle. By the end of the rst decode stage, this design and the single decode stage design converge. In
42 the second decode stage, fast address calculation is used to compute the e�ective address and the data cache is accessed.
4.2.3 Further Design Considerations As shown in Section 3.6, fast address calculation fails often when applied to register+register mode accesses. Speculation overheads and program performance can likely be improved by not speculating loads using this addressing mode. Instead, accesses using this mode can compute the e�ective address during the decode stage of the pipeline and access the data cache in the execute stage. Using this design, register+register mode accesses that hits in the cache and BRIC and do not have register or memory con icts will complete in one cycle. Other failure conditions may manifest due to speculative data cache access. If a fault occurs, e.g., access to an invalid page table entry, it must be masked until the instruction becomes non-speculative. Once the speculative access is veri ed as correct, posting the fault proceeds as in the non-speculative case. The fast address calculation mechanism assumes that data cache access can start as soon as the set index part of the e�ective address is available. If this is not the case, e.g., the cache is indexed with a translated physical address or cache bank selection uses part of the block o�set, fast address calculation can not be used. (The early-issue mechanism, however, can still be applied.)
4.3 A Working Example Figure 4.4 illustrates the performance advantage of zero-cycle loads. Figure 4.4a shows a simple C code fragment which traverses a linked list searching for an element with a matching tag eld (often referred to as \pointer chasing"). Figure 4.4b shows the SimpleScalar assembly output as produced by the GNU GCC compiler. This code sequence was selected because it is a very common idiom in C codes, and it is di�cult to tolerate the latency of the loads with compile-time scheduling. Moving either load in the loop would require a global scheduling technique because both are preceded by branches. In addition, moving the rst load into a previous iteration of the loop would require support for masking faults since a NULL pointer may be dereferenced. Figure 4.4c and 4.4d depict the code executing on a 4-way in-order issue superscalar processor with and without support for zero-cycle loads, respectively. In both executions, the example assumes perfect branch prediction, one cycle data cache access latency, and unlimited functional unit resources. The stage speci ers contained within brackets, e.g., [ID], denote a data cache access occurred during that cycle. Arrows indicate where values from memory were forwarded to other instructions. The shaded stage speci ers indicate that the instruction was stalled in that stage for one cycle. In the execution with support for zero-cycle loads, all BRIC accesses hit and all fast address calculations
r2,4(r1) r2,tag,end r1,0(r1) r1,0,loop
r2,4(r1) r2,tag,end r1,0(r1) r1,0,loop
lw bne
lw beq lw bne
lw beq lw bne
Cycle 8
d)
ID ID ID IF ID IF IF IF
13
ID ID ID IF
EX ID ID ID
[MEM] EX ID
12
IF IF IF IF
11
[ID] ID [ID] ID
[ID] ID [ID] ID
IF IF IF IF
IF IF IF IF
c)
EX EX EX EX
EX EX
5
[ID] ID
[MEM] ID EX ID EX ID ID ID ID ID IF
ID ID ID IF
ID IF IF IF
IF IF IF IF
10
IF IF
Cycle 3 4 EX EX [EX] ID EX
EX ID ID ID
[MEM] ID EX
EX ID
9
ID ID
ID IF
ID IF
IF IF
7
r2,4(r1) r2,tag,end r1,0(r1) r1,0,loop
lw beq lw bne
[MEM] ID EX
6
r2,4(r1) r2,tag,end r1,0(r1) r1,0,loop
lw beq lw bne
ID ID
4 5 [MEM] ID EX ID EX ID ID
3 EX ID ID ID
2 ID ID ID ID
r1,0(r1) r1,0,loop
lw bne
lw beq lw beq
2 [ID] ID [ID]* ID
15
[MEM] ID EX ID EX ID ID
14
EX EX EX EX
6
17
[MEM] ID EX
16
for an element with a matching tag eld. Figure b) shows an assembly version of the code for the SimpleScalar architecture. Figure c) and d) depict the code executing on a 4-way in-order issue superscalar processor with and without support for zero-cycle loads, respectively.
Figure 4.4: Pointer Chasing Example with and without Zero-Cycle Loads. Figure a) shows a simple C code fragment which traverses a linked list searching
r1,0(r1) r1,0,loop
lw beq lw beq
b)
r1,head r1,0,end r2,4(r1) r2,tag,end r1,0(r1) r1,0,loop
1 IF r1,head IF r1,0,end IF r2,4(r1) r2,tag,end IF
Instruction
lw beq loop: lw beq lw bne end:
a)
for (p = head; p != NULL; p = p−>next) if (p−>tag == tag) break;
1 IF r1,head IF r1,0,end IF r2,4(r1) r2,tag,end IF
Instruction
43
44 succeed. Incorrectly speculated accesses are denoted with an asterisk. As seen by comparing the two execution examples, support for zero-cycle loads signi cantly reduces the number of cycles to execute the code sequence. Without zero-cycle load support, each iteration requires four cycles to execute; with zero-cycle load support, each iteration requires only a single cycle to execute, as both load results are available by the time the two branches reach the execute stage of the processor. Reducing the latency of the load instructions eliminates nearly all stalls. Only one access is misspeculated (marked with an asterisk). This access must be re-executed in the execute stage of the processor because the earlier load issued in the same cycle created a value used by the later load, i.e., a violation of a RAW dependence. (This failure condition would be indicated by the signal Reg Interlock.) Although not shown in the gure, running the same code on a 4-way out-of-order issue processor without zero-cycle load support requires two cycles to execute each iteration. The out-of-order issue processor cannot achieve one iteration per cycle because the code segment contains a recurrence requiring two cycles per iteration (one cycle for address calculation followed by one cycle to access the data cache). On the same out-of-order issue processor with support for zero-cycle loads, the latency reduction capability of fast address calculation allows each iteration of the recurrence to complete in one cycle.
4.4 Experimental Evaluation This section examines the performance of programs running on a detailed timing simulator extended to support zero-cycle loads. Key system parameters such as processor issue model, level of software support, and number of architected registers are varied to see what e�ects these changes had on the e�cacy of zero-cycle loads.
4.4.1 Methodology All experiments were performed on the baseline issue timing simulators detailed in Chapter 2. The simulator implements a detailed timing model of a 4-way superscalar processor and the rst level of instruction and data cache memory. The data cache modeled is a dual-ported 16k direct-mapped non-blocking cache. Stores are serviced in two cycles using a 16-entry non-merging store bu�er. A number of modi cations were made to the simulator to support zero-cycle loads. To compensate for the cost of generating predecode information, instruction cache miss latency was increased by two cycles. A BRIC was added with a miss latency of three cycles. For the one decode stage designs, the BRIC is address-indexed and the branch penalty is two cycles. For the two decode stage designs, the BRIC is register speci ed-indexed and the branch penalty is 3 cycles. To reduce the impact of branch
45 penalties for the two decode stage design, the branch target bu�er size was doubled. Speculative zerocycle loads stall until all earlier-issued, un nished stores are guaranteed to not con ict. If a store's address is unknown, it is assumed to con ict. To reduce the number of stalled loads, stores also employ fast address calculation. The simulator does not attempt fast address calculation on register+register mode loads { it instead performs e�ective address calculation in the decode stage of the pipeline and accesses the data cache in the execute stage. For all experiments, there are only two data cache access ports available each cycle. Data cache ports are arbitrated rst to non-speculative loads late in the pipeline, then to the store bu�er, and nally, if any are ports are left over, to speculative zero-cycle loads. All programs were compiled for the SimpleScalar architecture (detailed in Appendix A). The simple software support used to increase the prediction accuracy of fast address calculation (described in Section 3.5) was used for these experiments as well.
4.4.2 Baseline Performance Table 4.1 shows the impact of zero-cycle loads on program performance. The table lists the IPCs for programs running on pipelines with one and two decode stages and various BRIC con gurations. As detailed in Section 4.2, the pipeline implementation with one decode stage (shown in Figure 4.2) indexes the BRIC with a load address and has a 2 cycle branch penalty. The pipeline implementation with two decode stages (shown in Figure 4.3), indexes the BRIC with a register speci er and has a 3 cycle branch penalty. All experiments were performed with the in-order issue processor simulator. The speedups shown are the number of cycles for each program to execute with hardware and software support for zero-cycle loads divided by the number of cycles to execute without hardware and software support for zero-cycle loads. In each experiment, the BRIC simulated is fully associative and uses LRU replacement. The speedups are quite impressive for both the integer and oating point codes. With an 8 entry address-indexed BRIC (column BRIC-8), the run-time weighted average speedups found was 1.45 for the integer codes and 1.26 for the oating point codes. The speedups for the oating point codes are smaller because their executions are heavily dominated by other long latencies, e.g., cache miss latencies and oating point computations, which are mostly una�ected by zero-cycle load support. Performance with even a small address-indexed BRIC is quite good. The 64 entry BRIC (column BRIC-64) only improves performance slightly over the 8 entry BRIC simulations (column BRIC-8). This result is very positive, suggesting that keeping the BRIC small to reduce processor cycle time impacts should not have a signi cant e�ect on program performance. Figure 4.5 shows the hit ratios for both address- and register speci er-indexed BRIC of varied size. In each experiment, the BRIC is fully associative with LRU replacement. The gures show only four of the benchmarks, selected as they are representative of the others. The address-indexed BRIC
Compress Eqntott Espresso GCC SC Xlisp Grep Perl YACR-2 Int Avg Alvinn Ear Mdljdp2 Mdljsp2 Spice2g6 Su2cor Tomcatv FP Avg
Benchmark
Table 4.1: Zero-Cycle Load Baseline Performance.
One Decode Stage Two Decode Stages Address-Indexed BRIC Register Speci er-Indexed BRIC Base Speedup Base Speedup IPC BRIC-8 BRIC-64 No GP/SP GP/SP Perfect IPC BRIC-4 BRIC-8 Perfect 1.01 1.23 1.23 1.22 1.10 1.40 0.99 1.21 1.22 1.38 1.22 1.41 1.42 1.41 1.03 1.42 1.15 1.37 1.37 1.38 1.20 1.43 1.44 1.42 1.03 1.45 1.19 1.40 1.40 1.42 1.04 1.27 1.28 1.24 1.07 1.41 1.02 1.24 1.25 1.37 1.02 1.48 1.49 1.40 1.16 1.52 1.00 1.45 1.45 1.48 0.99 1.54 1.56 1.48 1.23 1.56 0.98 1.47 1.47 1.48 0.95 1.95 1.98 1.94 1.01 1.98 0.95 1.96 1.96 1.97 0.90 1.27 1.28 1.24 1.10 1.33 0.87 1.28 1.28 1.33 1.62 1.37 1.37 1.37 1.12 1.37 1.59 1.36 1.36 1.36 1.11 1.45 1.47 1.42 1.12 1.49 1.08 1.42 1.42 1.44 1.02 1.44 1.44 1.44 1.02 1.45 1.01 1.44 1.44 1.45 0.84 1.29 1.30 1.29 1.01 1.33 0.81 1.29 1.30 1.34 0.83 1.30 1.31 1.29 1.01 1.35 0.82 1.29 1.30 1.35 0.78 1.17 1.17 1.17 1.01 1.25 0.78 1.18 1.18 1.25 0.86 1.28 1.29 1.27 1.20 1.65 0.85 1.27 1.27 1.63 0.76 1.13 1.14 1.13 1.01 1.15 0.75 1.12 1.13 1.15 0.97 1.21 1.22 1.20 1.02 1.27 0.97 1.21 1.21 1.27 0.87 1.26 1.27 1.26 1.05 1.37 0.86 1.26 1.27 1.37
46
47 100 GCC Espresso Spice Xlisp
95
Hit Rate
90 85 80 75 70 4
8 16 32 Address-Indexed BRIC Size
64
100 GCC Espresso Spice Xlisp
Hit Rate
98
96
94
92
90 4
8 16 Register Specifier-Indexed BRIC Size
32
Figure 4.5: Hit Rates for Address- and Register Speci er-Indexed BRIC. performs well for even small sizes. The performance is quite good for programs with a large number of static loads, e.g., GCC and Spice, and programs with a large number of dynamic loads, e.g., Xlisp and Spice. The register speci er-indexed BRIC, used in the two decode stage design, also performed well for all programs. Performance for a even a four entry register speci er-indexed BRIC is very good. This result is to be expected since register le accesses have a signi cant amount of temporal locality [FP91]. The column labeled No GP/SP shows speedups for an 8 entry address-indexed BRIC without separate registers available to cache the global and stack pointer. In this design, global and stack pointer loads reside in the BRIC as well, reducing its e�ective capacity (i.e., the design in Figure 4.2 without the GP and SP registers). The results suggest that special handling of global and stack references only yields marginal improvements in overall performance, more for the programs with a high dynamic frequency of global and stack loads and stores, e.g., Xlisp or Sc. If designs omit this
48 option, they may still perform well. Experiments were also performed to determine the e�cacy of the BRIC itself. The column labeled GP/SP shows the speedups for a con guration without a BRIC, i.e., only global and stack pointer accesses can execute with zero cycle latency. As expected, only the programs which rely heavily on global or stack pointer accesses show any notable speedups. The right half of Table 4.1 gives speedups for a pipeline implementation with two decode stages. In this con guration, the branch misprediction penalty is increased to three cycles, and the BRIC is indexed by a register speci er, rather than a load address. Speedups are shown for both a 4 and 8 entry fully associative BRIC with LRU replacement. As suggested by the hit rates in Figure 4.5, the 8 entry BRIC only o�ers marginal improvement over the 4 entry BRIC. Overall, the speedups are comparable to the one decode stage design. Either of the presented designs should be equally e�ective at reducing load latency. Figure 4.6 shows e�ective latency for loads executing on the two decode stage design with an 8 entry BRIC. Successful zero-cycle loads (labeled 0-cycle) were most predominant in the integer codes, although for all experiments a signi cant fraction of loads completed with zero e�ective latency. Well over 50% of all loads were completed in one or less cycles for all the codes. Two-cycle loads were more common in the oating point codes. When loads could not complete with zero e�ective latency, the most common causes for failure were register con icts and fast address calculation failures, with the former case being the most predominant. Table 4.1 also lists program performance with perfect fast address calculation predictions and no BRIC misses (the columns labeled Perfect). The perfect runs provide only slight increases in program performance, more so for the oating point codes. The current designs are exploiting much of the potential performance. Most of the performance loss in each case can be attributed to fast address calculation failures.
4.4.3 Performance with Out-of-Order Issue An aggressive out-of-order issue execution model provides a built-in mechanism for tolerating load latency. Unconstrained by dependencies, the issue mechanism in an out-of-order issue processor is able to run ahead of executing instructions looking for independent operations with which to tolerate latencies. If branch prediction performs well and there is su�cient parallelism, other latency tolerating or reducing techniques should not be required. To determine the e�ectiveness of this execution model at negating the bene ts of zero-cycle loads, experiments were run on the out-of-order issue simulator (detailed in Chapter 2) extended to support zero-cycle loads. Results of the experiments are shown in Table 4.2. All simulations were performed on a pipeline with two decode stages using an 8 entry fully associative register speci er-indexed BRIC with LRU replacement. All programs are compiled with software support.
49
100 90
% of All Accesses
80 70 60 50 40 30 20 10 0 Espresso Eqntott Sc Perl YACR-2 Spice2g6 Mdljsp2 Ear FP Avg Xlisp Compress Gcc Grep Int Avg Mdljdp2 Tomcatv Su2cor
0-cycle
1-cycle
2-cycle
Figure 4.6: Breakdown of All Loads by Latency in Cycles.
Benchmark Compress Eqntott Espresso GCC SC Xlisp Grep Perl YACR-2 Int Avg Alvinn Ear Mdljdp2 Mdljsp2 Spice2g6 Su2cor Tomcatv FP Avg
In-Order
1.22 1.37 1.40 1.25 1.45 1.47 1.96 1.28 1.36 1.42 1.44 1.30 1.30 1.18 1.27 1.13 1.21 1.27
Speedup
Out-of-Order
1.02 1.16 1.15 1.04 1.16 1.10 1.42 1.07 1.07 1.13 1.09 1.04 1.09 1.04 1.01 1.13 1.08 1.07
CycleIn CycleOut
1.63 1.26 1.65 1.46 1.69 1.54 1.67 1.40 1.70 1.53 1.80 2.10 1.85 1.55 1.37 1.68 1.52 1.66
CycleIn+ZCL CycleOut
Table 4.2: Performance with Out-of-Order Issue.
1.34 0.91 1.14 1.16 1.13 1.03 0.84 1.08 1.23 1.06 1.24 1.61 1.42 1.47 1.36 1.40 1.41 1.39
50 The column labeled Out-of-Order in Table 4.1 lists the speedups attained by adding zero-cycle load support to the out-of-order issue processor (over the performance of the out-of-order issue processor without zero-cycle load support). As seen by comparing these speedups with those found for the inorder issue processor (in column In-Order, reproduced from Table 4.1), overall speedups are notably less for the processor using out-of-order issue. This result con rms that the out-of-order issue model is tolerating load latency. However, the resulting speedups are not all insigni cant, especially for many of the integer codes. These codes likely have less parallelism available to tolerate load instruction latencies, thus they bene t from the latency reduction o�ered by fast address calculation. The rightmost two columns of Table 4.2 compare the performance of an in-order issue processor with and without zero-cycle load support to an out-of-order issue processor without zero-cycle load support. The column labeled CycleIn=CycleOut gives the run-time (in cycles) of programs on the in-order issue processor divided by the run-time on the out-of-order issue processor (neither with zerocycle load support). This metric quanti es the cycle count advantage of out-of-order issue. Clearly, the programs take fewer cycles to run on the out-of-order issue processor than on the in-order issue processor. The column labeled CycleIn+ZCL=CycleOut repeats the experiments, except this time the in-order issue processor has support for zero-cycle loads. For the integer codes, the performance of the two processors is now much closer { both outperforming each other in some cases, with slightly better performance on the out-of-order issue processor. This result is striking when one considers the clock cycle and design time advantages typically a�orded to in-order issue processors. It may be the case that for workloads where exposed latency is dominated by data cache access latencies (as is the case for the integer benchmarks), an in-order issue design with support for zero-cycle loads may consistently outperform an out-of-order issue processor. For the oating point codes, the in-order issue processor with support for zero-cycle loads is still much slower than the out-of-order issue processor. The oating point codes have many other long latencies, e.g. oat point computation and cache misses, which are e�ectively tolerated by the out-of-order issue mechanism, but bene t little from zero-cycle load support.
4.4.4 Performance with Fewer Registers A number of architectures in wide-spread use today have few architected registers, e.g., the x86 or IBM System/370 architectures. To evaluate the e�cacy of zero-cycle loads for these architectures, the experiments were run again with programs re-compiled to use only 8 integer and 8 oating point registers (one-quarter the normal supply). The results of the experiments are shown in Table 4.3. All simulations were performed on a pipeline using in-order issue with two decode stages. All programs are compiled with software support. The left side of Table 4.3 shows how a program is a�ected by reducing the number of architected registers from 32 to 8. The total number of loads increased by as much as 177%, primarily the result
Compress Eqntott Espresso GCC SC Xlisp Grep Perl YACR-2 Int Avg Alvinn Ear Mdljdp2 Mdljsp2 Spice2g6 Su2cor Tomcatv FP Avg
Benchmark Percent More Loads 23.34 39.82 57.11 24.02 4.67 0.98 5.46 26.46 99.06 26.02 31.79 112.36 81.41 110.21 9.93 47.20 177.22 64.06 0.85 0.77 0.81 0.90 0.99 0.99 0.97 0.86 0.87 0.90 0.95 0.78 0.69 0.77 0.95 0.79 0.52 0.82
Cycle32;reg Cycle8;reg
1.05 0.86 0.96 1.01 1.13 1.20 1.01 1.14 1.23 1.07 1.18 0.94 0.94 0.90 1.16 0.86 0.56 0.99
Cycle32;reg Cycle8;reg+GP SP
Speedup
Table 4.3: Performance with Fewer Registers.
Loads Distribution of Extra Loads Global Stack General 32.41 44.13 23.45 92.41 7.59 0.00 9.02 47.90 43.08 5.74 36.26 58.01 0.00 72.46 27.54 100.00 0.00 0.00 0.00 48.86 50.96 24.26 32.29 43.45 0.00 63.14 36.86 | | | 0.76 99.24 0.00 16.45 34.15 49.40 7.66 45.52 46.82 30.35 69.65 0.00 13.96 86.04 0.00 2.26 97.74 0.00 1.62 98.38 0.00 | | | 1.32 1.40 1.45 1.28 1.43 1.46 2.03 1.38 1.67 1.46 1.34 1.50 1.36 1.33 1.28 1.13 1.16 1.29
Cycle8;reg Cycle8;reg+ZCL
51
52 of extra accesses needed to spill and reload temporary variables. The increases are notably larger for the oating point codes because they typically use more registers for temporary space. Also shown (in the columns labeled Distribution of Extra Loads) is the breakdown of how much (as a percent of total extra loads) each form of addressing contributes to the overhead. The column labeled Cycle32;reg =Cycle8;reg quanti es the performance impact of fewer architected registers. It shows the run-time (in cycles) of programs compiled to use 32 registers running on the baseline in-order issue simulator divided by the run-time of the 8 register version of the program running on the same processor. For many of the programs, the performance impact of having more registers is quite large, more so in general for the oating point codes. Next, the performance of 8 register designs with limited and full support for zero-cycle loads was examined. The design with limited zero-cycle load support only allows global and stack pointer accesses to execute with zero cycle latency. Implementing this support is less costly than full support for zero-cycle loads. (This design is essentially the one in Figure 4.2 without a BRIC.) This design should perform well considering the predominance of stack and global accesses in the 8 register executions. The speedups in the column labeled Cycle32;reg =Cycle8;reg+GPSP show this implementation's performance with respect to an architecture with 32 registers and no support for zero-cycle loads. For most programs, limited support for zero-cycle loads more than compensates for the lack of registers in the architecture. In many cases, the performance of the register-limited architecture is better than its 32 register counterpart. Not only does the zero-cycle load support perform well on the extra accesses due to spills and reloads, but it also performs well on the stack and global pointer accesses that both programs execute. For a few of the oating point codes, e.g., Tomcatv, the improvements rendered still do not approach the performance of the 32 register architecture. These codes su�er from an excessive number of dynamic loads and stores which saturate available data cache bandwidth and limit overall performance improvements. The experiments in column Cycle8;reg =Cycle8;reg+ZCL show the performance found with full support for zero-cycle loads on the register-limited architecture. The speedups are shown with respect to the program running on the register-limited architecture without support for zero-cycle loads. As expected, the speedups are better than those found on the 32 register architecture due to the excellent performance of the many extra stack and global accesses.
4.5 Related Work The application of early issue as a means of reducing load latency has been gainfully applied in a number of previous works [BC91, EV93, GM93]. All use an address predictor mechanism, which is a variant of the load delta table [EV93], to generate addresses early in the pipeline, allowing loads to be initiated earlier than the execute stage. The load delta table tracks both the previous address accessed
53 by a particular load and one or more computed stride values used to predict a load's next e�ective address. Considering the frequency of strided accesses and accesses with no (zero) stride, the load delta table is an e�ective approach to predicting load addresses. The approach described in this chapter uses a stateless address predictor, eliminating the cost and complexity of the load delta table. Compared to the other approaches, zero-cycle loads features the tightest level of pipeline integration, yielding fewer register and memory interlocks and better potential performance. Tighter pipeline integration, however, does limit the extent to which load latency can be reduced (two cycles in the proposed designs). To have an e�ect on longer load latencies, like those occurring during data cache misses, a load delta table approach may be more e�ective if used instead or in conjunction with zero-cycle loads. This observation is further supported by the possibility that the load delta table may perform better on codes where fast address calculation performs poorly (e.g., poorly structured numeric codes). Instruction scheduling [KE93, PS90, GM86] is essentially the software dual of the early-issue mechanism, as both work to increase distance between loads and their rst use. There are tradeo�s to using either approach. With compile-time scheduling, it is possible for the compiler to hoist loads much further than possible with hardware-based early-issue mechanisms. Hardware-based early-issue of loads, on the other hand, bene ts from run-time information and the ability to dynamically mask faults, making it possible to hoist loads past stores and branches that would otherwise form barriers for the compiler. The C Machine [DM82] used a novel approach to implement zero-cycle access to stack frame variables. At cache misses, memory operand speci ers within instructions were replaced with direct stack cache addresses. When the partially decoded instructions were executed, operands in the stack cache could be accessed as quickly as registers. The knapsack memory [AVS93] component included support for zero-cycle loads. Software support was used to place data into the power-of-two aligned knapsack region, providing zero-cycle access to these variables when made with the architecturally-de ned knapsack pointer. This optimization was limited primarily to global data. Jouppi [Jou89] proposed a pipeline that performed ALU operations and memory access in the same stage. The pipeline employs a separate address generation pipeline stage, pushing the execution of ALU instructions and cache access to the same pipeline stage. This organization increases the mispredicted branch penalty by one cycle. It also removes the load-use hazard that occurs in traditional ve stage pipelines, instead introducing an address-use hazard. The address-use hazard stalls the pipeline for one cycle if the computation of the base register value is immediately followed by a dependent load or store. The R8000 (TFP) processor [Hsu94] uses a similar approach. Zero-cycle loads can be viewed as essentially a variation on this pipeline design { employing early issue rather than late execute. In the designs presented in this chapter, early issue does not aggravate branch penalty, and fast address calculation allows memory access to execute one stage earlier, thereby eliminating more load latency
54 without incurring any more exposure to hazards. Comparing the baseline results of this chapter with those in Chapter 3 reveals roughly a two-fold improvement in performance for the integer codes, and nearly a four-fold improvement for the oating point codes. These performance improvements follow from the increased latency reduction a�orded by zero-cycle loads (i.e., from one cycle with fast address calculation alone to zero cycles) in combination with better overall support for speeding up register+register mode accesses, an addressing mode which the oating point codes rely on more heavily.
4.6 Chapter Summary Two pipeline designs supporting zero-cycle loads were presented: an aggressive design for pipelines with a single stage of decode and a less aggressive design for pipelines with multiple decode stages. The designs make judicious use of instruction cache predecode, base register caching, and fast address calculation to produce load results two cycles earlier than traditional pipeline designs. The design with multiple decode stages was markedly simpler because more of the component operations of a load could be performed after fetching the load instruction. The proposed designs were evaluated in a number of contexts: with and without software support, in-order vs. out-of-order issue, and on architectures with many and few registers. Overall, the speedups a�orded by zero-cycle loads, for either pipeline design, were excellent. For the one decode stage design with in-order issue, simulations showed a cycle-weighted speedup of 1.45 for the integer codes and 1.26 for the oating point codes. Good speedups were found for even small BRIC sizes. Software support was generally e�ective, more so on the integer codes, but even without software support speedups were still quite good. Speedups on the out-of-order issue processor were signi cantly less due to the latency tolerating capability of the execution model. However, some programs still showed notable speedups, likely because the executions lacked su�cient parallelism to tolerate all load latency, and thus bene ted from the latency reduction capability of fast address calculation. An in-order issue processor with zero-cycle load support compared favorably in performance to an out-of-order issue processor for programs with good cache performance and signi cant exposed load instruction latency. With fewer registers, the frequency of loads and their impact of program performance increases signi cantly, especially for oating point codes. Providing an 8 register architecture with zero-cycle load support for only global and stack pointer references, resulted in performance comparable to a 32 register architecture. This result suggests limited support for zero-cycle loads is one avenue available to improving the performance of legacy architectures with few registers. With full support for zero-cycle loads, speedups were quite good, slightly better than for the 32 register architecture due to excellent prediction performance for the many extra global and stack accesses present.
Chapter 5
55
High-Bandwidth Address Translation 5.1 Introduction In support of the proposed cache hit optimizations, this chapter examines four new high-bandwidth and low-latency address translation mechanisms. These new mechanisms feature better latency and area characteristics than current TLB designs, providing architects with e�ective alternatives for keeping address translation o� the critical path of loads. Address translation is a vital mechanism in modern computer systems. The process provides the operating system with the mapping and protection mechanisms necessary to manage multiple large and private address spaces in a single, limited size physical memory [HP90]. In practice, most microprocessors implement low-latency address translation with a translation lookaside bu�er (TLB). A TLB is a cache, typically highly-associative, containing virtual memory page table entries which describe the physical address of a virtual memory page as well as its access permissions and reference status (i.e., reference and dirty bits). The virtual page address of a memory access is used to index the TLB; if the virtual page address hits in the TLB, a translation is quickly returned. On a TLB miss, a hardware- or software-based miss handler is invoked which \walks" the virtual memory page tables to determine the correct translation to load into the TLB. The latency of address translation is generally not thought of as a latency component of loads. The usual goal of address translation design is not to minimize load latency, but rather to keep address translation o� the critical path of data cache access. Typically, this task is accomplished by allowing data cache access and address translation to proceed in parallel using, for example, a virtually-indexed cache. The address translation mechanism is then constructed to be at least as fast as the data cache. Today, however, architectural and workload trends are placing increased demands on the address translation mechanism, making it increasing di�cult to keep address translation o� the critical path of data cache access. Processor designs are continually exploiting higher levels of instruction-level parallelism (ILP), which increases the bandwidth demand on TLB designs. The nature of workloads is also changing. There is a strong shift towards codes with large data sets and less locality, resulting in
56 poor TLB hit rates. Notable examples of this trend include environments that support multitasking, threaded programming, and multimedia applications. Together, architectural and workload trends are pushing architects to look for TLB designs that possess low-latency and high-bandwidth access characteristics while being capable of mapping a large portion of the address space. The current approach used in most multiple-issue processors is a large multi-ported TLB, typically dual-ported with 64-128 entries. A multi-ported TLB provides multiple access paths to all cells of the TLB, allowing multiple translations in a single cycle. The relatively small size of current TLBs along with the layout of the highly-associative storage lends itself well to multi-porting at the cells [WE88]. Although a multi-ported TLB design provides an excellent hit rate at each access port, its latency and area increase sharply as the number of ports or entries is increased. While this design meets the latency and bandwidth requirements of many current designs, continued demands may soon render it impractical, forcing tomorrow's designs to nd alternative translation mechanisms. Already, some processor designs have turned to alternative TLB organizations with better latency and bandwidth characteristics; for example, Hal's SPARC64 [Gwe95] and IBM's AS/400 64-bit PowerPC [BHIL94] processor both implement multi-level TLBs. Many processors implement multi-level TLBs for instruction fetch translation as well [CBJ92]. This chapter extends the work in high-bandwidth address translation design by introducing four designs with better latency and area characteristics than a multi-ported TLB. Using detailed timing simulation, the performance of the proposed high-bandwidth designs was compared to the performance of a TLB with unlimited bandwidth. A number of designs are clear winners { their use results in almost no impact on system performance. Any latency and area bene ts these designs may a�ord will serve to improve system performance through increased clock speeds and/or better die space utilization. The scope of this work is limited to address translation for physically tagged data caches. Instruction fetch translation is a markedly easier problem, since instruction fetch mechanisms typically restrict all instructions fetched in a single cycle to be within the same virtual memory page, requiring at most one translation per cycle. Instruction fetch translation is well served by a single-ported instruction TLB or by a small micro-TLB implemented over a uni ed instruction and data TLB [CBJ92]. The remainder of this chapter is organized as follows. Section 5.2 describes a performance model for address translation and qualitatively explores the impact of address translation latency and bandwidth on system performance. Section 5.3 details the proposed mechanisms for high-bandwidth address translation, and Section 5.4 presents extensive simulation-based performance studies of address translation designs using the proposed mechanisms. Finally, Section 5.5 summarizes the chapter.
57
Request #M VPN Hit PPN
f_MEM, f_TOL
. . . Shielding Mechanism
f_shielded
. . . Request Queue(s)
VPN Hit PPN Port #1
t_stalled
VPN Hit PPN Port #N
Base TLB Mechanism
t_TLBhit, M_TLB, t_TLBmiss
Address Translation Mechanism
Processor Model
Processor Core Request #1 VPN Hit PPN
Figure 5.1: A System Model of Address Translation Performance. VPN is the virtual page number, PPN is the physical page number.
5.2 Impact of Address Translation on System Performance Before delving into the details of the proposed high-bandwidth designs or their evaluation, it is prudent to rst develop a performance model for address translation. The model presented in this section is strictly qualitative in nature. It is not used to derive the performance of a particular address translation mechanism; this is done empirically with detailed timing simulations in Section 5.4. Instead, the model serves as a framework for address translation. By casting the proposed designs into this framework, one can readily see which features a�ect address translation performance, and consequently, how address translation performance a�ects system performance. Figure 5.1 illustrates the performance model for address translation. At the highest level, a processor core executes a program in which a fraction fMEM of all instructions access memory. Each cycle, the processor core makes as many as M address translation requests. A fraction fshielded of these requests are serviced by a shielding mechanism. A shielding mechanism is a high-bandwidth and low-latency translation device that can satisfy a translation request without: 1) impacting the latency of memory access, or 2) forwarding the request to the base TLB mechanism. Hence, the shielding mechanism acts as a shield for the base TLB mechanism, ltering out fshielded of all translation requests. An e�ective shielding mechanism can signi cantly reduce the bandwidth demands on the base TLB mechanism; three shielding mechanisms are examined in detail: L1 TLBs, piggyback ports, and pretranslation. Requests not handled by the shielding mechanism are directed to the base TLB mechanism which can service up to N requests per translation cycle. The base TLB mechanism functions identically to
58 a traditional TLB, providing fast access to page table entries using a low-latency caching structure. However, the organization used in this work may be non-traditional, e.g., interleaved, for the purpose of providing increased bandwidth. If a base TLB port is immediately available, the translation proceeds immediately. If a port is not available, the request is queued until a port becomes available, at which time it may proceed. The queuing mechanism employed is dependent on the processor model, e.g., an out-of-order issue processor queues requests in a memory reorder bu�er, while an in-order issue processor queues requests by stalling the pipeline. Requests are queued waiting for a port for an average latency of tstalled . The magnitude of tstalled is determined by the bandwidth of the address translation mechanism { with unlimited bandwidth tstalled will be zero, with limited bandwidth it may be non-zero. How bandwidth a�ects queueing latency in the processor is very complex, since it depends on the frequency and distribution of requests to the translation device. This relationship is not derived analytically; instead, it is measured precisely with detailed timing simulations in Section 5.4. Once a request is serviced by the base TLB mechanism, (1 ; MTLB ) requests will hit in the TLB and be serviced with latency tTLBhit . The remaining MTLB of all requests will miss in the TLB and be serviced with latency tTLBmiss . Under this model of address translation, the average latency of a translation request (as seen by the processor core), tAT , is:
tAT = (1 ; fshielded ) � (tstalled + tTLBhit + MTLB � tTLBmiss ) The impact of address translation latency on system performance is tempered by two factors: 1) the processor's ability to tolerate latency, and 2) the relative impact of memory access latency compared to other latencies. The impact of address translation on system performance, measured as the average latency for address translation per instruction, TPIAT , is:
TPIAT = fMEM � (1 ; fTOL ) � tAT fTOL is the fraction of address translation latency that is tolerated by the processor core. The
workload and processor model both a�ect the degree to which the processor core can tolerate latency. If the workload exhibits su�cient parallelism and the execution model provides latency tolerating support, the impact of address translation latency on overall performance will decrease. Processor models with high levels of latency tolerating capability include those that support out-of-order issue, non-blocking memory access, and speculative execution. Finally, fMEM is the dynamic fraction of all instructions that access memory. This factor is a�ected by the workload, the number of architected registers, and the compiler's ability to e�ectively utilize registers. Programs that access memory often will need better address translation performance for good system performance.
59 In summary, the performance of the address translation mechanism is a�ected: 1) by its ability to shield requests from the base translation mechanism, and 2) by the latency and bandwidth of the base translation device. The impact address translation on system performance is a�ected: 1) by the processor's ability to tolerate translation latency, and 2) by the relative impact of address translation latency compared to other latencies.
5.3 High-Bandwidth Address Translation This section presents new mechanisms for high-bandwidth address translation. The proposed designs fall into two categories: designs that extend traditional high-bandwidth memory design to the domain of address translation, and designs crafted speci cally for high-bandwidth address translation. Techniques for delivering high-bandwidth memory access are well developed, both in the literature and in practice. The common approaches are multi-ported [SF91], interleaved [Rau91], and multilevel [JW94] memory structures. Multi-ported TLBs are already widely used; this work develops and evaluates interleaved and multi-level TLBs as well. In addition, piggyback ports are introduced as a technique to exploit the high level of spatial locality in simultaneous translation requests. This approach allows simultaneous accesses to the same virtual memory page to combine their requests at the TLB access port. Pretranslation is introduced as a technique for attaching translations to base register values, making it possible to reuse a single translation many times. All of the proposed high-bandwidth address translation designs are targeted towards systems with physically tagged caches, i.e., those which require a translation for each memory access. Virtualaddress caches, on the other hand, do not require a translation for each memory access. Because there are no physical addresses in the cache, address translation can be pushed o� until data is fetched from physical storage, e.g., when a physically addressed second-level cache or main memory is accessed. Such a design eliminates both bandwidth and latency concerns. Virtual-address caches have, however, two signi cant drawbacks which discourage their use in real systems: 1) synonyms, and 2) lack of support for protection. Synonyms can occur in virtually-indexed caches when storage is manipulated under multiple virtual addresses. In a multiprogrammed environment, shared physical storage can end up in multiple lines of a virtually-indexed cache, creating a potential coherence problem. In a multiprocessing environment, cache coherence operations must rst be reverse-translated to remote virtual addresses before data can be located in the remote cache. Many solutions have been devised to eliminate synonyms, including alignment restrictions on shared data [Che87], selective invalidation [WBL89], and single address space operating systems [KCE92]. However, these approaches have yet to come into widespread use due to performance and/or implementation impacts on application and system software. Moreover, these solutions do not solve the second problem that arises with virtual-address caches, e�cient implementation
60 of protection. Traditionally, protection information has been logically attached to virtual memory pages. As a result, their implementation has been naturally integrated into the TLB. If the TLB is eliminated through use of a virtual-address cache, the problem of implementing protection still remains. One solution is to integrate protection information into cache blocks [WEG+ 86]. However, the page-granularity of protection information makes managing these elds both complicated and expensive. Another solution is to implement a TLB minus the physical page address information, called a protection lookaside bu�er (PLB) [KCE92]. This TLB-like structure, however, still requires high-bandwidth and low-latency access (although, latency requirements are somewhat relaxed). In light of these drawbacks, virtual-address caches have seen little use in real systems. In addition, it is likely that if virtual-address caches are adopted they may still employ TLB-like structures to implement protection, which requires a high-bandwidth mechanism like the ones describe here. Consequently, virtual-address caches are not considered further.
5.3.1 Multi-ported TLB A multi-ported TLB, shown in Figure 5.2a, provides high-bandwidth access using a brute force approach. Each port is provided its own data path to every entry in the TLB, implemented by either replicating the entire TLB structure (one single-ported TLB for each port) or multi-porting the individual TLB cells. Since every entry of the TLB is accessible from each port of the device, this design provides a good hit rate for each port (low MTLB ). However, the capacitance and resistance load on each access path increases as the number of ports or entries is increased [WE88], resulting in longer access latency (tTLBhit ). In addition, this design has a large area due to the many wires and comparators needed to implement each port. (In CMOS technology, the area of a multi-ported device is proportional to the square of the number of ports [Jol91].) Independent of access latency and implementation area considerations, this design provides the best bandwidth and hit rate of all the designs, hence, it provides a convenient standard for gauging the performance of the other proposed designs.
5.3.2 Interleaved TLB An interleaved TLB, shown in Figure 5.2b, employs an interconnect to distribute the address stream among multiple TLB banks. Each TLB bank can independently service one request per translation cycle. This design provides high-bandwidth access as long as simultaneous accesses map to di�erent banks. The mapping between virtual page addresses and the TLB banks is de ned by the bank selection function. This function in uences the distribution of the accesses to the banks, and hence, the bandwidth delivered by the device. The experimental evaluations consider both bit selection, which uses a
61
Port #1
Port #N
VPN Hit PPN
Port #1
VPN Hit PPN
Port #N
. . .
VPN Hit PPN
VPN Hit PPN
. . .
INTERCONNECT
Multi−ported TLB
VPN Hit PPN
Bank #1
Bank #M
Mid−sized ( ACTIVE THRESHOLD) f if (var.type == GLOBAL) active globals = active globals [ var; else active heap = active heap [ var; g
else f if (var.type == GLOBAL) inactive globals = inactive globals [ var; else inactive heap = inactive heap [ var; g
g
Figure 6.9: Active/Inactive Variable Partitioning. Procedure: group globals() Input: active globals Output: active globals, grouped into temporal a�nity sets Method:
for var1 2 active globals f for var2 2 active globals f if (temporal a�nity(var1, var2) > AFFINITY THRESHOLD) f active globals = active globals - var2; var1.group = var1.group [ var2; merge(var1.pro le, var2.pro le, 0); g
g
g
Figure 6.10: Temporal A�nity Set Generation. Function temporal affinity(A, B) returns the temporal a�nity of A to B, de ned to be the fraction of execution time in which both variables were active at the same time. a�nity sets. The algorithm selects a global variable and scans all other global variables looking for others with a high temporal a�nity. Temporal a�nity is computed as the fraction of execution time in which both variables were active at the same time. If two variables have temporal a�nity greater than AFFINITY THRESHOLD, they are placed in the same temporal a�nity set. This process continues until all variables have been grouped into temporal a�nity sets. By grouping variables with similar reference characteristics into the same same cache block, cache block prefetch utility may increase. Only global variables are grouped into temporal a�nity sets. Heap variables cannot be grouped because the heap allocator used has a minimum allocation size comparable to the target cache block sizes, leaving insu�cient space within cache blocks for multiple heap allocations. For target caches or levels of the memory hierarchy with larger blocks, this algorithm should be applied to heap variables as well.
89
Address Assignment After all active variables have been grouped into temporal a�nity sets, the process of address assignment begins. Address assignment determines the nal address for variables while trying to minimize inter-variable con ict. During address assignment, global variables are assigned an absolute address. Stack and heap variables are assigned a preferred alignment in the data cache, which is later enforced at run time by the modi ed system libraries. As shown in Figure 6.8, the entire stack is placed rst, aligned to the rst set of the cache. After the stack is placed, global variables are assigned addresses by the function assign global addresses(), and nally heap variables are assigned cache alignments by the function assign heap alignments(). The global variable assignment algorithm is shown in Figure 6.11. The global variables are scanned in descending order of reference density (i.e., most frequently used variable rst) for the variable that if placed at the next available address in the data segment will induce the least number of predicted con ict misses. Con ict misses are predicted with the con ict map. The con ict map is a reference pro le for the target cache, updated after variables are placed to show how many pro led references are being made to a particular cache set at a particular time. With this information, the placement algorithms can predict the con ict induced by any variable placement. The function conflict(A, B, C) computes the con ict between pro les A and B by rst projecting pro le B onto pro le A starting at index C in the space dimension of pro le A. The function then computes the product of the reference counts that overlap in both the time and space dimensions. Using this approach, the estimated con ict will be small if the variable is placed into the cache and the cache in infrequently reference when the variable is frequently referenced. Conversely, when the variable projects onto an frequently referenced portion of the cache, the estimated con ict will be higher. The con ict map is updated with the reference pro les of placed variables only after an entire pass through the data cache. This strategy ensures that variables from the same image of the cache (in memory) do not con ict with each other during placement. In the assignment algorithm, the variable pass var tracks which variables have been placed but are awaiting integration into the con ict map. The heap allocation placement algorithm, shown in Figure 6.12, determines the preferred cache alignments for heap allocations. Unlike global variables, heap allocations may be aligned to any set in the cache. Accordingly, the algorithm scans the entire con ict map looking for the point of minimum estimated con ict, and places the heap variable at that point. (If the algorithm determines the variable should not be aligned, it is assigned an alignment of -1.) While the algorithm computes the preferred alignment for all heap variables, the heap allocation placement algorithm only forces cache alignments (by setting the variable property force alignment to TRUE) on heap variables with the following characteristics:
90 Procedure Input: Output:
assign global addresses() con ict map, active globals, inactive globals active globals, inactive globals, with all variables assigned an address
Method:
addr = DATA BASE; pass = addr / BASE CACHE SIZE; for 1 to jactive globalsj f min con ict = MAX INT; for var 2 active globals in descending ref density f c = con ict(con ict map.pro le, var.pro le, addr % BASE CACHE SIZE); if (c < min con ict) f min con ict = c; min var = var; g
g
min var.addr = addr; addr = addr + min var.size; active globals = active globals - min var; pass vars = pass vars [ min var.group; if ((addr / BASE CACHE SIZE) != pass) f for var 2 pass vars f merge(con ict map, var.pro le, var.addr % BASE CACHE SIZE); pass vars = pass vars - var; g
g
g
pass = addr / BASE CACHE SIZE;
/* place inactive global variables */ for var 2 inactive globals f var.addr = addr; addr = addr + var.size; g
Figure 6.11: Global Variable Address Assignment. DATA BASE is the base address of the data segment. The function conflict(A,B,C) computes the con ict between A and B starting at index C in the space dimension A.
� The heap variable's name cannot have more than INSTANCE THRESHOLD concurrent instances during any pro led execution.
� The heap variable must have a reference density (as indicated in the summary pro le) of at least HEAP THRESHOLD.
The rst requirement ensures that alignments are not placed on heap variable names with many concurrent instances, which could induce many intra-variable con ict misses. The pro ler tracks the maximum number of concurrent instances created for any variable name. If the value is greater than INSTANCE THRESHOLD, the allocation is never aligned. The second condition reduces variable alignment memory overhead (incurred during placement of heap variable) by only forcing alignment on variables that are frequently referenced. These variables have the best chance of negating any performance penalties due to increased memory usage incurred when aligning heap allocations. Variables not marked with forced alignment may also be allocated with the correct alignment, however, this will occur only if no extra memory overheads are incurred.
91 Procedure: assign heap alignments() Input: con ict map, active heap, inactive heap Output: active heap, inactive heap, with all variables assigned an alignment Method:
for var 2 active heap in descending ref density f min con ict = MAX INT; for i = 0 to BASE CACHE SIZE-1 f c = con ict(con ict map.pro le, var.pro le, i); if (c < min con ict) f min con ict = c; min index = i; g
if (var.max instance < INSTANCE THRESHOLD) f if (var.ref density >= HEAP THRESHOLD) var.force alignment = TRUE; var.alignment = min index; merge(con ict map, var.pro le, var.alignment);
g g
else var.alignment = -1;
/* place inactive heap allocations */ for var 2 inactive heap var.alignment = -1;
Figure 6.12: Heap Variable Address Assignment. Before completion, both placement algorithms place the inactive variables. The placement algorithm does not attempt to minimize con icts when placing inactive variables. Since inactive variables have few accesses, they induce few con ict misses irregardless of their placements. To preserve any spatial locality that existed in the original program, inactive global variables are placed in the same order as found in the original program. Inactive heap variables are marked as not requiring a cache alignment. The order of placement, i.e., rst stack, then global, and nally heap, is important for good placement performance. The stack typically has a large area of active use and would be di�cult to place e�ectively after the global or heap variables. Heap allocations are best placed after the global variables because they may be placed anywhere in the cache, whereas global variables must be placed sequentially in the data segment. Placing variable candidates with the most placement freedom last appears to produce better placement solutions. The running time of the placement algorithms can be very long. The global assignment routine, i.e., place global variables(), is the most expensive algorithm with a running time O(G2 ST ), where G is the number of global variables, S is the set size of the cache, and T is the number of buckets in the time dimension of pro les. To reduce running time, a branch and bound variation of the assignment algorithms was employed in the implementation of the placement algorithms. While searching for variables with minimal con ict, the minimum con ict yet found is tracked and passed to the function that estimates con ict, i.e., conflict(). If the current call to conflict() computes a con ict value
92 Input: Output: Method:
executable, with symbol table including variable addresses and size, reference relocations, and variable placement map executable, with relocated data segment and modi ed system libraries /* read inputs */ read executable segments(); read symbol table(); read relocation table(); read placement map(); /* attach each relocation to variable it references */ bind relocations to symbols(); /* do the placement */ update variable placement(); /* x up images */ xup relocations(); rearrange data segment(); replace startup() replace malloc() link dynamic map(); /* write output */ write executable segments();
Figure 6.13: Post-pass Link Algorithm (KLINK). higher than the passed minimum con ict, con ict evaluation is immediately terminated, and the search continues with another variable. This modi cation signi cantly improved the running time of the placement algorithm, e.g., placement for GCC dropped from a running time of 20 minutes to less than 30 seconds.
6.4.3 Placement Mechanisms The placement mechanisms enforce the placement decisions made by the placement tool. For global variables, placement can be enforced at link time; for stack and heap variables, placement must be enforced at run time with modi ed system codes, e.g., malloc(). In the implemented framework, global variable placement is performed by a modi ed linker, and stack and heap variable placement is performed by modi ed system libraries. Figure 6.13 lists the algorithm used by the modi ed linker KLINK. The modi ed linker places global variables as speci ed by the placement map (generated by PLACETOOL), and replaces the startup module (i.e., crt0.o) and heap allocation routines (i.e., malloc.o) with versions capable of enforcing stack and heap allocation alignments. KLINK is implemented as a post-pass link phase within GNU GLD. To place global variables, KLINK rst binds relocations (i.e., references to variables in the text and data segments) to the global variables they reference. Global variables are then relocated to their new addresses and all relocations a�ected are xed. Finally, the data segment is shu�ed to match the
93 new placement map, and the updated segments are written to the executable. The standard ECOFF object le format used in the SimpleScalar tool set (detailed in Chapter 2) was unable to accommodate global variable placement in its current form. First, the symbol tables have no complete record of the start and ending addresses of each variable. Moreover, many global variables are not even listed in the symbol table. To reduce the size of object les, any variable that is not externally referenced (e.g., local labels, static variables, private literals) is not recorded in the symbol table. Any references to these variables are converted to a more compact segment-relative reference format. Finally, reordering can mix initialized and uninitialized variables, forcing some uninitialized variables to be initialized if they are placed amid initialized variables. After much judicious modi cation of the compiler, assembler, and linker, all these problems were overcome. All variable symbols were extended to include variable size information, and all variable references were required to be symbol-relative, rather than segment-relative. In addition, all variables up to and including the last initialized variable in the data segment are initialized. These changes did increase executable sizes, sometimes more than 100%. However, this e�ect results from the limited extensibility of ECOFF object les; most executable overheads could be eliminated with a more accommodating object le design. Heap allocation placement is implemented at run time using the modi ed malloc() implementation shown in Figure 6.14. The modi ed malloc() rst computes the heap allocation name, an integer value, by XOR-folding NAME DEPTH return addresses from the stack (returned by the function return address()) and truncating the value to be smaller than MAX NAME. The name generated is used to index the placement map (generated by PLACETOOL), which indicates the alignment requirements for this particular allocation. If the requested alignment is greater than or equal to zero, the allocation is forced to the speci ed alignment using forced aligned malloc(). The modi ed heap allocator is based on a power-of-two heap allocator, thus, it is often the case that su�cient internal fragmentation exists in an allocation to accommodate a requested alignment without incurring memory overheads. Since an aligned allocation may begin anywhere within the power-of-two size allocation block, a back pointer is required immediately preceding the aligned block to indicate the start of the allocation block.
6.5 Experimental Evaluation This section evaluates the performance of cache-conscious data placement by examining the cache performance and run-times of programs compiled with various placement strategies.
94 Input: Output:
allocation request size, heap allocation map heap allocation, possibly aligned to requested cache alignment
Method:
/* compute heap allocation name */ name = 0; for (i=0; i < NAME DEPTH; i++) name = hash(name, return address(i)); name = name % MAX NAME; /* determine allocation priority, force alignment, if needed */ if (place map[name].force) f p = forced aligned malloc(place map[name].alignment, place map[name].set size); else p = aligned malloc(place map[name].alignment, place map[name].set size); q = align to(p, size, heap map[name].alignment); update backpointers(p, q); return q;
Figure 6.14: Modi ed Heap Allocator. The function return address(i) returns the return address in the ith stack frame up the stack. The functions forced aligned malloc() and aligned malloc() allocate storage with the requested cache alignment. The former always returns aligned storage, increasing the allocation size if needed.
6.5.1 Methodology All pro ling and placement tools were implemented within the SimpleScalar tool set (described in Chapter 2). The implementation, while challenging due to the many system components impacted, was manageable by a single person in only four months time, totaling less than 6000 lines of code including comments. All experiments were performed with compilers and simulators described in Chapter 2. For each program, ve executables were generated using the following placement strategies:
Natural: Natural placement is the variable placement resulting from use of the standard compiler, linker, and system libraries.
Random: Random placement shu�es all global variables in the data segment, and aligns the stack and heap allocations to a randomly selected cache block.
CCDP Real: Cache-conscious data placement (CCDP) employs the data placement algorithms and
mechanisms detailed in Section 6.4 with the placement parameters speci ed in Table 6.1. The placement parameters were chosen after an extended period of tuning the placement algorithms. Variable placement is directed with summary pro les generated with the pro le inputs listed in Table 6.2. A di�erent input, also listed in Table 6.2, is used during program analysis.
CCDP Ideal: This placement strategy is identical to CCDP Real placement, with the exception that
pro ling and analysis occur on the same input, i.e., the analyzed inputs listed in Table 6.2. (Note, ideal is not intended to imply optimal placement, rather it is the case where the heuristic placement algorithms are directed with perfect pro le information.)
95 Parameter NAME DEPTH MAX NAME HEAP THRESHOLD ACTIVE THRESHOLD AFFINITY THRESHOLD BASE CACHE SIZE INSTANCE THRESHOLD LOW THRESHOLD MID THRESHOLD PROFILE ARRAY SIZE PROFILE BUCKET SIZE
Value 4 frames 256 0.25 refs/byte 0.25 refs/byte 90% 8192 bytes (direct-mapped) 1 2.344E-4 refs/byte-cycle 4.688E-4 refs/byte-cycle 256 buckets 32 bytes
Table 6.1: Placement Algorithm Parameters. LOW THRESHOLD and MID THRESHOLD are the reference densities used by the data pro ler (DPROF) to compress data pro les, i.e., each pro le bucket is reduced to the two-bit values NONE, LOW, MID, and HIGH. PROFILE ARRAY SIZE and PROFILE BUCKET SIZE specify pro le array sizes (number of pro le buckets) and bucket sizes (in bytes) for the time and space dimension of all variable pro les, respectively. Program Compress Doduc GCC Ghostscript Go MPEG play Perl Vortex YACR-2
Arguments and Inputs Analyzed Pro led in compress, in.Z doducin smallin, tinyin 1stmt.i 1toplev.i, 1varasm.i FAC-page-4.ps FAC-page-1.ps, FAC-page-10.ps 50 9 2stone9.in 2 21 5stone.in, 40 8 coil.mpg ts2.mpg, moonland.mpg tests.pl sort.pl, grep.pl vortex25.in vortex25a.in, vortex25b.in input2.in input1.in, input3.in
Table 6.2: Analyzed and Pro led Inputs.
Simple: Simple placement employs a simpler, less expensive data placement algorithm. Pro le in-
formation is limited to a single reference density for each variable. During placement, only active/inactive partitioning is applied, and variables within a partition are placed in natural order. Stack and heap allocations employ natural placement.
Nine programs were analyzed, selected because they exhibit moderately high data cache miss rates for cache geometries found in current-generation microprocessors. The programs are described in Chapter 2. Table 6.2 lists their inputs and arguments used for pro ling and analysis. Table 6.3 gives the baseline execution statistics for programs compiled with natural placement. All execution statistics were collected using the baseline simulators described in Section 2. Figure 6.15 shows the cache performance of the programs with natural placement for 2k, 8k, and 32k direct-mapped data caches. The benchmarks have relatively high data cache miss rates on small caches, with a few performing poorly on caches as large as 32k bytes. The bars show the breakdown of inter- and intra-variable misses. An intra-variable miss is de ned as any miss where the replaced and fetched data both come from the same variable. These misses represent a special class of misses
96 Program
Insts Loads Stores Miss Rate (% of refs) Mem Usage (Mil.) (Mil.) (Mil.) I-cache D-cache D-TLB (K bytes) Compress 62.4 15.0 7.6 +0.00 16.22 4.241 442 Doduc 1,599.9 544.0 196.2 3.90 4.12 +0.000 148 GCC 123.3 29.1 20.2 3.26 4.93 0.013 1,223 Ghostscript 306.3 73.6 38.7 0.93 3.10 0.030 5,166 Go 315.3 84.9 30.0 3.65 7.95 0.019 591 MPEG play 529.5 119.9 47.4 1.77 18.35 0.132 3,032 Perl 200.9 53.1 34.7 5.48 7.52 0.189 3,810 Vortex 688.7 182.9 156.0 5.11 6.51 0.222 13,016 YACR-2 429.7 59.3 19.0 +0.00 4.11 +0.000 199
Table 6.3: Program Statistics before Cache-Conscious Data Placement. for this study, since they cannot be eliminated through variable placement.2 The remaining miss component, the inter-variable misses, are the result of interactions between variables, and represent an upper bound on the performance improvements that could be achieved with cache-conscious data placement. Clearly, inter-variable interactions account for a signi cant fraction of data cache misses. As cache size increases, the fraction of misses due to inter-variable interactions grows as well. Figure 6.16 also shows baseline program cache performance on 2k, 8k, and 32k direct-mapped data caches. The bars in this graph show miss rates broken down by the three miss classes: con ict, capacity, and compulsory misses.3 Con ict and capacity misses dominate the misses, both decreasing when cache sizes increase. The compulsory miss component is very small for all programs.
6.5.2 Cache Performance Figure 6.17 shows the miss rates found with an 8k direct-mapped data cache for each of the ve placement strategies. The rst bar, labeled Natural, is the cache performance of the baseline programs using natural placement. Comparing natural placement to random placement (i.e., the bars labeled Random) reveals natural placement to be a consistently better placement strategy. Figure 6.18 gives insights into why this may be. The graph shows the percent change in the miss ratio when going from natural to random placement (a positive change means more misses for random placement). The change in miss rates is also broken down by the three miss class, i.e., con ict, capacity, and compulsory misses. As shown in the graph, random placement increases both the con ict and capacity misses for most of the programs. The compulsory miss component is also increased, although this is di�cult to see because the component is very small. Clearly, properties of natural placement 2 This may not the case when the last block of a variable is interacting with itself and the variable does not completely ll either cache block. In this case, it may be possible to remove the interaction by relocating the variable. However, this anomaly is limited to at most one pair of cache blocks in variables with sizes close to a multiple of the cache set size, making this case very infrequent. 3 Con ict misses are computed as the di�erence between the miss rate of the target cache and a fully-associative cache of the same size. Compulsory misses are computed by tracking the frequency storage is rst touched. The remaining misses are classi ed as capacity misses.
97 35
Miss Rate (% refs)
30
25
20
15
10
5
0 2k 32k 8k 2k 32k 8k 2k 32k 8k 2k 32k 8k 2k 32k 8k 2k 32k 8k 2k 32k 8k 2k 32k 8k 2k 32k 8k
Comp Doduc
GCC
GS
Go
Inter-variable
MPEG
Perl
Vortex
YACR
Intra-variable
Figure 6.15: Program Miss Rates Broken Down by Variable Interaction. 35
Miss Rate (% refs)
30
25
20
15
10
5
0 2k 32k 8k 2k 32k 8k 2k 32k 8k 2k 32k 8k 2k 32k 8k 2k 32k 8k 2k 32k 8k 2k 32k 8k 2k 32k 8k
Comp Doduc
GCC Conflict
GS
Go Capacity
MPEG
Perl
Vortex
YACR
Compulsory
Figure 6.16: Program Miss Rates Broken Down by Miss Class.
98 20 18
Miss Rate (% refs)
16 14 12 10 8 6 4 2 0
Comp Doduc GCC
GS
Natural CCDP Ideal
Go
MPEG
Random Simple
Perl
Vortex YACR
CCDP Real
Figure 6.17: Performance of Placement Algorithms { 8k Direct-Mapped Cache. work to reduce all classes of misses. The better performance of natural placement appears to be the result of how programmers write programs. Logically related global and stack variables are often de ned next each other in the program source. Logically related heap allocations are often allocated near each other in time. Both these actions work to keep logically related variables close to each other in memory. This simple process of grouping related variables serves to reduce all classes of misses. Con ict misses are reduced because the grouped variables are close enough that they do not con ict with each other. Capacity misses are reduced because the grouped variables have signi cant temporal locality which serves to increase cache line utilization. Compulsory misses are reduced because grouped variables are often placed in the same cache block which more e�ectively utilizes cache line prefetch. The performance of natural placement clearly sets the bar high for any arti cial placement scheme. The bars labeled CCDP Real in Figure 6.17 shows the performance of programs compiled with cache-conscious data placement. For these experiments, di�erent inputs were used for pro ling and analysis. Cache performance improvements over natural placement were fairly good, with many of the experiments resulting in more than a 10% reduction in total cache misses. The best improvement was a 25% reduction in data cache misses for YACR-2. The only program that su�ered from more misses was Go, although the increase was very small. Many of the misses in Go are the result of accesses to the playing board array. The summary pro les did not do a good job of capturing typical accesses to
99 70
124
Percent Change in Miss Rate
60 50 40 30 20 10 0
-10
Comp Doduc Miss Rate (Total)
GCC Conflict
GS
Go
MPEG Capacity
Perl
Vortex YACR Compulsory
Figure 6.18: Impact of Random Placement for 8k Direct-Mapped Cache. this variable. When optimized and run with the same input, shown by the bars labeled CCDP Ideal in Figure 6.17, the placement optimizations were able to improve cache performance. Figure 6.19 shows the percent change in miss ratio broken down by miss class when going from natural to cache-conscious data placement. The placement optimizations removed a signi cant fraction of misses for many of the programs. As shown by the results for Doduc and MPEG play, the heuristic placement algorithm appears to be favoring placement solutions that minimize con ict misses, sometimes at the expense of capacity misses. This e�ect is likely the result of the con ict minimization phase of placement running last, thereby giving preference to placements with low inter-variable con ict. The heuristic placement algorithm would likely bene t from modi cations that limit interactions between placement phases. Overall, summary pro les appear to working well. As the bars labeled CCDP Ideal in Figure 6.17 show, placement with perfect pro le information only results in small improvements in cache performance. With YACR-2, cache performance is actually degraded with perfect pro le information { this anomaly is due to the heuristic search algorithms. Since the heuristic placement algorithm works to nd good placement solutions, not optimal ones, it is entirely possible for a summary pro le input to produce a better placement solution than a perfect pro le input. Table 6.4 quanti es the instruction count and memory overheads for cache-conscious data placement. All overheads are expressed as a percent change in the baseline execution statistics given in in
100 5
Percent Change in Miss Rate
0
-5
-10
-15
-20
-25
Comp Doduc Miss Rate (Total)
GCC Conflict
GS
Go
MPEG Capacity
Perl
Vortex YACR Compulsory
Figure 6.19: Impact of CCDP Placement for 8k Direct-Mapped Cache. Table 6.3. Execution overheads are the result of extra instructions and memory usage needed to implement stack and heap variable placement. Instruction execution overheads are very small. Memory overheads are much larger. These large overheads are the result of many small, frequently accessed storage allocations being aligned to a speci c point in the cache. To place these allocations, the modi ed storage allocator (detailed in Section 6.4) can increase their size up to the set size of the cache. Data TLB miss rates rates, however, suggest that while the programs are mapping more memory to align dynamic allocations, little of the actual memory is being touched. In most experiments, the data TLB miss rates decreased. Other virtual memory impacts, e.g., page fault rates, were not measured, but given the small absolute increases in program memory usage and the good performance of the data TLB, they are expected to be small. The last set of bars in Figure 6.17 labeled Simple, show the performance of the simple placement algorithm. Simple placement employs a less complex, less expensive version of the cache-conscious data placement algorithm. It performs active/inactive partitioning, placing all global variables within a partition in natural order. Heap and stack variable allocations employ natural placement. As shown in Figure 6.17, this placement strategy has signi cantly less stability than the more complex cacheconscious data placement algorithm. The reduced performance is primarily due to increased con ict misses. It appears that for consistent cache performance improvements on a direct-mapped cache, the placement algorithm needs to consider how placement decisions a�ect inter-variable con ict.
101 Program Compress Doduc GCC Ghostscript Go MPEG play Perl Vortex YACR-2
Insts Loads +0.00 +0.00 +0.04 +0.00 +0.08 +0.00 +0.16 +0.01 +0.01
+0.00 +0.00 +0.04 +0.00 +0.05 +0.02 +0.14 +0.02 +0.00
Stores +0.00 +0.00 +0.00 +0.00 +0.01 +0.00 +0.15 +0.00 +0.00
I-cache +0.00 +0.00 +0.00 +0.00 +0.00 +0.00 +0.09 +0.01 +0.00
Miss Ratio Mem Usage D-cache D-TLB -1.97 -0.06 +8.14 -10.19 0.00 0.00 -8.72 -0.02 +24.20 -22.58 -0.06 +1.86 +1.76 -0.03 +4.74 -0.27 -0.00 +1.85 -5.59 -0.03 +7.14 -14.29 +0.01 +0.03 -24.57 +0.00 +70.35
Table 6.4: Percent Change in Program Statistics after Cache-Conscious Data Placement.
6.5.3 Impact of Varied Cache Geometry Since variable placement optimizations occur at compile time, the placement algorithm must optimize cache performance for a single target cache geometry. This section examines the performance of programs running on cache geometries other than the target cache geometry. Figure 6.20 shows the performance of each program (optimized for execution on an 8k directmapped cache) running on an 8k 2-way set-associative data cache. This con guration eliminates many con icts found in the direct-mapped cache of the experiments in Figure 6.17. Performance improvements a�orded by placement optimization is smaller than for the direct-mapped cache since many of the con ict misses eliminated by cache-conscious data placement no longer exist in the setassociative cache geometry. Simple placement fairs notably better in this con guration, performing nearly as well as cache-conscious data placement for all programs, since the approach is no longer strapped with con ict misses. Figures 6.21 and 6.22 show the performance of the programs running on 2k and 32k direct-mapped caches, respectively. Performance improvements vary more so the smaller cache con guration; performance improvements for Doduc and Perl are lost, while the performance improvements for Ghostscript and Go increased. This variation is likely due to con ict misses induced in the smaller cache sizes that were not considered during variable placement. With a larger cache con guration, i.e., 32k, cacheconscious data placement still improved cache performance for most programs, although improvements were small due to better overall cache performance. The performance of Perl degraded on the larger direct-mapped cache. This case may be the result of more con ict being eliminated (when increasing the cache size) for natural placement than for cache-conscious data placement; the exact cause is still under investigation.
6.5.4 Program Performance Improvements in cache miss rate do not translate directly into program run-time improvements. The impact the placement optimizations have on program performance is a�ected by the program's overall
102 20 18
Miss Rate (% refs)
16 14 12 10 8 6 4 2 0
Comp Doduc GCC
GS
Natural CCDP Ideal
Go
MPEG
Random Simple
Perl
Vortex YACR
CCDP Real
Figure 6.20: Performance of Placement Algorithms { 8k 2-Way Set-Assoc. Cache. 35
Miss Rate (% refs)
30
25
20
15
10
5
0
Comp Doduc GCC Natural CCDP Ideal
GS
Go Random Simple
MPEG
Perl
Vortex YACR
CCDP Real
Figure 6.21: Performance of Placement Algorithms { 2k Direct-Mapped Cache.
103 14
Miss Rate (% refs)
12
10
8
6
4
2
0
Comp Doduc GCC
GS
Natural CCDP Ideal
Go Random Simple
MPEG
Perl
Vortex YACR
CCDP Real
Figure 6.22: Performance of Placement Algorithms { 32k Direct-Mapped Cache. cache performance and the processor's ability to tolerate cache miss latency. A better measure of program performance impacts requires a more detailed analysis. To gauge the performance of cacheconscious data placement in the context of a realistic processor model and memory system, program performance was examined running on the baseline in-order and out-of-order superscalar timing simulators detailed in Chapter 2. Table 6.5 lists the baseline program performance (i.e., compiled with natural placement) on the in-order and out-of-order issue simulators. The column, labeled Total Miss CPI, shows the total data cache miss latency per instruction, tolerated or otherwise. For each processor model, the table gives the CPI, and for the data cache miss latency the total exposed latency per instruction, the percent it is of total CPI, and the percent of total miss latency CPI tolerated by the processor model. While the total miss latency CPI is a sizeable fraction of the CPI for many of the programs, both processor models do a fairly good job of tolerating the latency, with the out-of-order issue processor model tolerating more cache miss latency for all the programs. Figure 6.23 shows program speedups while running on the baseline in-order and out-of-order timing simulators. Performance impacts are small for both models. All speedups were less than 6% for the in-order issue processor, all less than 2% for the out-of-order issue processor. Performance for Go was worse due to its poorer cache performance after cache-conscious data placement. Performance impacts were small because both processors are tolerating much of the cache miss latency eliminated. Since
Compress Doduc GCC Ghostscript Go MPEG play Perl Vortex YACR-2
Program 0.358 0.113 0.112 0.066 0.162 0.330 0.181 0.186 0.043
Total Miss CPI
In-order Miss CPI Exposed % CPI % Tolerated 0.221 24.84 38.31 0.041 3.60 63.97 0.050 5.53 55.51 0.042 4.85 36.51 0.087 7.57 46.12 0.188 18.42 43.01 0.068 6.24 62.39 0.111 11.99 40.24 0.030 4.67 30.82 0.655 0.905 0.763 0.633 0.954 0.729 0.944 0.805 0.427
CPI
Out-of-order Miss CPI Exposed % CPI % Tolerated 0.118 18.00 67.07 0.015 1.60 87.19 0.034 4.45 69.68 0.028 4.41 57.70 0.059 6.20 63.49 0.136 18.62 58.87 0.043 4.59 76.06 0.079 9.80 57.59 0.020 4.73 53.03
Table 6.5: Baseline Program Performance.
0.889 1.131 0.901 0.864 1.153 1.021 1.091 0.927 0.637
CPI
104
105 6
5
Percent Speedup
4
3
2
1
0
-1
Comp Doduc GCC
GS
Go
In-Order Issue
MPEG
Perl
Vortex YACR
Out-of-Order Issue
Figure 6.23: Performance on Detailed Timing Simulator { 8k Cache.
% Reduction in Exposed Miss Latency
80 70 60 50 40 30 20 10 0 -10
Comp Doduc GCC
GS
In-Order Issue
Go
MPEG
Perl
Vortex YACR
Out-of-Order Issue
Figure 6.24: Reduction in Exposed Miss Latency { 8k Cache.
106 the out-of-order issue processor has better latency tolerating capabilities, speedups are smaller. Figure 6.24 shows the percent reduction in the exposed data cache miss latency component. In this light, performance impacts are much larger. The placement optimizations were able to eliminate much of the exposed cache miss latency. For the in-order issue processor, many of the programs saw more than a 30% reduction in exposed cache miss latency; reductions were less for the out-of-order issue processor.
6.6 Related Work Many parallels to this work can be found in software techniques developed for improving instruction cache performance. Techniques such as basic block re-ordering [Dav95, Wu92, PH90], function grouping [Wu92, PH90, Fer76, Fer74, HG71], and text ordering based on control structure [McF91] have all been shown to signi cantly improve instruction cache performance. Like this work, the approaches usually rely on pro le information to guide heuristic algorithms in placing instructions to minimize instruction cache con icts, and maximize cache line utilization and block prefetch. Unlike this work, some of the studies concentrate on virtual memory system performance, i.e. TLB miss and page fault rates. The approaches presented in this paper would certainly extend to lower levels of the memory hierarchy as well; this is a potential area for future exploration. A number of peripheral works employ data relocation to improve data cache performance. Page coloring [BLRC94, LBF92, Kes91] techniques have leveraged the memory mapping capability of virtual memory to reduce con icts in physically indexed caches. User-programmable cache set mappings [DS91] have been proposed to provide the same bene ts. Compiler-directed dimension extension [CL89] works to relocate data within large arrays, giving opportunity to improve data cache performance when a large array con icts with itself. Data placement optimizations have been used to reduce false sharing in shared memory multiprocessors [JE95]. Compiler-directed variable partitioning has been proposed as an approach to reduce inter-variable interactions [Mue95] for the purpose of improving the predictability of cache access latencies in real-time systems. The Scout operating system [MMO+ 94] employs data placement to reduce data cache con ict between active protocol stacks. The approach used to name heap variables was adopted from [BZ93]. The history of the development of this work is relevant related work. The initial placement strategy tried to ll the padding space created by variable alignment with other variables. By packing variables, the data segment size could be reduced, sometimes by as much as 10%, with the thought that cache blocks would be better utilized and cache performance would improve. It quickly became evident this was a poor placement strategy, nearly all experiments resulted in an increase in cache misses. This result led to the development and evaluation of random placement and the observation that natural placement performs very well. Next, the active/inactive variable partitioning algorithm (i.e., the simple
107 placement strategy in Section 6.5) was tried. This algorithm used pro le information to improve cache line utilization. While this algorithm performed well for some programs, others performed very poorly, especially on direct-mapped caches due to increased inter-variable con icts. It soon became evident that any e�ective approach must also work to minimize con ict misses. This observation led to the cache-conscious data placement algorithm described in this chapter. Initially, only global variable placement was optimized, but this approach also lacked good stability due to occasional con icts that arose with stack and heap variables. The algorithms were then expanded to accommodate placement of stack and heap variables as well, this produced the current generation algorithms which have been shown to consistently improve cache performance for the targeted workloads and cache geometries.
6.7 Chapter Summary Cache-conscious data placement was introduced as a software-based technique to improve data cache performance by relocating variables in the virtual memory space. The approach employs data pro ling to characterize variable usage. Pro le information then guides heuristic variable placement algorithms in nding a variable placement solution that decreases predicted inter-variable con ict, and increases predicted cache line utilization and block prefetch. The generated placement solution is implemented using a modi ed linker and system libraries. Four placement strategies were examined in detail using detailed timing simulation: natural, random, cache-conscious data placement, and simple. Natural placement sets the bar high for arti cial placement measures. Compared to random placement, natural placement was found to have consistently better cache performance. Programmers group logically related variables which results in natural placements with good temporal and spatial locality between variables. Cache-conscious data placement e�ectively improved data cache performance, eliminating more than 10% of all misses for many of the programs tested. Cache performance degraded for only one of the tested program, the result of poor summary pro le information. Overall, summary pro le performance was excellent, with only slight improvements in placement performance when programs were optimized and analyzed with the same input. A simpli ed version of the placement algorithms was also evaluated. The simpler algorithm used only reference densities (instead of pro les) and performed only active/inactive variable partitioning. This placement strategy, while performing well for some programs, lost the consistent performance improvements found with the more complex placement algorithm. The degradation for some programs was due to lack of consideration during placement for con ict misses, suggesting that detailed pro le information and con ict-miss sensitive placement algorithms will be required for consistent performance improvements, especially for direct-mapped caches. Cache geometries were also varied to see what e�ect this had on a program that was optimized for
108 another cache geometry. With the addition of associativity, much of the performance improvements found with cache-conscious data placement were lost because con ict miss reductions were no longer eliminated. With smaller cache sizes, cache performance often degraded due to con ict misses induced but not considered by the placement algorithms. Larger cache sizes still saw consistent performance improvements, although impacts were smaller due to the decreased miss rates for the larger caches. Finally, the impact cache-conscious data placement had on exposed load latency was explored through detailed timing simulation. Programs were simulated running on a 4-way superscalar processor with one level of instruction and data cache memory. The latency tolerating capability of the processor was varied by examining performance on simulators supporting in-order and out-of-order instruction issue. Cache-conscious data placement was able to remove a large fraction of exposed miss latency for many of the programs tested. However, program speedups were generally small, especially for the out-of-order issue processor, since the processors were already tolerating a large fraction of data cache miss latency.
Chapter 7
109
Conclusion As processor demands quickly outpace memory, the performance of load instructions becomes an increasingly critical component to good system performance. This thesis contributes four novel load latency reduction techniques, each targeting a di�erent component of load latency: address calculation, data cache access, address translation, and data cache misses.
7.1 Thesis Summary For many codes, especially integer codes with good cache performance, exposed address calculation latencies account for a signi cant fraction of total execution time. This thesis introduces a pipeline optimization, called fast address calculation, that permits e�ective address calculation to proceed in parallel with data cache access, thereby eliminating the extra cycle required for address calculation. The technique employs a simple circuit to quickly predict the portion of the e�ective address needed to speculatively access the data cache. If the address is predicted correctly, the cache access completes without an extra cycle for address calculation. If the address is mispredicted, the cache is accessed again using the correct e�ective address. The predictor has minimal impact on cache access latency, adding only a single OR operation before data cache access can commence. Prediction veri cation is also very fast and decoupled from the cache access critical path, ensuring that pipeline control logic impacts are minimal. Detailed timing simulations of a 4-way in-order issue superscalar processor extended to support fast address calculation found good speedups for all the programs tested. The experiments showed an average speedup of 14% for the integer codes and 6% for the oating point codes. Simple software support was also developed to improve prediction accuracy. Simulated performance with software support improved the average speedup to 19% for the integer codes and 7.5% for the oating point codes. Address calculation latency, however, is at most one half of the latency of loads, leaving one or more cycles of cache access latency exposed to extend execution critical paths and stall instruction issue. This thesis further extends the latency reduction capability of fast address calculation by combining it with an early-issue mechanism. The resulting pipeline designs are capable of reducing the latency of load instructions by up to two cycles. For a pipeline with one cycle data cache access, loads can
110 complete before reaching the execute stage of the pipeline, creating what is termed a zero-cycle load. A zero-cycle load allows subsequent dependent instructions to issue unencumbered by load instruction hazards, resulting in fewer pipeline stalls and increased overall performance. Detailed evaluations using a 4-way in-order issue processor simulator extended to support zerocycle loads found an average speedup of 45% for the integer codes and 26% for the oating point codes. Performance for the integer codes was nearly on par with programs running on an out-of-order issue processor (without support for zero-cycle loads). Speedups on an out-of-order issue processor simulator extended to support zero-cycle loads were less due to the latency tolerating capability of the execution model. On architectures with few registers, the frequency of loads and their impact of program performance increases signi cantly. Providing an 8 register architecture with limited zerocycle load support resulted in performance comparable to a 32 register architecture, suggesting that the approach may be able to negate the impacts of too few architected registers. In support of the proposed cache hit optimizations, this thesis presents four new high-bandwidth address translation mechanisms. These new mechanisms feature better latency and area characteristics than current TLB designs, providing architects with e�ective alternatives for keeping address translation o� the critical path of loads. Two designs are borrowed from traditional high-bandwidth memory design techniques, creating interleaved and multi-level TLB designs. In addition, two more designs crafted speci cally for high-bandwidth address translation are introduced. Piggyback ports are proposed as a technique to exploit spatial locality in simultaneous translation requests, allowing accesses to the same virtual memory page to combine their requests at the TLB access port. Pretranslation is proposed as a technique for attaching translations to base register values, making it possible to reuse a single translation many times. Extensive simulation-based studies were performed to evaluate address translation designs using the proposed high-bandwidth mechanisms. A number of designs show particular promise. Multi-level TLBs with as few as eight entries in the upper-level TLB nearly achieve the performance of a TLB with unlimited bandwidth. Piggyback ports combined with a lesser-ported TLB structure, e.g., an interleaved or multi-ported TLB, also perform well. Pretranslation over a single-ported TLB performs almost as well as a same-sized multi-level TLB with the added bene t of decreased access latency for physically indexed caches. Finally, this thesis examines a software-based variable placement optimization for reducing the frequency of data cache misses. The approach, called cache-conscious data placement, uses pro leguided heuristics to nd variable placement solutions that decrease predicted inter-variable con ict, and increase predicted cache line utilization and block prefetch. The generated placement solutions are implemented partly at compile-time using a modi ed linker and partly at run-time with modi ed system libraries.
111 Various placement strategies were developed and compared to the performance of natural placement (i.e., the naturally occurring layout of variables). Random placement performed consistently worse than natural placement, revealing natural placement as an e�ective placement strategy that sets the bar high for arti cial placement measures. Cache-conscious data placement e�ectively improved data cache performance, eliminating more than 10% of all misses for many of the programs tested. A simpli ed and less expensive version of the placement algorithm (i.e., with reduced computation and storage requirements) lost the stability of the more complex algorithm, suggesting that for consistent performance improvements the more capable and expensive algorithm is required. Run-time performance impacts were also examined for in-order and out-of-order issue processor models. Cacheconscious data placement was able to remove a large fraction of exposed miss latency for many of the programs tested. However, program speedups were generally small, especially for the out-of-order issue processor, since the processors were already tolerating a large fraction of cache miss latency.
7.2 Future Directions The work in this thesis could be extended in many ways. The following sections suggest a number of promising directions to pursue.
7.2.1 Less-Speculative Fast Address Calculation Fast address calculation uses carry-free addition to compute the set index portion of the e�ective address computation. In some designs, it may be possible to account for some carries in the set index computation after data cache access begins by steering the row decoders after cache access starts or late-selecting the correct word from multiple cache rows. Consider a simple example that highlights the rst possibility: If a carry is generated into the set index portion of the e�ective address computation, the resulting data cache row selection will be o� by at most one row. If the carry output of the block o�set computation were used to steer the last level of row decode, row selection and block o�set carry generation could proceed in parallel. The design would no longer incorrectly predict the wrong cache row if a carry were generated out of the block o�set computation. It may be possible to compute other carries in the set index computation and use these carries to steer row decoding as well. The degree of which this may be done depends on the speci cs of the data cache design and implementation. The second approach works by increasing the opportunities to late-select cache data. If a carry cannot be computed prior to data cache row access, it may be possible to compute both possible outcomes of the address computation, read both data cache rows, and late-select the data in the column select logic using the outcome of the carry computation. A similar approach is employed in carry-select adders [HP90].
7.2.2 Combining Stateful and Stateless Address Predictors
112
Fast address calculation has a very predictable and easy to identify failure mode, i.e., loads that use register+register mode addressing constitute nearly all of the prediction failures. These accesses are the result of array accesses that the compiler cannot strength-reduce. Stateful address predictors, like the load delta table [EV93], have been shown to work well on array accesses. It seems likely that combining the two approaches could produce more accurate, albeit more expensive, predictor designs. Similar hybrid approaches have worked well for branch prediction [ECP96].
7.2.3 Leveraging Address Prediction Information A common mechanism used repeatedly in this thesis is address prediction. Fast address calculation employs a stateless set index predictor, as do zero-cycle loads. Pretranslation predicts the next virtual page address a base register will access. Reliable address prediction information could be used as mechanism to improve the performance of a number of other pipeline processes, including cache block prefetch, access/execute computation decomposition, and load/store disambiguation.
7.2.4 Additional Compiler Support for Zero-Cycle Loads The two most common failure modes for zero-cycle loads are failed fast address calculations and register con icts (i.e., data hazards between un nished instructions and the inputs of the zero-cycle load). While software support was employed to improve the performance of fast address calculation, no software support was available to reduce register con icts. By increasing the apparent latency of instructions that produce pointer values, the instruction scheduler would work to insert more instructions between generation of a pointer value and its rst use by a load, thereby reducing the load's exposure to register con icts. Similar approaches have been shown to work well for \AGI" (or late execute) style pipelines [GM94].
7.2.5 Exposing Address Translation to the Compiler The pretranslation technique described in Chapter 5 performed well, but overall worse than a samesized L1 TLB. The primary reason for this di�erence lies in the mechanism by which each design reuses translations. The pretranslation design is only able to reuse a translation whenever a register pointer is reused, whereas the multi-level TLB design is able to reuse a translation whenever an address is reused. Since the latter case is more frequent, the L1 TLBs generally perform better than same-sized pretranslation designs. By exposing the ine�ciencies of the pretranslation mechanism to the compiler, it should be able to improve the performance of the approach. The compiler could mark instructions which create new register pointers, allowing the processor to initiate pointer value translation when a new pointer value
113 is created, rather than when it is rst used by a load or store. In addition, simple modi cations to the compiler's register allocation priorities (e.g., make pointer value spills more expensive than non-pointer spills) would work to increase the lifetime of register pointers.
7.2.6 Improving Cache-Conscious Data Placement While cache-conscious data placement gave fairly good performance improvements, it was shown that a large portion of the misses caused by inter-variable interactions were una�ected. The following list details modi cations to the current approach that may improve the impact of cache-conscious data placement:
� The current optimization framework favors con ict miss reduction, even at the expense of in-
troducing capacity misses. This e�ect appears to be the result of the ordering of the placement algorithm phases. While the current phase ordering provided the best performance for this framework, modi cations to the algorithms to control phase interactions would likely result in better performance. Phase interactions between register allocation and instruction scheduling algorithms have been e�ectively controlled with heuristic methods [BEH91].
� The current optimization framework places all variables at compile time. While inexpensive and
simple to implement, the approach lacks the ability to adapt to a particular run of the program. A challenging area of future exploration is run-time variable placement. The approach will require a reliable and inexpensive mechanism to gauge whether a variable placement is a good one. Any implementation would likely bene t from novel hardware and/or software support for pro ling and placing variables. Run-time placement techniques have already been shown to work well for virtual memory page placement [BLRC94].
� The current placement algorithms targeted performance improvements for a user-speci ed xed-
size target cache geometry. Performance improvements on other cache geometries were not as impressive and in many cases stability was lost. Methods have been developed for virtual page placement that optimize for multiple target cache geometries, e.g., Kessler's hierarchical page placement algorithm. Incorporating these approaches into the variable placement algorithm would likely improve program performance over a range of cache geometries.
� The partitioning and grouping phases of variable placement could not be applied to heap variables, resulting in many missed opportunities to improve the cache performance of heap variables. If the placement optimizations were instead directed at the virtual memory system, the larger size of virtual memory pages would permit heap variables to be candidates for all phases of variable placement optimization.
114
� The current pro ling strategy uses pro les with xed array and bucket sizes. While this approach is simple to implement, memory limitations usually require pro les to be small, resulting in low resolution pro les and poor quality pro le information. Pro le precision and memory demands could both be improved through the use of P -quantile pro les. A P -quantile pro le is a pro le with variable-size buckets which track the start and end points of where each 1=P of the samples lie. One disadvantage of P -quantile pro les is that they require two passes over the sample stream, however, P -quantile estimators [BZ93, JC85] have been shown to work well with only a single pass. Alternatively, pro les could support progressively increasing buckets sizes like those employed in the Paradyn parallel performance measurement tools [MCC+ 95].
Bibliography [AHH88] [AP93] [APS95] [AS92] [ASU86] [ASW+ 93] [AVS93] [BC91] [BCT92] [BEH91] [BF92] [BHIL94] [BKW90] [BLRC94]
115
A. Agarwal, J. Hennessy, and M. Horowitz. Cache performance of operating systems and multiprogramming. ACM Transactions on Computer Systems, 6(4):393{431, November 1988. A. Agarwal and S. D. Pudar. Column-associative caches: A technique for reducing the miss rate of direct-mapped caches. Proceedings of the 20th Annual International Symposium on Computer Architecture, 21(2):179{190, May 1993. T. M. Austin, D. N. Pnevmatikatos, and G. S. Sohi. Streamlining data cache access with fast address calculation. Proceedings of the 22nd Annual International Symposium on Computer Architecture, 23(2):369{380, June 1995. T. M. Austin and G. S. Sohi. Dynamic dependency analysis of ordinary programs. In Conference Proceedings of the 19th Annual International Symposium on Computer Architecture, pages 342{351. Association for Computing Machinery, May 1992. A. V. Aho, R. Sethi, and J. D. Ullman. Compilers: Principles, Techniques, and Tools. Addison-Wesley, Reading, MA, 1986. S. G. Abraham, R. A. Sugumar, D. Windheiser, B. R. Rau, and R. Gupta. Predictability of load/store instruction latencies. Proceedings of the 26th Annual International Symposium on Microarchitecture, pages 139{152, December 1993. T. M. Austin, T.N. Vijaykumar, and G. S. Sohi. Knapsack: A zero-cycle memory hierarchy component. Technical Report TR 1189, Computer Sciences Department, UW{Madison, Madison, WI, November 1993. J.-L. Baer and T.-F. Chen. An e�ective on-chip preloading scheme to reduce data access penalty. Supercomputing '91, pages 176{186, 1991. P. Briggs, K. D. Cooper, and L. Torczon. Rematerialization. Proceedings of the ACM SIGPLAN '92 Conference on Programming Language Design and Implementation, 27(7):311{ 321, July 1992. D. G. Bradlee, S. J. Eggers, and R. R. Henry. Integrating register allocation and instruction scheduling for RISCs. Proceedings of the 4th International Conference on Architectural Support for Programming Languages and Operating Systems, 19(2):122{131, April 1991. B. K. Bray and M. J. Flynn. Translation hint bu�ers to reduce access time of physicallyaddressed instruction caches. Proceedings of the 25th Annual International Symposium on Microarchitecture, 23(1):206{209, December 1992. J. Borkenhagen, G. Handlogten, J. Irish, and S. Levenstein. AS/400 64-bit PowerPCcompatible processor implementation. ICCD, 1994. A. Borg, R. E. Kessler, and D. W. Wall. Generation and analysis of very long address traces. Proceedings of the 17th Annual International Symposium on Computer Architecture, 18(2):270{279, May 1990. B. N Bershad, D. Lee, T. H. Romer, and J. B. Chen. Avoiding con ict misses dynamically in large direct-mapped caches. Conference Proceedings of the Sixth International Symposium on Architectural Support for Programming Languages and Operating Systems, 1994.
116 [BRG+ 89] D. Black, R. Rashid, D. Golub, C. Hill, and R. Baron. Translation lookaside bu�er consistency: A software approach. Proceedings of the Third International Conference on Architectural Support for Programming Languages Operating Systems, pages 113{122, 1989. [BZ93] D. A. Barrett and B. G. Zorn. Using lifetime predictors to improve memory allocation performance. Proceedings of the ACM SIGPLAN '93 Conference on Programming Language Design and Implementation, 28(6):187{196, June 1993. [CB92] T.-F. Chen and J.-L. Baer. Reducing memory latency via non-blocking and prefetching caches. Conference Proceedings of the Fifth International Symposium on Architectural Support for Programming Languages and Operating Systems, 27(9):51{61, October 1992. [CBJ92] J. B. Chen, A. Borg, and N. P. Jouppi. A simulation based study of TLB performance. Proceedings of the 19th Annual International Symposium on Computer Architecture, 19(2):114{123, May 1992. [CBM+ 92] W. Y. Chen, R. A. Bringmann, S. A. Mahlke, R. E. Hank, and J. E. Sicolo. An e�cient architecture for loop based data preloading. Proceedings of the 25th Annual International Symposium on Microarchitecture, 23(1):92{101, December 1992. [CCH+ 87] F. Chow, S. Correll, M. Himelstein, E. Killian, and L. Weber. How many addressing modes are enough. Conference Proceedings of the Second International Symposium on Architectural Support for Programming Languages and Operating Systems, pages 117{121, October 1987. [CCK90] D. Callahan, S. Carr, and K. Kennedy. Improving register allocation for subscripted variables. Proceedings of the ACM SIGPLAN '90 Conference on Programming Language Design and Implementation, 25(6):53{65, June 1990. [CD89] C.-H. Chi and H. Dietz. Uni ed management of registers and cache using liveness and cache bypass. Proceedings of the ACM SIGPLAN '89 Conference on Programming Language Design and Implementation, 24(7):344{355, July 1989. [Che87] R. Cheng. Virtual address caches in UNIX. Proceedings of the Summer 1987 USENIX Technical Conference, pages 217{224, 1987. [CK92] T. Chiueh and R. H. Katz. Eliminating the address translation bottleneck for physical address cache. Proceedings of the Fifth International Symposium on Architectural Support for Programming Languages and Operating Systems, 27(9):137{148, October 1992. [CK93] R. F. Cmelik and D. Keppel. Shade: A fast instruction set simulator for execution pro ling. Technical Report UWCSE 93-06-06, Department of Computer Science and Engineering, University of Washington, Seattle, WA, 1993. [CL89] C.-L. Chen and C.-K. Liao. Analysis of vector access performance on skewed interleaved memory. Proceedings of the 16th Annual International Symposium on Computer Architecture, 17(3):387{394, May 1989. [CMMP95] T. Conte, K. Menezes, P. Mills, and B. Patel. Optimization of instruction fetch mechanisms for high issue rates. Proceedings of the 22nd Annual International Symposium on Computer Architecture, 23(2):333{344, June 1995. [CMT94] S. Carr, K. S. McKinley, and C.-W. Tseng. Compiler optimizations for improving data locality. Proceedings of the 6th International Conference on Architectural Support for Programming Languages and Operating Systems, 28(5):252{262, October 1994.
117 [Con92]
T. M. Conte. Tradeo�s in processor/memory interfaces for superscalar processors. Proceedings of the 25th Annual International Symposium on Microarchitecture, 23(1):202{205, December 1992. [Dav95] B. Davidson. The Microsoft LEGO system. UW-Madison Programming Languages Seminar presentation, September 1995. [DM82] D. R. Ditzel and H. R. McLellan. Register allocation for free: the C machine stack cache. In 1st International Conference on Architectural Support for Programming Languages and Operating Systems, pages 48{56, Palo Alto, CA, March 1982. [DS91] F. Dahlgren and P. Stenstrom. On recon gurable on-chip data caches. Proceedings of the 24th Annual International Symposium on Microarchitecture, 22(1):189{198, November 1991. [ECP96] M. Evers, P.-Y. Chang, and Y. N. Patt. Using hybrid branch predictors to improve branch prediction accuracy in the presence of context switches. Proceedings of the 23nd Annual International Symposium on Computer Architecture, May 1996. [EV93] R. J. Eickemeyer and S. Vassiliadis. A load-instruction unit for pipelined processors. IBM J. Res. Develop., 37(4):547{564, July 1993. [Fer74] D. Ferrari. Improving locality by critical working sets. Communications of the ACM, 17(11):614{620, November 1974. [Fer76] D. Ferrari. The improvement of program behavior. Computer, 9(11):39{47, November 1976. [Fis81] J. A. Fisher. Trace scheduling: A technique for global microcode compaction. IEEE Transaction on Computers, C-30(7):478{490, July 1981. [FJ94] K. I. Farkas and N. P. Jouppi. Complexity/performance tradeo�s with non-blocking loads. Proceedings of the 21st Annual International Symposium on Computer Architecture, 22(2):211{222, April 1994. [FP91] M. Farrens and A. Park. Dynamic base register caching: A technique for reducing address bus width. Proceedings of the 18th Annual International Symposium on Computer Architecture, 19(3):128{137, May 1991. [Fra93] M. Franklin. A New Paradigm for Superscalar Processing. PhD thesis, UW{Madison, Madison, WI, To appear 1993. [Gao93] Q. S. Gao. The chinese remainder theorem and the prime memory system. Proceedings of the 20th Annual International Symposium on Computer Architecture, 21(2):337{340, May 1993. [GGK+ 83] A. Gottlieb, R. Grishman, C. P. Kruskal, K. P. McAuli�e, L. Rudolph, and M. Snir. The nyu ultracomputer { designing a mimd, shared memory parallel machine. IEEE Transactions on Computers, 32(2):175{189, February 1983. [GM86] P. B. Gibbons and S. S. Muchnick. E�cient instruction scheduling for pipelined processors. Proceedings of the SIGPLAN 1986 Symposium on Compiler Construction, 21(7), July 1986. [GM93] M. Golden and T. Mudge. Hardware support for hiding cache latency. CSE-TR-152-93, University of Michigan, Dept. of Electrical Engineering and Computer Science, February 1993.
118 [GM94]
M. Golden and T. Mudge. A comparison of two pipeline organizations. Proceedings of the 27th Annual International Symposium on Microarchitecture, 25(1):153{161, November 1994. [Gwe94a] L. Gwennap. Digital leads the pack with 21164. Microprocessor Report, 8(12):1{10, September 1994. [Gwe94b] L. Gwennap. MIPS R10000 uses decoupled architecture. Microprocessor Report, 8(14):18{ 22, October 1994. [Gwe95] L. Gwennap. Hal reveals multichip SPARC processor. Microprocessor Report, 9(3):1{11, March 1995. [Hea86] M. Hill and et al. Design decisions in SPUR. IEEE Computer, 19(11):8{22, November 1986. [HG71] D. J. Hat eld and J Gerald. Program restructuring for virtual memory. IBM Systems Journal, 10(3):168{192, 1971. [HHL+ 90] K. Hua, A. Hunt, L. Liu, J-K. Peir, D. Pruett, and J. Temple. Early resolution of address translation in cache design. Proceedings of the 1990 IEEE International Conference on Computer Design, pages 408{412, September 1990. [HP90] J. L. Hennessy and D. A. Patterson. Computer Architecture: A Quantitative Approach. Morgan Kaufmann Publishers Inc., San Mateo, CA, 1990. [HS89] M. D. Hill and A. J. Smith. Evaluating associativity in CPU caches. IEEE Transactions on Computers, 38(12):1612{1630, December 1989. [Hsu94] P. Y.{T. Hsu. Designing the TFP microprocessor. IEEE Micro, 14(2):23{33, April 1994. [IL89] D. T. Harper III and D. A. Linebarger. A dynamic storage scheme for con ict-free vector access. Proceedings of the 16th Annual International Symposium on Computer Architecture, 17(3):72{77, May 1989. [JC85] R. Jain and I. Chlamtac. The P 2 algorithm for dynamic calculation of quantiles and histograms without storing observations. Communications of the ACM, 28(10):1076{1085, October 1985. [JE95] T. E. Jeremiassen and S. J. Eggers. Reducing false sharing on shared memory multiprocessors through compile-time data transformations. Proceedings of the Symposium on Principals and Practice of Parallel Programming, July 1995. [Jol91] R. Jolly. A 9-ns 1.4 gigabyte/s, 17-ported CMOS register le. IEEE J. of Solid-State Circuits, 25:1407{1412, October 1991. [Jou89] N. P. Jouppi. Architecture and organizational tradeo�s in the design of the MultiTitan CPU. Proceedings of the 16st Annual International Symposium on Computer Architecture, 17(3):281{289, May 1989. [Jou90] N. P. Jouppi. Improving direct-mapped cache performance by the addition of a small fully-associative cache and prefetch bu�ers. Proceedings of the 17th Annual International Symposium on Computer Architecture, 18(2):364{373, May 1990. [Jou93] N. P. Jouppi. Cache write policies and performance. Proceedings of the 20th Annual International Symposium on Computer Architecture, 21(2):191{201, May 1993. [JW94] N. P. Jouppi and S. J.E. Wilton. Tradeo�s in two-level on-chip caching. Proceedings of the 21st Annual International Symposium on Computer Architecture, 22(2):34{45, April 1994.
119 [KCE92]
E. J. Koldinger, J. S. Chase, and S. J. Eggers. Architectural support for single address space operating systems. Proceedings of the Fifth International Symposium on Architectural Support for Programming Languages and Operating Systems, 27(9):175{186, October 1992. [KE93] D. R. Kerns and S. J. Eggers. Balanced scheduling: Instruction scheduling when memory latency is unknown. Proceedings of the 1992 ACM SIGPLAN Conference on Programming Language Design and Implementation, 28(6):278{289, June 1993. [Kes91] R. E. Kessler. Analysis of Multi-Megabyte Secondary CPU Cache Memories. Tr 1032, Computer Sciences Department, UW{Madison, Madison, WI, July 1991. [KH92a] G. Kane and J. Heinrich. MIPS RISC Architecture. Prentice Hall, Englewood Cli�s, NJ, 1992. [KH92b] P. Kolte and M. J. Harrold. Load/store range analysis for global register allocation. Proceedings of the ACM SIGPLAN '93 Conference on Programming Language Design and Implementation, 28(6):268{277, June 1992. [KJLH89] R. E. Kessler, R. Jooss, A. Lebeck, and M. D. Hill. Inexpensive implementations of set-associativity. Proceedings of the 16th Annual International Symposium on Computer Architecture, 17(3):131{139, 1989. [KT91] M. Katevenis and N. Tzartzanis. Reducing the branch penalty by rearranging instructions in a double-width memory. Fourth International Conference on Architectural Support for Programming Languages and Operating Systems, 19(2):15{27, April 1991. [LBF92] W. L. Lynch, B. K. Bray, and M. J. Flynn. The e�ect of page allocation on caches. Proceedings of the 25th Annual International Symposium on Microarchitecture, 23(1):222{ 225, December 1992. [LE89] H. Levy and R. Eckhouse. Computer Programming and Architecture, The VAX. Digital Press, 1989. [LGN92] P. Lenir, R. Govindarajan, and S.S. Nemawarkar. Exploiting instruction-level parallelism: The multithreaded approach. Proceedings of the 25th Annual International Symposium on Microarchitecture, 23(1):189{192, December 1992. [LRW91] M. S. Lam, E. E. Rothberg, and M. E. Wolf. The cache performance and optimizations of blocked algorithms. Proceedings of the 4th International Conference on Architectural Support for Programming Languages and Operating Systems, pages 63{74, April 1991. [LS94] A. Lebeck and G. Sohi. Request combining in multiprocessors with arbitrary interconnection networks. IEEE TPDS, November 1994. [LS95] J. R. Larus and E. Schnarr. EEL: Machine-independent executable editing. Proceedings of the ACM SIGPLAN '95 Conference on Programming Language Design and Implementation, 30(6):291{300, June 1995. [LW94] A. R. Lebeck and D. A. Wood. Cache pro ling and the spec benchmarks: A case study. IEEE Computer, 27(10):15{26, October 1994. [MCC+ 95] B. P. Miller, M. D. Callaghan, J. M. Cargille, J. K. Hollingsworth, R. B. Irvin, K. L. Karavanic, K. Kunchithapadam, and T. Newhall. The Paradyn parallel performance measurement tools. IEEE Computer, 28(11), November 1995. [McF89] S. McFarling. Program optimization for instruction caches. Third International Symposium on Architectural Support for Programming Languages and Operating Systems, 24:183{191, April 1989.
120 [McF91]
S. McFarling. Procedure merging with instruction caches. Proceedings of the ACM SIGPLAN '91 Conference on Programming Language Design and Implementation, 26(6):71{ 79, June 1991. [McF92] S. McFarling. Cache replacement with dynamic exclusion. Proceedings of the 19th Annual International Symposium on Computer Architecture, 20(2):191{200, May 1992. [ME92] S.-M. Moon and K. Ebcio�glu. An e�cient resource-constrained global scheduling technique for superscalar and VLIW processors. Proceedings of the 25th Annual International Symposium on Microarchitecture, pages 55{71, December 1992. [MLC+ 92] S. A. Mahlke, D. C. Lin, W. Y. Chen, R. E. Hank, and R. A. Bringmann. E�ective compiler support for predicated execution using the hyperblock. In Conference Record of the 25th Annual International Symposium on Microarchitecture, pages 45{54, Portland, OR, December 1992. Association for Computing Machinery. [MLG92] T. C. Mowry, M. S. Lam, and A. Gupta. Design and evaluation of a compiler algorithm for prefetching. Conference Proceedings of the Fifth International Symposium on Architectural Support for Programming Languages and Operating Systems, 27(9):62{73, October 1992. [MMO+ 94] A. B. Montz, D. Mosberger, S. W. O'Malley, L. L. Peterson, T. A. Proebsting, and J. H. Hartman. Scout: A communications-oriented operating system. Technical Report TR 94{20, Department of Computer Science, University of Arizona, Tucson, AZ, June 1994. [Mue95] F. Mueller. Compiler support for software-based cache partitioning. ACM SIGPLAN Workshop on Languages, Compilers, and Tools for Real-Time Systems, 30(11):125{133, June 1995. [PH90] K. Pettis and R. C. Hansen. Pro le guided code positioning. Proceedings of the ACM SIGPLAN '90 Conference on Programming Language Design and Implementation, 25(6):16{ 27, June 1990. [PS90] K. V. Palem and B. B. Simmons. Scheduling time-critical instructions on RISC machines. SIGPLAN Notices, 25(6):270{279, June 1990. [Rau91] B. R. Rau. Pseudo-randomly interleaved memory. Proceedings of the 18th Annual International Symposium on Computer Architecture, 19(3):74{83, May 1991. [RL92] A. Rogers and K. Li. Software support for speculative loads. Conference Proceedings of the Fifth International Symposium on Architectural Support for Programming Languages and Operating Systems, pages 38{50, October 1992. [Sez93] A. Seznec. A case for two-way skewed-associative caches. Proceedings of the 20th Annual International Symposium on Computer Architecture, 21(2):169{178, May 1993. [SF91] G. S. Sohi and M. Franklin. High-bandwidth data memory systems for superscalar processors. Proceedings of the 4th International Conference on Architectural Support for Programming Languages and Operating Systems, pages 53{62, April 1991. [SL93] A. Seznec and J. Lenfant. Odd memory systems may be quite interesting. Proceedings of the 20th Annual International Symposium on Computer Architecture, 21(2):341{350, May 1993. [Sla94] M. Slater. AMD's K5 designed to outrun Pentium. Microprocessor Report, 8(14):1{11, October 1994. [Smi81] B. J. Smith. Architecture and applications of the HEP multiprocessor. SPIE, pages 241{ 248, 1981.
121 [Smi82a] [Smi82b]
A. J. Smith. Cache memories. Computing Surveys, 14(3):473{530, September 1982. J. E. Smith. Decoupled access/execute architectures. Proceedings of the 9th Annual International Symposium on Computer Architecture, pages 112{119, April 1982. [SPE91] SPEC newsletter. Fairfax, Virginia, December 1991. [SPE95] SPEC newsletter. Fairfax, Virginia, September 1995. [Ste88] G. Steven. A novel e�ective address calculation mechanism for RISC microprocessors. Computer Architecture News, 16(4):150{156, September 1988. [TH94] M. Talluri and M. D. Hill. Surpassing the TLB performance of superpages with less operating system support. Proceedings of the 6th International Conference on Architectural Support for Programming Languages and Operating Systems, 29(11):171{182, November 1994. [Vee86] A. H. Veen. Data ow machine architecture. Computing Surveys, 18(4):365{396, December 1986. [WBL89] W.-H. Wang, J.-L. Baer, and H. M. Levy. Organization and performance of a two-level virtual-real cache hierarchy. Proceedings of the 16th Annual International Symposium on Computer Architecture, 17(3):140{148, May 1989. [WE88] N. Weste and K. Eshraghian. Principles of CMOS VLSI Design: A Systems Perspective. Addison{Wesley Publishing Company, Inc., 1988. [WEG+ 86] D. A. Wood, S. J. Eggers, G. Gibson, M. D. Hill, J. M. Pendleton, S. A. Ritchie, G. S. Taylor, R. H. Katz, and D. A. Patterson. An in-cache address translation mechanism. Proceedings of the 13th Annual International Symposium on Computer Architecture, 14(2):358{ 365, June 1986. [WJ94] S. J.E. Wilton and N. P. Jouppi. An enhanced access and cycle time model for on-chip caches. Tech report 93/5, DEC Western Research Lab, 1994. [WRP92] T. Wada, S. Rajan, and S. A. Pyzybylski. An analytical access time model for on-chip cache memories. IEEE Journal of Solid-State Circuits, 27(8):1147{1156, August 1992. [Wu92] Y. Wu. Ordering functions for improving memory reference locality in a shared memory multiprocessor system. Proceedings of the 25th Annual International Symposium on Microarchitecture, 23(1):218{221, December 1992. [YP93] T.-Y. Yeh and Y. N. Patt. A comparison of dynamic branch predictors that use two levels of branch history. Proceedings of the 20th Annual International Symposium on Computer Architecture, pages 257{266, May 1993. Computer Architecture News, 21(2), May 1993.
Appendix A
122
The SimpleScalar Architecture Architecture Overview The SimpleScalar architecture is derived from the MIPS-I ISA [KH92a]. The semantics are a superset with the following notable di�erences:
� There are no architected delay slots, i.e., loads, stores, and control transfers do not execute the following instruction.
� Loads and stores support two more addressing modes: indexed and auto-increment and autodecrement, for all data types.
� SQRT implements single- and double-precision oating point square roots. � An extended 64-bit instruction encoding. Table A.1 lists the architected registers in the SimpleScalar architecture, their hardware and software (recognized by the assembler) names, and their description. The quantity and semantics of the registers are identical to the MIPS-IV ISA. Figure A.1 details the three instruction encodings. All instructions are 64-bits in length. The register format is used for computational instructions. The immediate format supports the inclusion of a 16-bit constant. The jump format supports speci cation of 24-bit jump targets. The register elds are all 8 bits, supporting future extension of the register set to 256 integer and oating point registers. Each instruction format has a xed-location, 16-bit opcode eld designed for fast instruction decoding. The annote eld is a 16-bit eld that is written using annotations to instructions in the assembly les. The annotation interface is useful for synthesizing new instructions without having to change and recompile the assembler. Annotations are attached to the opcode, and come in two avors: bit and eld annotations. A bit annotation, written as follows: lw/a
$4,4($5)
The annotation /a speci es that the rst bit of the annotation eld should be set. Bit annotations /a through /p are supported to set bits 0 through 15. Field annotations are written in the form: lw/6:4(7) $4,4($5)
123 Hardware Name $0 $1 $2-$3 $4-$7 $8-$15 $16-$23 $25-$25 $26-$27 $28 $29 $30 $31 $hi $lo $f0-$f31 $fcc
Software Name $zero $at $v0-$v1 $a0-$a3 $t0-$t7 $s0-$s7 $t8-$t9 $k0-$k1 $gp $sp $s8 $ra $hi $lo $f0-$f31 $fcc
Description zero-valued source/sink reserved by assembler fn return result regs fn argument value regs temp regs, caller saved saved regs, callee saved temp regs, caller saved reserved by OS global pointer stack pointer saved regs, callee saved return address reg high result register low result register
oating point registers
oating point condition code
Table A.1: SimpleScalar Architecture Register De nitions 16−annote
16−opcode
8−rs
8−rt
8−rd 8−ru/shamt
R − Register Format: 63
32 31
16−annote
16−opcode
8−rs
0
8−rt
16−imm
I − Immediate Format: 63
32 31
16−annote
16−opcode 6−unused
0
24−target
J − Jump Format: 63
32 31
0
Figure A.1: SimpleScalar Architecture Instruction Formats This annotation sets the 3-bit eld starting at bit 4 to bit 6 within the 16-bit annotation eld to the value 7.
Instruction Set De nition This section lists all SimpleScalar instructions with their opcode, instruction and assembler formats, and semantics. The semantics are expressed as a C-style expression utilizing the extended operators and operands described in Table A.2. Operands not listed in Table A.2 refer to actual instruction elds described in Figure A.1. For each instruction, the next PC value (NPC) defaults to the current PC value plus 8 (CPC + 8) unless otherwise speci ed.
124 Operator/Operand FS FT FD UIMM IMM OFFSET CPC NPC SET NPC(V) GPR(N) SET GPR(N,V) FPR F(N) SET FPR F(N,V) FPR D(N) SET FPR D(N,V) FPR L(N) SET FPR L(N,V) HI SET HI(V) LO SET LO(V) READ SIGNED BYTE(A) READ UNSIGNED BYTE(A) WRITE BYTE(V,A) READ SIGNED HALF(A) READ UNSIGNED HALF(A) WRITE HALF(V,A) READ WORD(A) WRITE WORD(V,A) TALIGN(T) FPALIGN(N) OVER(X,Y) UNDER(X,Y) DIV0(V)
Semantics same as eld RS same as eld RT same as eld RD IMM eld unsigned-extended to word value IMM eld sign-extended to word value IMM eld sign-extended to word value PC value of executing instruction next PC value Set next PC to value V General purpose register N Set general purpose register N to value V Floating point register N single-precision value Set oating point register N to single-precision value V Floating point register N double-precision value Set oating point register N to double-precision value V Floating point register N literal word value Set oating point register N to literal word value V High result register value Set high result register to value V Low result register value Set low result register to value V Read signed byte from address A Read unsigned byte from address A Write byte value V at address A Read signed half from address A Read unsigned half from address A Write half value V at address A Read word from address A Write word value V at address A Check target T is aligned to 8 byte boundary Check register N is wholly divisible by 2 Check for over ow when adding X to Y Check for over ow when subtraction Y from X Check for division by zero error with divisor V
Table A.2: Operator/Operand Semantics
Control Instructions J:
Opcode: Instruction Format: Assembler Format: Semantics: JAL: Opcode: Instruction Format: Assembler Format: Semantics:
JR:
Jump to absolute address. 0x01 J J target
SET NPC((CPC&0xf0000000) | (TARGET