ISSN (Print) : 2319-8613 ISSN (Online) : 0975-4024
Vijayalaxmi Biradar / International Journal of Engineering and Technology (IJET)
Hardware Implementation of Driver Fatigue Detection System Vijayalaxmi Biradar#1 #
Department of ECE Vignan Institute of Technology and Science, Deshmukhi, Hyderabad, India 1
[email protected] Abstract -- An efficient hardware for detecting driver Fatigue is implemented using non-intrusive vision based approach and DM3730 Processor. In this system a Logitech USB camera is fixed at a distance of 30cm which points towards driver’s face and monitors face and eyes to detect driver fatigue. The entire system works on Linux operating system and uses DM3730 processor as hardware. An image processing algorithm is developed to estimate whether eyes are open or closed and fatigue is estimated using PERCLOS method. Eye blink rate for normal human being is 12 times per minute. In this algorithm if eyes are closed for 15 consecutive frames in a minute or if PERCLOS > 80% than system issues warning to stop the vehicle. The system is tested on 45 different persons i.e., 15 women, 15 men and 15 persons wearing spectacles and the detection rate is 99.2%. The time taken by the system to detect driver fatigue and issuing warning is less than 5ms. The entire system can be easily placed inside vehicle as hardware used is small in size and easily implementable without distracting the driver. Keywords: Camera, Driver, Eye, Face, Fatigue, PERCLOS I. INTRODUCTION Driver fatigue is a serious threat to the transportation department. Driver fatigue is the major contributing factors for most of the road accidents. Ryan, Wright, Hinrichs and McLean in 1998 carried out research in depth on crashes, 31.4% of driver’s admitted that they felt slightly, moderately and strongly fatigue before accident. This chapter reviews about the techniques that have been developed before or during the development of this work. It is the summary of all related work carried out, the methods and components required in this research. The drawbacks of the existing methods, advantages and limitations are discussed in this Literature review. There are many technologies for Fatigue detection which are divided into biological indicators, vehicle behaviour and face analysis. A. Monitoring Biological Characteristics In this technique the biological changes of drivers are recognized from bio-signals such as ElectroEncephalon-Gram(EEG), Electro-Occulo-Graph (EOG), and Electro-Cardio-Gram (ECG or EKG). The sleep of human being is strongly correlated with brain and heart activities, these bio-signals give accurate fatigue detection (Lal,S.K.L.,et.al.,2003, Eoh,H.J.,et.al., 2005 and Lin,C.T., et.al., 2005). The researches on these techniques to measure bio-signals require electrodes on drivers’ head, face or chest. The HR varies rapidly between different stages of drowsiness, such as fatigue and alertness. Few research works show that drowsiness can also be measured using HRV which gives LF and HF signals, falls in range of 0.04- 0.15Hz and 0.140.25Hz respectively (Karamjeet Singh, and Rupinder Kaur, 2013). [1,2,3,4] B. Monitoring Vehicle Behaviour Driver fatigue based on vehicle behaviour is influenced by characteristics of speed, curvature and lane width, driving experience, driver state. Standard deviation, Steering wheel angle are few parameters used to measure steering behaviour (Liu, Y.-C.,et.al.,1990), velocity of steering wheel (Peters, R. D.,et.al.,1999), McDonald & Hoffman in 1980 proposed steering wheel rate; Verwey in 2000, measured HF components of steering wheel angle and steering entropy. Driver fatigue analysed based on steering wheel is concluded as small, micro corrections, zigzag and slow oscillations, lateral drift, driver’s comfort zone (Paul, A., et.al.,2006).[5,6,7] C. Image Processing Based Techniques The above discussed methods for driver fatigue detection based on ECG,EEG where electrodes need to be attached to human body, are known as intrusive system. These systems are characterized by reliability and robustness because these bio-signals can be easily acquired and achieve good results in-terms of detection of driver fatigue. But problem with these approaches is, acquiring large number of signals and processing makes these systems complex and invasive, moreover it is difficult to place the system inside the vehicle. The other class of DFD System is non-intrusive system which are based on visual observation, hence doesn’t affect i.e., fatigue is estimated based on eye blink rate through image processing Advancement in the field of image and computer vision processing made it possible to detect driver fatigue at wheel.
DOI: 10.21817/ijet/2017/v9i1/170901404
Vol 9 No 1 Feb-Mar 2017
24
ISSN (Print) : 2319-8613 ISSN (Online) : 0975-4024
Vijayalaxmi Biradar / International Journal of Engineering and Technology (IJET)
It is observed that driver fatigue first appears in eyes and mouth, hence DFD system based on image and computer vision involves extraction of facial features. Face recognition has been used for many applications in real time such as face recognition systems used at airports to provide high level security, Human Computer Interface (HCI) based on facial expression to control mouse and the keyboard. Automatic face extraction leads to criminal identification, security, surveillance system and smart phone applications (Mohammed Saaidia, and Sylvie Lelandais, 2007). Research shows that, the most promising face recognition methods are Eigen Vectors, Principal Component Analysis (PCA), Skin Segmentation, Artificial Neural Network (ANN), and Template Matching.[8] D. Fatigue Detection Systems Development of technology to detect fatigue is a challenging task faced by most of the transportation company. Driving vehicle is difficult task on road because driver should be capable of taking correct decisions on road under different conditions. Recent statistics show that fatigue is the main reason for 19% fatal accidents and 27% of injury road. Driving for long hours, inappropriate sleep makes the driver feel fatigue which in turn makes them sleepy (Elzohairy, Y.,2008). The research shows that, cause of an accident falls into three categories: human, vehicle and environmental conditions. In majority of accidents, driver contribution to accidents is 93%, vehicle contribution is 13% and environmental conditions contribute about 34%. In few cases, the cause of an accident can be contribution of more than one factor. [9] Many researchers worked on techniques to find driver fatigue and alert them to avoid accidents on road. The reduction in crashes related to driver fatigue is the need to be addressed with some innovative concepts and methodologies. Fatigue driver exhibits certain behaviours like eye gaze, head movement, pupil movement and facial expression which are observable. Hartley et al., proposed classification of technologies for driver fatigue detection system into following categories: i. Mathematical models of dynamic alertness. ii. Vehicle based techniques to measure SWM, speed, and lane deviation. iii. Real time invasive and Non-invasive fatigue detection system. In 1992, researcher proposed an intrusive system to detect driver fatigue monitoring system. Intrusive system provides physical contact with driver. The level of invasiveness is measured based on interaction between driver detection systems. Non-intrusive systems provide no contact with the driver. Experimental result show that, intrusive systems provide better results compared to non-intrusive system. In 1997 & 2001, researchers proposed driver fatigue measurement using physiological parameters. The system measured ECG, EEG, EOG, Skin temperature, orientation, O2 level in the blood saturation. These physiological parameters are acquired directly; hence systems achieve better detection results. The problems with this technique are, acquiring large number of signals and processing makes it complex and extreme invasiveness. Monitoring above mentioned signals require large practical devices which cannot be easily placed inside the vehicle. Liu, Schreiner & Dingus in 1990, used steering wheel metrics which measure behaviour of steering using ‘σ’ (standard deviation) wheel angle (Liu, Y.C.,et.al.,1990). [5] Jarek Krajewski, David Sommer, et.al., proposed fatigue detection depending on steering measured using signal processing procedure for extracting features and computes 3 features time, frequency and state space values. The method yields a recognition rate of 86.1% which is highest detection rate achieved in steering behaviour based driver fatigue detection (Jarek Krajewski, David Sommer,et.al.,2007). [10] In 2005, researchers proposed fatigue estimation using driver feedback, the method is non-intrusive but makes driver tiresome and annoying (Artaud et.al, Mabbott et.al, 2005) [11]. In 2006, Martin Gallagher used non-intrusive eye based & pressure sensor for fatigue detection. They used pressure sensor circuit along with ADuC8031, PC, Camera. The success rate was 80% , drawback was it takes 8secs to process a frame and does not work on occluded face, different illumination condition (Martin Gallagher,2006-07). [12] In 2010, researchers made use of PERCLOS to detect driver fatigue, which detects eyes open, semi open, close. But time taken was more and required high grade PC to process the frames. In 2011, an author used Haar features to detect driver fatigue based on eye blink, the method works on rotated images with a success rate of 96% but fails to warn the driver and testing is done on computer.
DOI: 10.21817/ijet/2017/v9i1/170901404
Vol 9 No 1 Feb-Mar 2017
25
ISSN (Print) : 2319-8613 ISSN (Online) : 0975-4024
Vijayalaxmi Biradar / International Journal of Engineering and Technology (IJET)
II. FLOW CHART FOR DRIVER FATIGUE DETECTION SYSTEM Driver fatigue detection system flowchart is shown in Figure 1. Fatigue detection system processes real time video stream to identify drivers’ different fatigue level by detecting the frames in which eyes are open/closed. As shown in Figure 1, as soon as the board power is ON, firstly it will check for all the connected peripherals working condition such as keyboard, mouse, camera, GSM module and speakers. If anyone of this is not working properly, then the board is reset using RESET button for rebooting. After successful verification of all peripherals, Camera starts capturing video stream. For the video stream, the system checks for lighting. For poor lighting condition, a set of 50 LED’s can be used to illuminate driver’s face. This set of 50 LED’s as source of illumination for testing purpose is used in the Laboratory and is fixed such that it does not illuminate the drivers face directly. If the light source directly falls on drivers face than it would be difficult for the driver to drive the vehicle due to reflection. Hence, it is used only for testing purpose. The captured video stream is converted into frames, to perform image processing task to estimate driver’s fatigue based on Eye blink rate and Yawning. The proposed image processing algorithm for Fatigue estimation is discussed in next section. The driver fatigue is estimated using Eye blink rate, the warning is issued to the driver, if still driver fails to stop the vehicle or take necessary step, than an SMS alert will be sent to the registered number. III. REAL TIME IMPLEMENTATION OF DRIVER FATIGUE DETECTION SYSTEM Real time HPLP detection system is developed using image processing where driver's face is recorded through camera continuously. Most of the image processing based system depend on intensity changes, hence it is required that background should not contain any object with strong intensity changes. The camera connected may capture highly reflective object behind the driver’s seat as an eyes. The design of the prototype is developed assuming that inside the vehicle there is no direct light and background is uniform. As per the requirement, when the ambient light is poor (night time), a light source must be present to compensate the effect of poor light. Since it is a prototype, 50 LED’s light source is used which illuminates the driver’s face during poor lighting condition. This light source is fixed such that it will not illuminate driver’s eyes directly. If the source of light is not taken into consideration, the camera
DOI: 10.21817/ijet/2017/v9i1/170901404
Vol 9 No 1 Feb-Mar 2017
26
ISSN (Print) : 2319-8613 ISSN (Online) : 0975-4024
Vijayalaxmi Biradar / International Journal of Engineering and Technology (IJET)
Power on Board
No
Verify Peripherals Yes Capture Video
Read Frame
Perform Image Processing
Check Eye Blink Rate & Yawning
No
PERCLOS> 80%
Yes
Activate Alarm- To Stop Vehicle
Not Stopped?
Take Rest Yes
No
Send SMS Fig 1: Flow chart for Driver Fatigue Detection System
with lights can be used for capturing the driver’s image which will illuminate the image. The Fatigue detection system consists of Logitech Pro 9000 USB camera to capture driver’s face. The camera is placed in front of driver’s face, approximately 25cm away from the face. Position of the camera is such that, it must meet the following criteria i. Majority of the captured frame should contain driver’s face ii. Drivers face should be at the centre of the frame. The above discussed two criteria reduce the complexity of identifying face and eye certain extent. Figure 2 shows the prototype of the driver fatigue detection system. In real time the entire setup is tested by placing this system in a vehicle as shown in Figure 2.
DOI: 10.21817/ijet/2017/v9i1/170901404
Vol 9 No 1 Feb-Mar 2017
27
ISSN (Print) : 2319-8613 ISSN (Online) : 0975-4024
Vijayalaxmi Biradar / International Journal of Engineering and Technology (IJET)
Light Source
Camera
Monitor
Board
Steering Wheel
Keyboard Mouse Fig 2: Prototype of Driver Fatigue Detection System
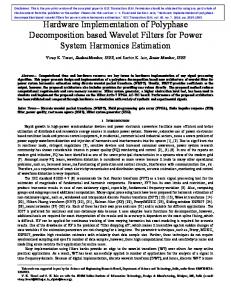
The driver fatigue detection system is developed and tested on OpenSource Beagleboard Xm hardware. The BeagleBoard-Xm has a faster CPU core (clocked at 1GHz ), RAM (512MB ), onboard Ethernet jack and 4 port USB hub. A. Specifications Processor – DM3730 ARM Frequency – 1GHz TMS320C64x + DSP - 800MHz 256MB NAND flash memory 256MB of RAM External memory card slot – Used 8GB B. Mechanical Specifications Size : 3.35”x3.45” Layers: 6 C. Power Connector USB OTG 5V DC Power Jack Below Figure 3 shows the driver fatigue detection system implementation
DOI: 10.21817/ijet/2017/v9i1/170901404
Vol 9 No 1 Feb-Mar 2017
28
ISSN (Print) : 2319-8613 ISSN (Online) : 0975-4024
Vijayalaxmi Biradar / International Journal of Engineering and Technology (IJET)
Fig 3: Hardware implementation of Driver Fatigue Detection System
The Logitech USB camera is connected to one of the USB port to capture images at the rate of 30fps. The camera is fixed in front of the driver such that it continuously captures the driver image. The captured video is read in the form of images and is processed to identify weather the driver eyes are open/close. The entire fatigue detection algorithm is developed using OpenCV (Open Source Computer Vision) library and the coding is done using Python programming language. All the softwares required to develop driver fatigue detection system were installed on to the 8GB memory card after installing Ubuntu 11.10 Operating System. The process is continued and each frame will be checked to detect the face and eyes. If the driver eyes are closed consecutively for 15frames than the driver will be alerted through speakers which are connected to the audio jack of the Beagleboard Xm. IV. RESULTS The complete set up is made in the laboratory and proposed algorithm is tested on four (GTAV, Face Expression, MathWorks Video and VITS) database images and live testing is also performed on 45 different persons under different illumination conditions. The setup is shown in figure below. The results of the proposed algorithm are shown in figure, under different illumination conditions different head positions and for persons with and without glasses. The images used for testing the proposed algorithm are tabulated in Table I TABLE I. Images used for Testing the System
S.N.
Database
Total No. of Images
1
Face Expression
148
2
GTAV
46
3
MathWorks Video
126
4
VITS
200
5
Live
45(15 Women, 15 Men, 15 persons wearing glasses
The overall success rate of the proposed system is calculated using equation (1) given below
-------------(1)
Where TP=True Positive, TN = True Negative, FP=False Positive, FN=False Negative the overall detection of the HPLP Driver Fatigue detection system is calculated using Equation (5.1),(5.2) & (5.3) i.e., in terms of Overall Detection, Sensitivity and Specificity. It is tested on recorded video using Logitech camera of duration 65sec, the specifications of video are shown in Table 5.3.
DOI: 10.21817/ijet/2017/v9i1/170901404
Vol 9 No 1 Feb-Mar 2017
29
ISSN (Print) : 2319-8613 ISSN (Online) : 0975-4024
Vijayalaxmi Biradar / International Journal of Engineering and Technology (IJET)
TABLE II. Recorded Video Specification
Specifications Frame Rate Image size Duration of video Total frames Bit rate
Value @30fps 480x640 65sec 1950 10062Kbps
The TP (True Positive), FP (False Positive), FN (False Negative) and TN (True Negative) images of the recorded video are given below. True Positive (TP) = 6 False Positive (FP) =2 False Negative (FN) =2 and True Negative (TN) =1890 Overall Detection = 97.7% Sensitivity = 75% Specificity = 99.89% The Overall Detection rate is 97.7%, while the Sensitivity is the parameter to measure true positive rate which is 75% and specificity measures true negative rate is 99.89%. This shows that, system detects the True Negative rate efficiently when measured on recorded video. The HPLP Driver Fatigue detection system is tested Live on video captured through the Logitech camera of duration 65sec, the specifications of video are mentioned in Table 5.4. TABLE III. Live Video stream Specification
Specifications Frame Rate Image size Duration of video Total frames Bit rate
Value @30fps 480x640 85sec 2550 10062Kbps
The TP (True Positive), FP (False Positive), FN (False Negative) and TN (True Negative) images during Live testing are given below. True Positive (TP) = 27 False Positive (FP) = 4 False Negative (FN) = 2 and True Negative (TN) = 2517 Overall Detection= 99.7% Sensitivity = 93.10% Specificity= 99.8% The Overall Detection rate is 99.7%, while the sensitivity which measures true positive rate is 93.10% and specificity which measures true negative is 99.8%. This shows that, system detects the true positive and true negative rate efficiently when measured Live. The simulation results of proposed Driver Fatigue Detection System tested in the laboratory are shown in Figure 4.
DOI: 10.21817/ijet/2017/v9i1/170901404
Vol 9 No 1 Feb-Mar 2017
30
ISSN (Print) : 2319-8613 ISSN (Online) : 0975-4024
Vijayalaxmi Biradar / International Journal of Engineering and Technology (IJET)
Simulation result of Open Eye
Simulation result of Closed Eye Fig 4: Simulation Results
V. CONCLUSION In this paper a new system is proposed to estimate driver fatigue using image processing technique. Driver fatigue is estimated based on eye blink rate and is calculated using PERCLOS method. If the eyes are closed for 15 frames or if PERCLOS is >80% than the driver is entering into drowsiness and driver is alerted to stop the vehicle. The face and eye are detected using Haar Cascade Classifier. Eye Open/Close is estimated using contours and counting the number of white pixels. The entire set up is made in the laboratory and tested on GTAV, Mathworks Video, Face expression and VITS Database images. The system is tested on a video and the overall detection rate is 97.7%. The system is also tested Live and the overall detection rate is 99.7%. The system is developed on Beagleboard Xm hardware on Linux Operating System and the entire image processing code is developed using Python programming language. The developed algorithm works on different illumination, head rotation and persons wearing glasses. The time taken by the algorithm to estimate driver fatigue is